Facilities Management Jobs with Work from Home Options

Facilities Management
UK > Work from Home

The table below provides summary statistics for permanent job vacancies with an option to work from home (WFH) and a requirement for Facilities Management skills. Included is a benchmarking guide to the salaries offered in vacancies that have cited Facilities Management over the 6 months to 6 May 2024 with a comparison to the same period in the previous 2 years.

6 months to
6 May 2024
Same period 2023 Same period 2022
Rank 502 630 768
Rank change year-on-year +128 +138 -241
Permanent jobs citing Facilities Management 81 32 76
As % of all permanent jobs with a WFH option 0.24% 0.076% 0.11%
As % of the Processes & Methodologies category 0.26% 0.079% 0.11%
Number of salaries quoted 68 27 34
10th Percentile £42,031 £35,000 £37,500
25th Percentile £52,500 £38,250 £47,813
Median annual salary (50th Percentile) £55,000 £42,500 £52,500
Median % change year-on-year +29.41% -19.05% +10.53%
75th Percentile £59,063 £71,250 £59,688
90th Percentile £63,750 £86,062 £63,750
UK median annual salary £52,000 £51,250 £50,000
% change year-on-year +1.46% +2.50% +5.26%

All Process and Methodology Skills
Work from Home

Facilities Management is in the Processes and Methodologies category. The following table is for comparison with the above and provides summary statistics for all permanent job vacancies with a WFH option and a requirement for process or methodology skills.

Permanent vacancies with a requirement for process or methodology skills 31,014 40,730 66,290
As % of all permanent jobs with a WFH option 91.60% 96.10% 96.92%
Number of salaries quoted 23,557 28,305 41,490
10th Percentile £33,750 £37,500 £36,250
25th Percentile £42,500 £47,500 £45,750
Median annual salary (50th Percentile) £57,500 £62,500 £60,000
Median % change year-on-year -8.00% +4.17% +9.09%
75th Percentile £75,000 £82,500 £80,000
90th Percentile £95,000 £100,000 £95,000
UK median annual salary £55,000 £61,500 £60,000
% change year-on-year -10.57% +2.50% +9.09%

Facilities Management
Trend for Jobs with a WFH Option

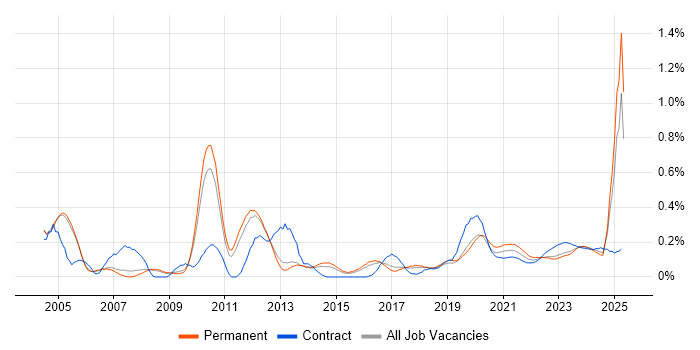
Job vacancies with a work from home option citing Facilities Management as a proportion of all IT jobs advertised.

Facilities Management trend for jobs with a WFH option

Facilities Management
Salary Trend for Jobs with a WFH Option

3-month moving average salary quoted in job vacancies with a work from home option citing Facilities Management.

Facilities Management salary trend for jobs with a WFH option

Facilities Management
Salary Histogram for Jobs with a WFH Option

Salary distribution for jobs with a work from home option citing Facilities Management over the 6 months to 6 May 2024.

Facilities Management salary histogram for jobs with a WFH option

Facilities Management
Co-occurring Skills and Capabilities with WFH Options by Category

The follow tables expand on the table above by listing co-occurrences grouped by category. The same employment type, locality and period is covered with up to 20 co-occurrences shown in each of the following categories:

Application Platforms
1 4 (4.94%) ArcGIS
2 3 (3.70%) SharePoint
Applications
1 8 (9.88%) Microsoft Excel
2 5 (6.17%) Microsoft PowerPoint
3 2 (2.47%) Microsoft Office
Business Applications
1 4 (4.94%) Sparx Enterprise Architect
Cloud Services
1 32 (39.51%) SaaS
2 9 (11.11%) Power Platform
3 7 (8.64%) Boomi
3 7 (8.64%) iPaaS
4 6 (7.41%) Azure
4 6 (7.41%) GCP
5 5 (6.17%) Microsoft 365
6 4 (4.94%) IaaS
6 4 (4.94%) PaaS
7 2 (2.47%) PowerApps
8 1 (1.23%) Intacct
8 1 (1.23%) Power Automate
Communications & Networking
1 3 (3.70%) Intranet
1 3 (3.70%) Remote Desktop
2 2 (2.47%) HTTP
2 2 (2.47%) TCP/IP
3 1 (1.23%) VPN
Database & Business Intelligence
1 13 (16.05%) MySQL
2 9 (11.11%) Power BI
3 8 (9.88%) SQL Server
4 6 (7.41%) Relational Database
5 4 (4.94%) Geospatial Data
5 4 (4.94%) GIS
6 1 (1.23%) Big Data
6 1 (1.23%) EDMS
6 1 (1.23%) Qlik Sense
6 1 (1.23%) SQL Server Reporting Services
6 1 (1.23%) Tableau
Development Applications
1 2 (2.47%) JIRA
2 1 (1.23%) Appium
2 1 (1.23%) Cucumber
2 1 (1.23%) JUnit
2 1 (1.23%) Selenium
2 1 (1.23%) SoapUI
2 1 (1.23%) TestNG
2 1 (1.23%) TestRail
2 1 (1.23%) WebDriver
General
1 24 (29.63%) Social Skills
2 20 (24.69%) Automotive
2 20 (24.69%) Marketing
3 19 (23.46%) Legal
3 19 (23.46%) Manufacturing
4 16 (19.75%) Retail
5 8 (9.88%) Finance
6 7 (8.64%) Inclusion and Diversity
6 7 (8.64%) Public Sector
7 3 (3.70%) Organisational Skills
8 2 (2.47%) Analytical Skills
9 1 (1.23%) Aerospace
9 1 (1.23%) Back Office
9 1 (1.23%) Billing
9 1 (1.23%) Fire and Rescue
9 1 (1.23%) Law
9 1 (1.23%) Local Government
Job Titles
1 20 (24.69%) Business Manager
2 19 (23.46%) Business Development Manager
2 19 (23.46%) Development Manager
3 13 (16.05%) Developer
4 12 (14.81%) Analyst
5 7 (8.64%) Integration Developer
5 7 (8.64%) Systems Developer
6 6 (7.41%) Project Manager
6 6 (7.41%) Software Developer
7 5 (6.17%) Architect
7 5 (6.17%) Facilities Manager
7 5 (6.17%) Facilities Project Manager
7 5 (6.17%) Head of Implementation
8 4 (4.94%) Category Manager
8 4 (4.94%) IT Architect
8 4 (4.94%) IT Manager
8 4 (4.94%) IT Procurement Manager
8 4 (4.94%) Procurement Manager
8 4 (4.94%) Solutions Architect
9 3 (3.70%) Service Analyst
Libraries, Frameworks & Software Standards
1 8 (9.88%) HTML
2 7 (8.64%) CSS
3 6 (7.41%) AngularJS
3 6 (7.41%) React
3 6 (7.41%) Symfony
4 4 (4.94%) .NET
5 2 (2.47%) REST
6 1 (1.23%) Gherkin
6 1 (1.23%) XML
Miscellaneous
1 10 (12.35%) Self-Motivation
2 8 (9.88%) Management Information System
3 3 (3.70%) EPoS
4 2 (2.47%) Driving Licence
4 2 (2.47%) Housing Association
4 2 (2.47%) iPad
4 2 (2.47%) Social Media
5 1 (1.23%) Blog
5 1 (1.23%) IoT
5 1 (1.23%) Low-Code
5 1 (1.23%) Mobile App
5 1 (1.23%) NHS
5 1 (1.23%) Renewable Energy
Operating Systems
1 2 (2.47%) Windows
2 1 (1.23%) Windows Server
Processes & Methodologies
1 25 (30.86%) Decision-Making
2 23 (28.40%) Logistics
3 21 (25.93%) Asset Management
4 19 (23.46%) Business Development
5 12 (14.81%) Agile
5 12 (14.81%) Project Management
6 11 (13.58%) Budget Management
6 11 (13.58%) Business Intelligence
6 11 (13.58%) Information Security
7 10 (12.35%) Full Stack Development
7 10 (12.35%) People Management
7 10 (12.35%) Problem-Solving
8 9 (11.11%) Business Strategy
9 8 (9.88%) CAFM
10 7 (8.64%) Customer Service
10 7 (8.64%) Data Analysis
10 7 (8.64%) Robotic Process Automation
10 7 (8.64%) SDLC
10 7 (8.64%) Strategic Thinking
10 7 (8.64%) Translating Business Requirements
Programming Languages
1 10 (12.35%) SQL
2 9 (11.11%) Python
3 6 (7.41%) PHP
3 6 (7.41%) TypeScript
4 2 (2.47%) Java
4 2 (2.47%) JavaScript
5 1 (1.23%) Data Analysis Expressions
5 1 (1.23%) T-SQL
Qualifications
1 18 (22.22%) Degree
2 4 (4.94%) DBS Check
2 4 (4.94%) Master's Degree
2 4 (4.94%) SC Cleared
2 4 (4.94%) Security Cleared
2 4 (4.94%) TOGAF Certification
3 2 (2.47%) HND
4 1 (1.23%) Azure Certification
4 1 (1.23%) CCNA
4 1 (1.23%) Cisco Certification
4 1 (1.23%) ISTQB
Quality Assurance & Compliance
1 4 (4.94%) ISO 14000
2 3 (3.70%) NEBOSH
2 3 (3.70%) QA
3 2 (2.47%) Accessibility
4 1 (1.23%) Data Quality
System Software
1 6 (7.41%) Docker
2 1 (1.23%) VMware Infrastructure
Systems Management
1 6 (7.41%) Kubernetes
Vendors
1 12 (14.81%) Microsoft
2 7 (8.64%) Jitterbit
2 7 (8.64%) Talend
3 6 (7.41%) Google
4 4 (4.94%) ESRI
4 4 (4.94%) Sparx
5 1 (1.23%) Alteryx
5 1 (1.23%) OpenText
5 1 (1.23%) Sage
5 1 (1.23%) SAP
5 1 (1.23%) Vertica
5 1 (1.23%) VMware