SaaS Jobs with Hybrid/Remote/WFH Options

Software as a Service (SaaS)
UK > Work from Home

The table below provides summary statistics for permanent remote or hybrid work requiring SaaS skills. It includes a benchmarking guide to the annual salaries offered in vacancies that cited SaaS over the 6 months leading up to 3 July 2025, comparing them to the same period in the previous two years.

6 months to
3 Jul 2025
Same period 2024 Same period 2023
Rank 92 52 43
Rank change year-on-year -40 -9 0
Permanent jobs citing SaaS 758 1,629 2,383
As % of all permanent jobs with a WFH option 3.72% 4.72% 6.63%
As % of the Cloud Services category 11.34% 11.06% 13.86%
Number of salaries quoted 585 1,306 1,632
10th Percentile £33,000 £40,000 £42,500
25th Percentile £43,250 £49,813 £51,750
Median annual salary (50th Percentile) £65,000 £62,500 £65,000
Median % change year-on-year +4.00% -3.85% -7.14%
75th Percentile £80,000 £83,750 £85,000
90th Percentile £115,000 £97,500 £100,000
UK median annual salary £65,000 £60,000 £65,000
% change year-on-year +8.33% -7.69% -

All Cloud Skills
Work from Home

SaaS falls under the Cloud Services category. For comparison with the information above, the following table provides summary statistics for all permanent job vacancies with remote or hybrid options requiring cloud computing skills.

Permanent vacancies with a requirement for cloud computing skills 6,683 14,726 17,188
As % of all permanent jobs with a WFH option 32.79% 42.70% 47.79%
Number of salaries quoted 4,447 11,789 13,177
10th Percentile £31,500 £36,250 £38,000
25th Percentile £45,000 £45,000 £48,750
Median annual salary (50th Percentile) £62,500 £60,000 £65,000
Median % change year-on-year +4.17% -7.69% -
75th Percentile £82,500 £80,000 £85,000
90th Percentile £110,000 £101,250 £103,750
UK median annual salary £60,000 £57,500 £63,000
% change year-on-year +4.35% -8.73% +0.80%

SaaS
Trend for Jobs with a WFH Option

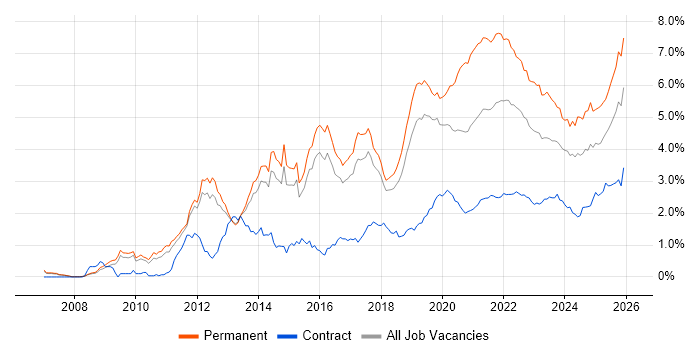
Job vacancies with remote working options citing SaaS as a proportion of all IT jobs advertised.

SaaS trend for jobs with Hybrid/Remote/WFH options

SaaS
Salary Trend for Jobs with a WFH Option

3-month moving average salary quoted in job vacancies with remote working options citing SaaS.

SaaS salary trend for jobs with a WFH option

SaaS
Salary Histogram for Jobs with a WFH Option

Salary distribution for jobs with remote working options citing SaaS over the 6 months to 3 July 2025.

SaaS salary histogram for jobs with a WFH option

SaaS
Co-occurring Skills and Capabilities with WFH Options by Category

The follow tables expand on the table above by listing co-occurrences grouped by category. The same employment type, locality and period is covered with up to 20 co-occurrences shown in each of the following categories:

Application Platforms
1 36 (4.75%) Microsoft Exchange
2 18 (2.37%) Confluence
2 18 (2.37%) IIS
3 11 (1.45%) SharePoint
4 6 (0.79%) Apache
5 3 (0.40%) Apache Airflow
5 3 (0.40%) CMS
6 2 (0.26%) Jupyter
6 2 (0.26%) Oracle Workflow
6 2 (0.26%) WordPress
7 1 (0.13%) Apache Spark
7 1 (0.13%) IBM Notes
7 1 (0.13%) Moodle
7 1 (0.13%) Tomcat
7 1 (0.13%) Totara
Applications
1 21 (2.77%) Microsoft Excel
2 19 (2.51%) Microsoft PowerPoint
3 6 (0.79%) Photoshop
4 5 (0.66%) Microsoft Office
5 2 (0.26%) Adobe Creative Suite
5 2 (0.26%) Adobe Illustrator
5 2 (0.26%) Adobe Premiere
5 2 (0.26%) Adobe XD
5 2 (0.26%) InDesign
5 2 (0.26%) MS Visio
5 2 (0.26%) Sketch
6 1 (0.13%) S-PLUS
6 1 (0.13%) Spreadsheet
Business Applications
1 22 (2.90%) NetSuite
2 21 (2.77%) Shopify
3 15 (1.98%) Magento
4 5 (0.66%) Dynamics NAV
5 4 (0.53%) Dynamics CRM
6 2 (0.26%) Dynamics AX
6 2 (0.26%) Raiser’s Edge
7 1 (0.13%) FastStats
7 1 (0.13%) Oracle EBS
7 1 (0.13%) Oracle EBS R12
7 1 (0.13%) Oracle Procure-to-Pay
7 1 (0.13%) Remedy ITSM
Cloud Services
1 226 (29.82%) Azure
2 181 (23.88%) AWS
3 85 (11.21%) PaaS
4 63 (8.31%) IaaS
5 61 (8.05%) Power Platform
6 60 (7.92%) Azure DevOps
7 55 (7.26%) GCP
8 49 (6.46%) Microsoft 365
9 42 (5.54%) Entra ID
10 34 (4.49%) GitHub
11 24 (3.17%) Azure Key Vault
12 20 (2.64%) Dynamics 365
13 18 (2.37%) Azure ExpressRoute
14 17 (2.24%) Azure Monitor
14 17 (2.24%) OCI
14 17 (2.24%) Power Automate
15 16 (2.11%) Azure AI
15 16 (2.11%) Azure Service Bus
15 16 (2.11%) Cloud Computing
16 15 (1.98%) BigCommerce
Communications & Networking
1 33 (4.35%) Firewall
2 32 (4.22%) DNS
3 27 (3.56%) VPN
4 18 (2.37%) Internet
4 18 (2.37%) WAN
5 17 (2.24%) SD-WAN
6 14 (1.85%) TCP/IP
7 11 (1.45%) Wi-Fi
8 7 (0.92%) HTTP
9 5 (0.66%) DHCP
10 4 (0.53%) DKIM
10 4 (0.53%) DMARC
10 4 (0.53%) DNSSEC
10 4 (0.53%) HTTPS
10 4 (0.53%) SMTP
11 3 (0.40%) Network Security
11 3 (0.40%) SAN
11 3 (0.40%) SSL
11 3 (0.40%) VoIP
12 2 (0.26%) BGP
Database & Business Intelligence
1 65 (8.58%) SQL Server
2 53 (6.99%) Power BI
3 31 (4.09%) MySQL
4 26 (3.43%) Data Hub
4 26 (3.43%) SQL CLR
5 21 (2.77%) NoSQL
6 18 (2.37%) Data Lake
6 18 (2.37%) Relational Database
7 16 (2.11%) Metadata
7 16 (2.11%) SQL Server Reporting Services
8 13 (1.72%) SQL Server Analysis Services
9 10 (1.32%) Data Warehouse
10 8 (1.06%) RDBMS
11 6 (0.79%) Oracle Database
12 5 (0.66%) Amazon RDS
12 5 (0.66%) Azure SQL Database
12 5 (0.66%) Elasticsearch
12 5 (0.66%) PostgreSQL
12 5 (0.66%) SQL Server Integration Services
13 4 (0.53%) MongoDB
Development Applications
1 48 (6.33%) Git
2 24 (3.17%) JIRA
3 15 (1.98%) Jenkins
4 10 (1.32%) Eclipse
4 10 (1.32%) IntelliJ
4 10 (1.32%) Protractor
5 9 (1.19%) Jasmine
5 9 (1.19%) JUnit
5 9 (1.19%) Karma Test Runner
5 9 (1.19%) Mockito
6 8 (1.06%) Oracle Forms
7 6 (0.79%) Visual Studio
8 5 (0.66%) Cypress.io
8 5 (0.66%) SonarQube
9 4 (0.53%) PHPUnit
9 4 (0.53%) Selenium
9 4 (0.53%) SpecFlow
9 4 (0.53%) WiX
10 3 (0.40%) MSTest
10 3 (0.40%) NUnit
General
1 271 (35.75%) Social Skills
2 192 (25.33%) Finance
3 87 (11.48%) Analytical Skills
4 67 (8.84%) Marketing
5 57 (7.52%) Presentation Skills
6 40 (5.28%) Back Office
7 34 (4.49%) Retail
8 32 (4.22%) Law
9 24 (3.17%) Automotive
10 23 (3.03%) Public Sector
11 21 (2.77%) Organisational Skills
12 19 (2.51%) Banking
13 16 (2.11%) Advertising
14 14 (1.85%) Inclusion and Diversity
14 14 (1.85%) Legal
15 12 (1.58%) Billing
15 12 (1.58%) Telecoms
16 11 (1.45%) Manufacturing
17 10 (1.32%) Health Technology
18 9 (1.19%) Local Government
Job Titles
1 135 (17.81%) Senior
2 114 (15.04%) Developer
3 75 (9.89%) Lead
4 57 (7.52%) Architect
5 44 (5.80%) Senior Developer
6 41 (5.41%) Analyst
6 41 (5.41%) SaaS Developer
7 35 (4.62%) Software Engineer
8 33 (4.35%) Product Manager
9 32 (4.22%) Cloud Architect
9 32 (4.22%) Consultant
10 27 (3.56%) Development Manager
11 26 (3.43%) Business Development Manager
11 26 (3.43%) Business Manager
12 24 (3.17%) IT Support
12 24 (3.17%) Support Engineer
13 23 (3.03%) Full-Stack Engineer
13 23 (3.03%) IT Manager
14 22 (2.90%) Cloud Engineer
14 22 (2.90%) Full-Stack Developer
Libraries, Frameworks & Software Standards
1 74 (9.76%) .NET
2 65 (8.58%) React
3 45 (5.94%) REST
4 40 (5.28%) HTML
5 35 (4.62%) CSS
6 26 (3.43%) .NET Core
6 26 (3.43%) AngularJS
7 25 (3.30%) Node.js
8 22 (2.90%) .NET Framework
8 22 (2.90%) Next.js
9 18 (2.37%) Entity Framework
10 17 (2.24%) XML
11 16 (2.11%) Kafka
12 15 (1.98%) Flask
13 14 (1.85%) FastAPI
14 13 (1.72%) ASP.NET
14 13 (1.72%) Dapper ORM
14 13 (1.72%) Web Services
15 12 (1.58%) Middleware
16 11 (1.45%) SAML
Miscellaneous
1 62 (8.18%) Product Ownership
2 61 (8.05%) Onboarding
3 36 (4.75%) Data Centre
4 35 (4.62%) Cloud Native
5 33 (4.35%) Private Cloud
6 28 (3.69%) Enterprise Software
7 27 (3.56%) Distributed Systems
8 26 (3.43%) Self-Motivation
9 22 (2.90%) Management Information System
9 22 (2.90%) NHS
10 20 (2.64%) Legacy Systems
10 20 (2.64%) Social Media
11 16 (2.11%) Driving Licence
11 16 (2.11%) Virtual Team
12 15 (1.98%) EPoS
12 15 (1.98%) Public Cloud
13 14 (1.85%) Team-Oriented Environment
14 12 (1.58%) Hybrid Cloud
14 12 (1.58%) IoT
15 10 (1.32%) Algorithms
Operating Systems
1 80 (10.55%) Windows
2 47 (6.20%) Linux
3 42 (5.54%) Windows Server
4 9 (1.19%) Mac OS
5 8 (1.06%) Windows Server 2019
6 5 (0.66%) Windows 10
6 5 (0.66%) Windows Server 2016
7 4 (0.53%) Unix
7 4 (0.53%) Windows Server 2008
7 4 (0.53%) Windows Server 2012
8 1 (0.13%) CentOS
8 1 (0.13%) Debian
8 1 (0.13%) Red Hat Enterprise Linux
8 1 (0.13%) Ubuntu
8 1 (0.13%) VMS
Processes & Methodologies
1 206 (27.18%) Agile
2 189 (24.93%) Problem-Solving
3 134 (17.68%) DevOps
4 108 (14.25%) B2B
5 105 (13.85%) Roadmaps
6 100 (13.19%) Software Engineering
7 94 (12.40%) Mentoring
8 85 (11.21%) Analytics
9 84 (11.08%) Artificial Intelligence
10 82 (10.82%) CI/CD
11 72 (9.50%) CRM
11 72 (9.50%) Migration
12 71 (9.37%) Continuous Improvement
13 67 (8.84%) Customer Service
14 66 (8.71%) Decision-Making
15 65 (8.58%) Fintech
16 62 (8.18%) Project Management
17 61 (8.05%) Data Privacy
18 60 (7.92%) Full-Stack Development
19 59 (7.78%) Service Management
Programming Languages
1 171 (22.56%) SQL
2 99 (13.06%) C#
3 80 (10.55%) Python
4 79 (10.42%) JavaScript
5 61 (8.05%) TypeScript
6 56 (7.39%) PowerShell
7 30 (3.96%) Java
8 22 (2.90%) Bicep
9 19 (2.51%) T-SQL
10 13 (1.72%) Bash
11 9 (1.19%) PHP
12 8 (1.06%) Delphi
13 7 (0.92%) C
13 7 (0.92%) F#
14 6 (0.79%) PL/SQL
15 5 (0.66%) C++
15 5 (0.66%) Haskell
16 3 (0.40%) Data Analysis Expressions
16 3 (0.40%) Go
16 3 (0.40%) Scala
Qualifications
1 105 (13.85%) Degree
2 44 (5.80%) DBS Check
3 37 (4.88%) Azure Certification
4 30 (3.96%) Computer Science Degree
5 28 (3.69%) Microsoft Certification
6 18 (2.37%) Security Cleared
7 16 (2.11%) MCSA
7 16 (2.11%) MCSE
8 12 (1.58%) CISSP
9 11 (1.45%) PMI Certification
10 10 (1.32%) ACCA
10 10 (1.32%) CCNP
10 10 (1.32%) Cisco Certification
10 10 (1.32%) MCP
10 10 (1.32%) PMP
11 8 (1.06%) CCNA
12 7 (0.92%) DV Cleared
13 6 (0.79%) CISM
13 6 (0.79%) Master's Degree
14 5 (0.66%) BPSS Clearance
Quality Assurance & Compliance
1 30 (3.96%) ISO/IEC 27001
2 23 (3.03%) QA
3 16 (2.11%) SLA
4 12 (1.58%) Accessibility
5 9 (1.19%) GDPR
6 8 (1.06%) NIST
7 6 (0.79%) ISO 9001
7 6 (0.79%) NCSC
8 5 (0.66%) PMO
8 5 (0.66%) Sarbanes-Oxley
9 4 (0.53%) Actionable Recommendations
9 4 (0.53%) Cyber Essentials
9 4 (0.53%) GRC
9 4 (0.53%) ISO/IEC 27002 (supersedes ISO/IEC 17799)
9 4 (0.53%) PCI DSS
10 3 (0.40%) GAAP
10 3 (0.40%) PMBOK
10 3 (0.40%) SOC 2
11 2 (0.26%) Cyber Essentials PLUS
11 2 (0.26%) IFRS
System Software
1 56 (7.39%) Docker
2 38 (5.01%) VMware Infrastructure
3 31 (4.09%) Active Directory
4 24 (3.17%) Virtual Machines
5 8 (1.06%) Virtual Desktop
6 5 (0.66%) VMware ESXi
7 3 (0.40%) vSphere
8 1 (0.13%) KVM
8 1 (0.13%) Xen
Systems Management
1 63 (8.31%) Terraform
2 53 (6.99%) Kubernetes
3 27 (3.56%) Single Sign-On
4 26 (3.43%) Ansible
5 13 (1.72%) Failover Clustering
6 12 (1.58%) Microsoft Intune
7 4 (0.53%) SCCM
8 3 (0.40%) SmoothWall
9 2 (0.26%) Active Directory Federation Services
9 2 (0.26%) Host Intrusion Detection System
9 2 (0.26%) Jamf Pro
9 2 (0.26%) Puppet
10 1 (0.13%) CASB
10 1 (0.13%) CFEngine
10 1 (0.13%) Grafana
10 1 (0.13%) HP UCMDB
10 1 (0.13%) Progress Chef
10 1 (0.13%) Prometheus
10 1 (0.13%) Proxmox
10 1 (0.13%) SCOM
Vendors
1 116 (15.30%) Microsoft
2 48 (6.33%) VMware
3 40 (5.28%) Oracle
4 31 (4.09%) Google
5 26 (3.43%) Databricks
6 25 (3.30%) Salesforce
7 16 (2.11%) Meraki
8 15 (1.98%) HubSpot
9 11 (1.45%) Cisco
9 11 (1.45%) MuleSoft
10 9 (1.19%) IBM
11 7 (0.92%) Adobe
11 7 (0.92%) EMC
11 7 (0.92%) ServiceNow
12 6 (0.79%) SAP
13 4 (0.53%) Alteryx
13 4 (0.53%) Atlassian
13 4 (0.53%) IronPort
13 4 (0.53%) TOWER Software
13 4 (0.53%) Veritas