Hybrid/Remote Broadband Job Trends

Broadband
UK > Work from Home

The table below provides summary statistics and salary benchmarking for remote or hybrid work requiring Broadband skills. It covers permanent job vacancies from the 6 months leading up to 8 November 2025, with comparisons to the same periods in the previous two years.

6 months to
8 Nov 2025
Same period 2024 Same period 2023
Rank 192 257 418
Rank change year-on-year +65 +161 +2
Permanent jobs citing Broadband 229 234 79
As % of all permanent jobs with remote/hybrid work options 1.43% 1.18% 0.36%
As % of the Communications & Networking category 13.34% 9.75% 2.57%
Number of salaries quoted 97 18 47
10th Percentile - £20,500 -
25th Percentile - £30,156 £21,250
Median annual salary (50th Percentile) £25,087 £43,250 £30,000
Median % change year-on-year -42.00% +44.17% -47.83%
75th Percentile - £52,500 £48,125
90th Percentile £31,900 £53,600 £82,500
UK median annual salary £25,087 £37,500 £25,000
% change year-on-year -33.10% +50.00% -58.33%

All Communications and Computer Networking Skills
Work from Home

Broadband falls under the Communications and Computer Networking category. For comparison with the information above, the following table provides summary statistics for all permanent job vacancies with remote or hybrid options requiring communications or computer networking skills.

Permanent vacancies with a requirement for communications or computer networking skills 1,716 2,400 3,078
As % of all permanent jobs with a WFH option 10.75% 12.08% 13.93%
Number of salaries quoted 1,003 1,382 2,572
10th Percentile £26,000 £31,250 £31,250
25th Percentile £31,000 £41,250 £41,250
Median annual salary (50th Percentile) £49,000 £55,000 £55,000
Median % change year-on-year -10.91% - -
75th Percentile £70,000 £71,250 £73,750
90th Percentile £87,500 £84,842 £85,000
UK median annual salary £37,500 £53,000 £50,000
% change year-on-year -29.25% +6.00% -4.76%

Broadband
Job Vacancy Trend for Remote/Hybrid Jobs

Historical trend showing the proportion of permanent IT job postings citing Broadband and offering remote or hybrid work options relative to all permanent IT jobs advertised.
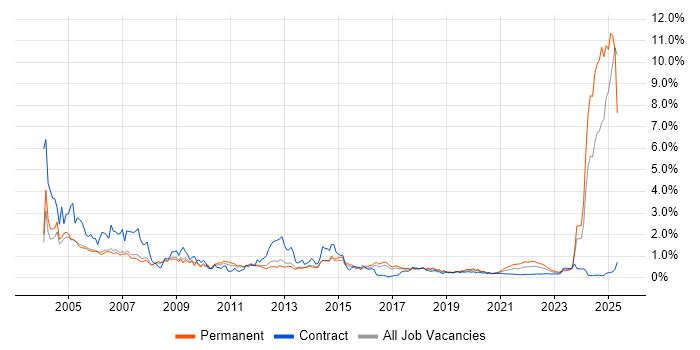
Broadband job vacancy trend for remote/hybrid jobs

Broadband
Salary Trend for Remote/Hybrid Jobs

Salary distribution trend for jobs with remote/hybrid work options citing Broadband.

Salary distribution trend for jobs with remote/hybrid work options citing Broadband

Broadband
Salary Histogram for Remote/Hybrid Jobs

Salary distribution for jobs with remote/hybrid work options citing Broadband over the 6 months to 8 November 2025.

Broadband salary histogram for jobs with remote/hybrid work options

Broadband
Co-Occurring Skills & Capabilities in Remote/Hybrid Jobs by Category

The following tables expand on the one above by listing co-occurrences grouped by category. They cover the same employment type, locality and period, with up to 20 co-occurrences shown in each category:

Application Platforms
1 2 (0.87%) Confluence
1 2 (0.87%) Microsoft Exchange
1 2 (0.87%) SharePoint
2 1 (0.44%) CMS
Applications
1 5 (2.18%) Microsoft Office
2 1 (0.44%) AutoCAD
2 1 (0.44%) Photoshop
Business Applications
1 1 (0.44%) Shopify
Cloud Services
1 21 (9.17%) AWS
2 13 (5.68%) Serverless
3 12 (5.24%) Azure
4 11 (4.80%) AWS Lambda
5 8 (3.49%) Entra ID
6 7 (3.06%) Amazon S3
6 7 (3.06%) AWS Step Functions
7 6 (2.62%) GCP
8 5 (2.18%) Google Workspace
8 5 (2.18%) Microsoft 365
9 4 (1.75%) Figma
10 3 (1.31%) npm
11 2 (0.87%) Asana
11 2 (0.87%) GitHub
11 2 (0.87%) Miro
11 2 (0.87%) Pulumi
12 1 (0.44%) Akamai
12 1 (0.44%) Amazon ECS
12 1 (0.44%) AWS IoT
12 1 (0.44%) Power Platform
Communications & Networking
1 12 (5.24%) Ethernet
2 9 (3.93%) Wi-Fi
3 7 (3.06%) VoIP
4 5 (2.18%) ADSL
4 5 (2.18%) ADSL2+
4 5 (2.18%) G.fast
4 5 (2.18%) Internet
4 5 (2.18%) PSTN
5 4 (1.75%) DHCP
6 3 (1.31%) DNS
6 3 (1.31%) SSL
6 3 (1.31%) TCP/IP
7 2 (0.87%) DOCSIS
7 2 (0.87%) DSL
7 2 (0.87%) GPON
7 2 (0.87%) IPv4
7 2 (0.87%) IPv6
7 2 (0.87%) PPP
7 2 (0.87%) RTP
7 2 (0.87%) WAN
Database & Business Intelligence
1 8 (3.49%) NoSQL
2 7 (3.06%) DynamoDB
3 5 (2.18%) Elasticsearch
4 3 (1.31%) Big Data
4 3 (1.31%) Data Warehouse
4 3 (1.31%) MySQL
5 2 (0.87%) Couchbase
5 2 (0.87%) MongoDB
5 2 (0.87%) RDBMS
5 2 (0.87%) Relational Database
5 2 (0.87%) SQL Server
5 2 (0.87%) Tableau
6 1 (0.44%) Metadata
6 1 (0.44%) Power BI
Development Applications
1 19 (8.30%) Jenkins
2 15 (6.55%) GitLab
2 15 (6.55%) SonarQube
3 9 (3.93%) JIRA
4 5 (2.18%) Cypress.io
5 4 (1.75%) Git
6 3 (1.31%) CircleCI
6 3 (1.31%) Mocha
6 3 (1.31%) TeamCity
6 3 (1.31%) webpack
7 2 (0.87%) Jaeger
7 2 (0.87%) Octopus Deploy
7 2 (0.87%) Spock
8 1 (0.44%) Cucumber
8 1 (0.44%) Jasmine
General
1 125 (54.59%) Banking
2 103 (44.98%) Games
3 35 (15.28%) Social Skills
4 22 (9.61%) Inclusion and Diversity
5 21 (9.17%) Marketing
5 21 (9.17%) Telecoms
6 13 (5.68%) Billing
7 10 (4.37%) Presentation Skills
8 6 (2.62%) Analytical Skills
8 6 (2.62%) Organisational Skills
9 3 (1.31%) Advertising
9 3 (1.31%) Finance
9 3 (1.31%) Influencing Skills
9 3 (1.31%) Multimedia
10 2 (0.87%) Manufacturing
10 2 (0.87%) Retail
11 1 (0.44%) Pharmaceutical
Job Titles
1 79 (34.50%) Customer Service Advisor
2 34 (14.85%) Senior
3 20 (8.73%) Architect
3 20 (8.73%) Developer
4 17 (7.42%) Development Manager
5 16 (6.99%) Business Development Manager
6 15 (6.55%) Business Manager
7 14 (6.11%) Salesforce Architect
7 14 (6.11%) Senior Developer
8 9 (3.93%) Senior Manager
9 8 (3.49%) Lead
9 8 (3.49%) Salesforce Technical Architect
9 8 (3.49%) Technical Architect
10 7 (3.06%) AWS Developer
10 7 (3.06%) Senior Business Development Manager
10 7 (3.06%) Senior Business Manager
10 7 (3.06%) Senior Development Manager
11 6 (2.62%) Customer Service Representative
11 6 (2.62%) Sales Representative
12 5 (2.18%) Analyst
Libraries, Frameworks & Software Standards
1 22 (9.61%) REST
2 21 (9.17%) SOAP
3 16 (6.99%) GraphQL
4 15 (6.55%) Lightning Web Components
4 15 (6.55%) Visualforce
5 13 (5.68%) React
6 7 (3.06%) Node.js
6 7 (3.06%) Serverless Framework
7 6 (2.62%) Redux
8 5 (2.18%) LDAP
8 5 (2.18%) OAuth
8 5 (2.18%) OpenID
8 5 (2.18%) SAML
9 4 (1.75%) Middleware
10 3 (1.31%) D3.js
11 2 (0.87%) .NET
11 2 (0.87%) Kafka
11 2 (0.87%) RESTful
11 2 (0.87%) Web Services
11 2 (0.87%) WebGL
Miscellaneous
1 21 (9.17%) Product Ownership
2 18 (7.86%) Social Media
3 15 (6.55%) Self-Motivation
4 9 (3.93%) Cyber Threat
4 9 (3.93%) Cyberattack
5 6 (2.62%) Management Information System
5 6 (2.62%) Onboarding
5 6 (2.62%) Video\Live Streaming
6 5 (2.18%) Over-the-Top Content
7 4 (1.75%) IoT
7 4 (1.75%) Smart Home
8 3 (1.31%) Cloud Native
8 3 (1.31%) Mobile App
9 2 (0.87%) Animation
9 2 (0.87%) Embedded Systems
9 2 (0.87%) PKI
10 1 (0.44%) Algorithms
10 1 (0.44%) MPEG
10 1 (0.44%) Public Cloud
10 1 (0.44%) Team-Oriented Environment
Operating Systems
1 7 (3.06%) Linux
2 6 (2.62%) Windows
3 5 (2.18%) Unix
4 2 (0.87%) Mac OS
4 2 (0.87%) OpenWrt
4 2 (0.87%) Windows Server 2012
5 1 (0.44%) Android
Processes & Methodologies
1 96 (41.92%) Customer Service
2 93 (40.61%) Problem-Solving
3 40 (17.47%) Agile
4 36 (15.72%) Roadmaps
5 35 (15.28%) CI/CD
6 25 (10.92%) Continuous Improvement
6 25 (10.92%) Continuous Integration
7 23 (10.04%) DevOps
7 23 (10.04%) Mentoring
8 20 (8.73%) Event-Driven
9 19 (8.30%) Scrum
10 18 (7.86%) OO
11 17 (7.42%) AI
11 17 (7.42%) Business Development
11 17 (7.42%) Design Patterns
12 16 (6.99%) Continuous Delivery
12 16 (6.99%) Technology Roadmap
13 15 (6.55%) Community of Practice
13 15 (6.55%) Configure, Price, Quote (CPQ)
13 15 (6.55%) Technical Analysis
Programming Languages
1 20 (8.73%) Python
2 15 (6.55%) Apex Code
2 15 (6.55%) JavaScript
2 15 (6.55%) SOQL
2 15 (6.55%) SOSL
3 11 (4.80%) TypeScript
4 8 (3.49%) Bash
5 6 (2.62%) Java
5 6 (2.62%) PowerShell
6 5 (2.18%) SQL
6 5 (2.18%) T-SQL
7 3 (1.31%) C#
7 3 (1.31%) C++
7 3 (1.31%) Groovy
7 3 (1.31%) R
8 2 (0.87%) C
8 2 (0.87%) Go
8 2 (0.87%) HLSL
8 2 (0.87%) Kotlin
8 2 (0.87%) Scala
Qualifications
1 10 (4.37%) AWS Certification
2 6 (2.62%) Degree
3 3 (1.31%) Computer Science Degree
4 2 (0.87%) DBS Check
5 1 (0.44%) CISM
5 1 (0.44%) CISSP
5 1 (0.44%) CompTIA Security+
5 1 (0.44%) Numerate Degree
5 1 (0.44%) PhD
5 1 (0.44%) Tableau Certification
Quality Assurance & Compliance
1 9 (3.93%) NIST
2 6 (2.62%) NCSC
3 3 (1.31%) ISO/IEC 27001
4 2 (0.87%) Data Quality
4 2 (0.87%) SLA
5 1 (0.44%) NIST 800
5 1 (0.44%) QA
System Software
1 11 (4.80%) Active Directory
2 10 (4.37%) Docker
3 3 (1.31%) Firmware
4 2 (0.87%) Hyper-V
4 2 (0.87%) VMware Infrastructure
Systems Management
1 9 (3.93%) Kubernetes
2 4 (1.75%) Prometheus
2 4 (1.75%) Terraform
3 3 (1.31%) Ansible
3 3 (1.31%) Grafana
4 2 (0.87%) Argo
4 2 (0.87%) Kustomize
5 1 (0.44%) Nmap
Vendors
1 125 (54.59%) BT
2 24 (10.48%) Salesforce
3 15 (6.55%) Splunk
4 11 (4.80%) Microsoft
5 7 (3.06%) Google
6 3 (1.31%) ServiceNow
7 2 (0.87%) Datto
7 2 (0.87%) Oracle
7 2 (0.87%) Thales
7 2 (0.87%) Veeam
7 2 (0.87%) VMware
8 1 (0.44%) Adobe
8 1 (0.44%) Cisco
8 1 (0.44%) CyberArk
8 1 (0.44%) Nokia
8 1 (0.44%) Tenable