Risk Management Jobs with Work from Home Options

Risk Management
UK > Work from Home

The table below provides summary statistics for permanent job vacancies with an option to work from home (WFH) and a requirement for Risk Management skills. Included is a benchmarking guide to the salaries offered in vacancies that have cited Risk Management over the 6 months to 11 May 2024 with a comparison to the same period in the previous 2 years.

6 months to
11 May 2024
Same period 2023 Same period 2022
Rank 123 129 163
Rank change year-on-year +6 +34 +56
Permanent jobs citing Risk Management 850 1,109 1,668
As % of all permanent jobs with a WFH option 2.51% 2.69% 2.43%
As % of the Processes & Methodologies category 2.75% 2.80% 2.50%
Number of salaries quoted 514 802 1,017
10th Percentile £41,250 £42,000 £40,575
25th Percentile £50,000 £47,500 £51,250
Median annual salary (50th Percentile) £60,202 £64,000 £65,000
Median % change year-on-year -5.93% -1.54% -
75th Percentile £85,000 £85,000 £80,000
90th Percentile £102,125 £101,185 £90,000
UK median annual salary £60,000 £65,000 £65,000
% change year-on-year -7.69% - -

All Process and Methodology Skills
Work from Home

Risk Management is in the Processes and Methodologies category. The following table is for comparison with the above and provides summary statistics for all permanent job vacancies with a WFH option and a requirement for process or methodology skills.

Permanent vacancies with a requirement for process or methodology skills 30,884 39,545 66,696
As % of all permanent jobs with a WFH option 91.37% 96.08% 96.99%
Number of salaries quoted 23,455 27,516 41,159
10th Percentile £33,750 £37,500 £36,250
25th Percentile £42,500 £47,500 £45,750
Median annual salary (50th Percentile) £57,500 £62,500 £60,000
Median % change year-on-year -8.00% +4.17% +9.09%
75th Percentile £75,000 £82,500 £80,000
90th Percentile £95,000 £100,000 £95,000
UK median annual salary £55,000 £61,000 £60,000
% change year-on-year -9.84% +1.67% +9.09%

Risk Management
Trend for Jobs with a WFH Option

Job vacancies with a work from home option citing Risk Management as a proportion of all IT jobs advertised.
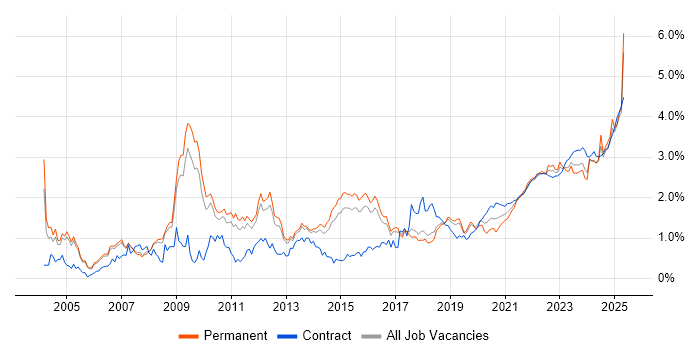
Risk Management trend for jobs with a WFH option

Risk Management
Salary Trend for Jobs with a WFH Option

3-month moving average salary quoted in job vacancies with a work from home option citing Risk Management.

Risk Management salary trend for jobs with a WFH option

Risk Management
Salary Histogram for Jobs with a WFH Option

Salary distribution for jobs with a work from home option citing Risk Management over the 6 months to 11 May 2024.

Risk Management salary histogram for jobs with a WFH option

Risk Management
Co-occurring Skills and Capabilities with WFH Options by Category

The follow tables expand on the table above by listing co-occurrences grouped by category. The same employment type, locality and period is covered with up to 20 co-occurrences shown in each of the following categories:

Application Platforms
1 15 (1.76%) Apache Spark
2 13 (1.53%) IIS
3 12 (1.41%) CMS
4 11 (1.29%) Apache
5 9 (1.06%) SAS
5 9 (1.06%) SharePoint
6 5 (0.59%) Blackberry Enterprise Server
7 4 (0.47%) ArcGIS
7 4 (0.47%) Drupal
7 4 (0.47%) Microsoft Exchange
8 2 (0.24%) Apache Airflow
8 2 (0.24%) Confluence
8 2 (0.24%) Luigi
9 1 (0.12%) IBM Domino
9 1 (0.12%) Skype for Business
Applications
1 76 (8.94%) Microsoft Excel
2 57 (6.71%) Microsoft Project
3 34 (4.00%) Microsoft Office
4 6 (0.71%) Microsoft PowerPoint
5 4 (0.47%) AutoCAD
6 3 (0.35%) Chatbot
7 2 (0.24%) MS Visio
8 1 (0.12%) Spreadsheet
Business Applications
1 59 (6.94%) Primavera
2 6 (0.71%) Dynamics CRM
3 4 (0.47%) Oracle Procure-to-Pay
4 3 (0.35%) Salesforce CRM
5 2 (0.24%) BusinessWorks
5 2 (0.24%) Endur
5 2 (0.24%) SAP S/4HANA
6 1 (0.12%) CA PPM
6 1 (0.12%) Data Workbench
Cloud Services
1 80 (9.41%) Azure
2 59 (6.94%) AWS
3 39 (4.59%) Microsoft 365
4 36 (4.24%) SaaS
5 30 (3.53%) Power Platform
6 27 (3.18%) Cloud Computing
6 27 (3.18%) GCP
7 15 (1.76%) Entra ID
8 7 (0.82%) Azure DevOps
9 5 (0.59%) Snowflake
10 4 (0.47%) Azure Service Bus
10 4 (0.47%) Azure Storage
10 4 (0.47%) Dynamics 365
11 3 (0.35%) Amazon EC2
11 3 (0.35%) Amazon S3
11 3 (0.35%) AWS Lambda
11 3 (0.35%) Serverless
12 2 (0.24%) Google Workspace
12 2 (0.24%) IaaS
12 2 (0.24%) PaaS
Communications & Networking
1 34 (4.00%) Firewall
2 20 (2.35%) TCP/IP
3 16 (1.88%) Internet
4 15 (1.76%) Intrusion Detection
4 15 (1.76%) Network Security
5 11 (1.29%) WAN
6 10 (1.18%) LAN
7 9 (1.06%) HTTP
8 8 (0.94%) Intranet
8 8 (0.94%) Wireless
9 7 (0.82%) Extranet
10 6 (0.71%) VPN
11 5 (0.59%) BGP
11 5 (0.59%) IPsec
11 5 (0.59%) NGFW
11 5 (0.59%) OSPF
11 5 (0.59%) SSL
11 5 (0.59%) VLAN
11 5 (0.59%) Wi-Fi
12 4 (0.47%) TETRA
Database & Business Intelligence
1 20 (2.35%) Data Warehouse
2 18 (2.12%) Tableau
3 15 (1.76%) Electronic Patient Records
3 15 (1.76%) Power BI
3 15 (1.76%) SQL Server
4 12 (1.41%) Big Data
5 9 (1.06%) Hadoop
6 8 (0.94%) NoSQL
6 8 (0.94%) Redis
7 7 (0.82%) Data Lake
7 7 (0.82%) Relational Database
8 6 (0.71%) BigQuery
8 6 (0.71%) Flink
9 5 (0.59%) Elasticsearch
9 5 (0.59%) MS Access
9 5 (0.59%) SQL Server Integration Services
10 4 (0.47%) Azure SQL Database
11 3 (0.35%) Amazon Athena
11 3 (0.35%) Amazon RDS
11 3 (0.35%) SQL Server Reporting Services
Development Applications
1 29 (3.41%) Git
2 17 (2.00%) JIRA
3 8 (0.94%) Jenkins
4 4 (0.47%) Oracle Forms
5 1 (0.12%) IntelliJ
5 1 (0.12%) JUnit
5 1 (0.12%) Subversion
General
1 360 (42.35%) Social Skills
2 304 (35.76%) Finance
3 131 (15.41%) Legal
4 125 (14.71%) Analytical Skills
5 85 (10.00%) Inclusion and Diversity
6 77 (9.06%) Public Sector
7 60 (7.06%) Influencing Skills
8 46 (5.41%) Banking
8 46 (5.41%) Retail
9 36 (4.24%) Presentation Skills
10 29 (3.41%) Marketing
11 28 (3.29%) Manufacturing
11 28 (3.29%) Organisational Skills
12 23 (2.71%) Games
13 21 (2.47%) Telecoms
14 20 (2.35%) Aerospace
15 19 (2.24%) Pharmaceutical
16 14 (1.65%) Health Technology
16 14 (1.65%) Law
17 13 (1.53%) Publishing
Job Titles
1 149 (17.53%) Senior
2 130 (15.29%) Project Manager
3 78 (9.18%) Consultant
4 65 (7.65%) Analyst
5 60 (7.06%) IT Manager
6 59 (6.94%) Security Consultant
6 59 (6.94%) Senior Manager
7 52 (6.12%) Project Controller
8 46 (5.41%) Lead
9 41 (4.82%) Cybersecurity Consultant
10 36 (4.24%) Security Manager
11 31 (3.65%) Developer
12 28 (3.29%) Architect
13 27 (3.18%) Audit Manager
13 27 (3.18%) Security Analyst
14 26 (3.06%) Digital Project Manager
15 23 (2.71%) Delivery Manager
16 22 (2.59%) Programme Manager
17 20 (2.35%) Data Manager
18 19 (2.24%) Senior IT Manager
Libraries, Frameworks & Software Standards
1 22 (2.59%) .NET
2 20 (2.35%) CSS
2 20 (2.35%) Laravel
2 20 (2.35%) Vue
3 19 (2.24%) AngularJS
4 18 (2.12%) React
5 17 (2.00%) OAuth
6 16 (1.88%) HTML
7 14 (1.65%) jQuery
7 14 (1.65%) RESTful
8 13 (1.53%) .NET Core
9 12 (1.41%) REST
9 12 (1.41%) Spring
10 11 (1.29%) ASP.NET
10 11 (1.29%) Entity Framework
11 10 (1.18%) Kafka
12 9 (1.06%) ASP.NET Core
12 9 (1.06%) Hibernate
12 9 (1.06%) Spring MVC
13 6 (0.71%) Flutter
Miscellaneous
1 145 (17.06%) Management Information System
2 37 (4.35%) Operational Technology
3 31 (3.65%) Cyber Threat
4 25 (2.94%) Algorithms
4 25 (2.94%) Data Structures
4 25 (2.94%) Security Posture
5 20 (2.35%) Credit Risk
6 15 (1.76%) CESG
6 15 (1.76%) Driving Licence
6 15 (1.76%) PMI
7 14 (1.65%) Onboarding
8 13 (1.53%) Self-Motivation
9 12 (1.41%) Client/Server
10 11 (1.29%) Data Centre
10 11 (1.29%) Freedom of Information
10 11 (1.29%) Renewable Energy
11 10 (1.18%) Cloud Native
11 10 (1.18%) Taxonomies
12 9 (1.06%) Distributed Systems
12 9 (1.06%) Reinsurance
Operating Systems
1 26 (3.06%) Windows
2 15 (1.76%) Android
2 15 (1.76%) Apple iOS
3 14 (1.65%) Linux
4 5 (0.59%) Red Hat Enterprise Linux
4 5 (0.59%) Unix
5 4 (0.47%) Windows Server
6 3 (0.35%) zOS
7 2 (0.24%) AIX
7 2 (0.24%) Windows 10
8 1 (0.12%) Mac OS X
Processes & Methodologies
1 221 (26.00%) Project Management
2 201 (23.65%) Agile
3 170 (20.00%) Cybersecurity
3 170 (20.00%) Information Security
4 152 (17.88%) Mentoring
5 142 (16.71%) Problem-Solving
6 133 (15.65%) Stakeholder Management
7 114 (13.41%) Project Delivery
8 107 (12.59%) Continuous Improvement
9 102 (12.00%) Decision-Making
10 86 (10.12%) Coaching
11 79 (9.29%) Roadmaps
12 76 (8.94%) Systems Engineering
13 74 (8.71%) Analytics
14 73 (8.59%) Performance Management
15 71 (8.35%) Computer Science
15 71 (8.35%) Programme Management
16 61 (7.18%) Incident Response
17 58 (6.82%) Change Management
17 58 (6.82%) DevOps
Programming Languages
1 59 (6.94%) Python
2 32 (3.76%) SQL
3 25 (2.94%) JavaScript
4 24 (2.82%) C#
5 20 (2.35%) Java
5 20 (2.35%) PHP
6 15 (1.76%) PowerShell
7 9 (1.06%) R
8 7 (0.82%) Go
9 6 (0.71%) Dart
9 6 (0.71%) Scala
10 4 (0.47%) Groovy
11 3 (0.35%) C++
11 3 (0.35%) JCL
11 3 (0.35%) REXX
11 3 (0.35%) Ruby
11 3 (0.35%) VB
12 2 (0.24%) Assembly Language
12 2 (0.24%) Tcl
12 2 (0.24%) VBA
Qualifications
1 221 (26.00%) Degree
2 118 (13.88%) Security Cleared
3 94 (11.06%) CISSP
4 68 (8.00%) SC Cleared
5 61 (7.18%) CISM
6 42 (4.94%) CRISC
7 35 (4.12%) Computer Science Degree
7 35 (4.12%) PMI Certification
8 33 (3.88%) Master's Degree
9 29 (3.41%) CISA
10 26 (3.06%) PMP
11 22 (2.59%) DV Cleared
12 21 (2.47%) Numerate Degree
13 16 (1.88%) CEH
14 15 (1.76%) CESG Certified Professional
15 14 (1.65%) CASP
16 11 (1.29%) CISMP
16 11 (1.29%) IISP
17 7 (0.82%) ISO 27001 Lead Auditor
17 7 (0.82%) PRINCE2 Practitioner
Quality Assurance & Compliance
1 94 (11.06%) ISO/IEC 27001
2 87 (10.24%) NIST
3 52 (6.12%) GRC
4 45 (5.29%) QA
5 43 (5.06%) NCSC
6 39 (4.59%) GDPR
6 39 (4.59%) JSP 440
7 32 (3.76%) Cyber Essentials
8 30 (3.53%) PCI DSS
9 27 (3.18%) NIST 800
10 26 (3.06%) IFRS
11 25 (2.94%) PMO
12 17 (2.00%) RMADS
13 14 (1.65%) HMG Security Policy Framework
14 11 (1.29%) COBIT
14 11 (1.29%) ISO 31000
15 10 (1.18%) Cyber Essentials PLUS
15 10 (1.18%) SLA
16 8 (0.94%) ISO 9001
16 8 (0.94%) SOC 2
System Software
1 28 (3.29%) Docker
2 23 (2.71%) Active Directory
3 6 (0.71%) VMware Infrastructure
4 4 (0.47%) Microsoft Virtual Server
4 4 (0.47%) Virtual Servers
5 3 (0.35%) Time Sharing Option
6 2 (0.24%) ACF2
6 2 (0.24%) Hyper-V
6 2 (0.24%) RACF
7 1 (0.12%) Job Entry Subsystem
7 1 (0.12%) Microcode
7 1 (0.12%) Veritas Cluster Server
7 1 (0.12%) vSphere
Systems Management
1 32 (3.76%) Kubernetes
2 14 (1.65%) SCOM
3 5 (0.59%) Ansible
3 5 (0.59%) Microsoft Intune
4 4 (0.47%) Nessus
5 3 (0.35%) Kibana
5 3 (0.35%) Puppet
6 2 (0.24%) Computer Emergency Response Teams
6 2 (0.24%) OMEGAMON
6 2 (0.24%) QRadar
6 2 (0.24%) SCCM
7 1 (0.12%) McAfee ePO
7 1 (0.12%) NetBackup
7 1 (0.12%) OfficeScan
7 1 (0.12%) PingFederate
7 1 (0.12%) Terraform
7 1 (0.12%) Trend Micro Deep Security
Vendors
1 156 (18.35%) Microsoft
2 20 (2.35%) Workday
3 18 (2.12%) IFS
4 17 (2.00%) SAP
5 16 (1.88%) Google
5 16 (1.88%) Oracle
6 10 (1.18%) Qualys
7 9 (1.06%) CrowdStrike
7 9 (1.06%) ServiceNow
8 6 (0.71%) Ariba
8 6 (0.71%) Splunk
8 6 (0.71%) Teradata
8 6 (0.71%) VMware
9 5 (0.59%) IBM
9 5 (0.59%) Salesforce
10 4 (0.47%) Databricks
11 3 (0.35%) Cadence
11 3 (0.35%) Facebook
11 3 (0.35%) McAfee
11 3 (0.35%) OneTrust