Hybrid/Remote Accessibility Job Trends

Accessibility (a11y)
UK > Work from Home

The table below provides summary statistics and salary benchmarking for remote or hybrid work requiring Accessibility skills. It covers permanent job vacancies from the 6 months leading up to 26 November 2025, with comparisons to the same periods in the previous two years.

6 months to
26 Nov 2025
Same period 2024 Same period 2023
Rank 112 123 275
Rank change year-on-year +11 +152 -37
Permanent jobs citing Accessibility 371 511 230
As % of all permanent jobs with remote/hybrid work options 2.43% 2.57% 1.09%
As % of the Quality Assurance & Compliance category 13.97% 16.58% 7.18%
Number of salaries quoted 202 141 184
10th Percentile £42,500 £40,000 £40,449
25th Percentile £48,563 £50,000 £45,341
Median annual salary (50th Percentile) £57,500 £58,465 £55,000
Median % change year-on-year -1.65% +6.30% -6.82%
75th Percentile £77,500 £68,750 £77,500
90th Percentile £87,500 £77,500 £85,000
UK median annual salary £60,000 £55,000 £55,000
% change year-on-year +9.09% - -8.33%

All Quality Assurance and Compliance Skills
Work from Home

Accessibility falls under the Quality Assurance and Compliance category. For comparison with the information above, the following table provides summary statistics for all permanent job vacancies with remote or hybrid options requiring quality assurance or compliance skills.

Permanent vacancies with a requirement for quality assurance or compliance skills 2,655 3,082 3,205
As % of all permanent jobs with a WFH option 17.41% 15.51% 15.24%
Number of salaries quoted 1,647 1,686 2,544
10th Percentile £34,891 £35,000 £37,000
25th Percentile £47,500 £46,250 £47,500
Median annual salary (50th Percentile) £62,500 £62,500 £60,249
Median % change year-on-year - +3.74% +4.78%
75th Percentile £80,000 £78,750 £79,000
90th Percentile £97,500 £97,500 £95,000
UK median annual salary £57,500 £60,000 £60,000
% change year-on-year -4.17% - +4.35%

Accessibility
Job Vacancy Trend for Remote/Hybrid Jobs

Historical trend showing the proportion of permanent IT job postings citing Accessibility and offering remote or hybrid work options relative to all permanent IT jobs advertised.
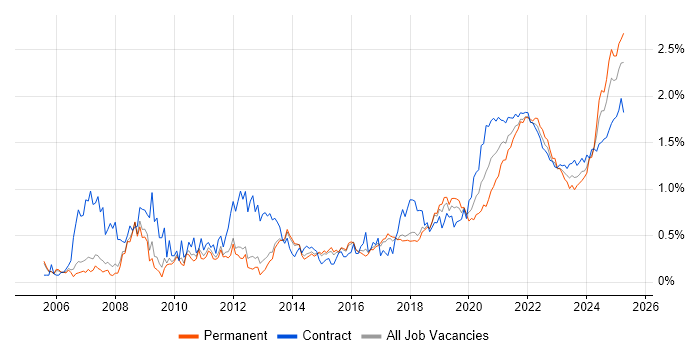
Accessibility job vacancy trend for remote/hybrid jobs

Accessibility
Salary Trend for Remote/Hybrid Jobs

Salary distribution trend for jobs with remote/hybrid work options citing Accessibility.

Salary distribution trend for jobs with remote/hybrid work options citing Accessibility

Accessibility
Salary Histogram for Remote/Hybrid Jobs

Salary distribution for jobs with remote/hybrid work options citing Accessibility over the 6 months to 26 November 2025.

Accessibility salary histogram for jobs with remote/hybrid work options

Accessibility
Co-Occurring Skills & Capabilities in Remote/Hybrid Jobs by Category

The following tables expand on the one above by listing co-occurrences grouped by category. They cover the same employment type, locality and period, with up to 20 co-occurrences shown in each category:

Application Platforms
1 33 (8.89%) CMS
2 22 (5.93%) Confluence
3 9 (2.43%) Drupal
4 8 (2.16%) Headless CMS
5 6 (1.62%) Umbraco
5 6 (1.62%) WordPress
6 3 (0.81%) SharePoint
7 2 (0.54%) EPiServer
7 2 (0.54%) Microsoft Exchange
8 1 (0.27%) Apache
8 1 (0.27%) Apache Airflow
Applications
1 37 (9.97%) Adobe XD
2 11 (2.96%) Microsoft Excel
3 10 (2.70%) Microsoft Office
4 7 (1.89%) Sketch
5 5 (1.35%) Chatbot
6 4 (1.08%) AutoCAD
6 4 (1.08%) Civil 3D
7 3 (0.81%) Adobe Creative Suite
7 3 (0.81%) Photoshop
8 1 (0.27%) CapCut
8 1 (0.27%) FrameMaker
8 1 (0.27%) InVision
8 1 (0.27%) MadCap Flare
8 1 (0.27%) Microsoft PowerPoint
8 1 (0.27%) Microsoft Project
8 1 (0.27%) MS Visio
8 1 (0.27%) Notion
Business Applications
1 10 (2.70%) Shopify
2 5 (1.35%) Dynamics GP
3 1 (0.27%) Integrated Workplace Management System
3 1 (0.27%) NetSuite
3 1 (0.27%) Payment Gateway
3 1 (0.27%) Raiser’s Edge
Cloud Services
1 95 (25.61%) Azure
2 60 (16.17%) Figma
3 49 (13.21%) Snowflake
4 37 (9.97%) Power Platform
5 30 (8.09%) Google Analytics
6 27 (7.28%) AWS
7 24 (6.47%) Azure DevOps
8 21 (5.66%) Miro
8 21 (5.66%) SaaS
9 19 (5.12%) Serverless
10 16 (4.31%) Microsoft 365
11 15 (4.04%) Dynamics 365
12 12 (3.23%) Vercel
13 11 (2.96%) GitHub
14 10 (2.70%) PowerApps
15 9 (2.43%) Amazon S3
15 9 (2.43%) AWS Lambda
16 8 (2.16%) Amazon ECS
16 8 (2.16%) Amazon SQS
16 8 (2.16%) GCP
Communications & Networking
1 2 (0.54%) Intranet
Database & Business Intelligence
1 51 (13.75%) Data Warehouse
2 24 (6.47%) Power BI
3 14 (3.77%) NoSQL
4 12 (3.23%) SQL Server
5 10 (2.70%) Tableau
6 7 (1.89%) MySQL
7 6 (1.62%) Metadata
8 5 (1.35%) PostgreSQL
9 4 (1.08%) BigQuery
10 3 (0.81%) Azure SQL Database
11 2 (0.54%) Amazon RDS
12 1 (0.27%) Amazon Athena
12 1 (0.27%) EDMS
12 1 (0.27%) GIS
12 1 (0.27%) Looker
12 1 (0.27%) MongoDB
12 1 (0.27%) SAP BW
Development Applications
1 27 (7.28%) Git
1 27 (7.28%) JIRA
2 24 (6.47%) Axure RP
3 23 (6.20%) Balsamiq
4 22 (5.93%) Cypress.io
5 17 (4.58%) webpack
6 16 (4.31%) Selenium
7 11 (2.96%) Babel
8 8 (2.16%) Storybook
9 7 (1.89%) WebDriver
10 5 (1.35%) Vite
11 3 (0.81%) Jenkins
11 3 (0.81%) JMeter
11 3 (0.81%) Postman
11 3 (0.81%) Visual Studio
11 3 (0.81%) Visual Studio Code
12 2 (0.54%) Grunt
12 2 (0.54%) gulp
12 2 (0.54%) TeamCity
13 1 (0.27%) Sourcetree
General
1 118 (31.81%) Social Skills
2 91 (24.53%) Finance
3 57 (15.36%) Inclusion and Diversity
4 55 (14.82%) Public Sector
5 48 (12.94%) Marketing
6 42 (11.32%) Analytical Skills
7 40 (10.78%) Law
8 26 (7.01%) Legal
9 14 (3.77%) Local Government
9 14 (3.77%) Retail
10 11 (2.96%) Organisational Skills
11 8 (2.16%) Games
12 7 (1.89%) Digital Health
12 7 (1.89%) Multimedia
12 7 (1.89%) Tech for Good
13 5 (1.35%) Front Office
14 3 (0.81%) Manufacturing
14 3 (0.81%) Military
14 3 (0.81%) Police
14 3 (0.81%) Telecoms
Job Titles
1 79 (21.29%) Developer
2 69 (18.60%) Senior
3 39 (10.51%) Designer
4 38 (10.24%) Lead
5 34 (9.16%) Architect
5 34 (9.16%) Data Architect
6 28 (7.55%) Analyst
7 27 (7.28%) Senior Developer
8 25 (6.74%) Front-End Developer (Client-Side Developer)
9 18 (4.85%) Senior Manager
10 17 (4.58%) Full-Stack Developer
11 16 (4.31%) Service Designer
12 15 (4.04%) Front-End Engineer (Client-Side Engineer)
12 15 (4.04%) UX Designer
13 12 (3.23%) Business Analyst
13 12 (3.23%) Finance Manager
13 12 (3.23%) Senior Full-Stack Developer
13 12 (3.23%) Software Developer
14 11 (2.96%) Development Engineer
14 11 (2.96%) Infrastructure Engineer
Libraries, Frameworks & Software Standards
1 74 (19.95%) HTML
2 71 (19.14%) CSS
3 63 (16.98%) React
4 27 (7.28%) Next.js
5 24 (6.47%) GraphQL
6 23 (6.20%) RESTful
7 21 (5.66%) Node.js
8 18 (4.85%) .NET
9 16 (4.31%) CSS3
9 16 (4.31%) HTML5
10 15 (4.04%) Jest
10 15 (4.04%) Playwright
11 13 (3.50%) Sass
12 12 (3.23%) Tailwind CSS
13 10 (2.70%) Redux
13 10 (2.70%) Vue
14 8 (2.16%) Express.js
14 8 (2.16%) JSON
14 8 (2.16%) Vitest
15 7 (1.89%) gRPC
Miscellaneous
1 35 (9.43%) Product Ownership
2 28 (7.55%) Management Information System
3 25 (6.74%) Onboarding
4 15 (4.04%) NHS
5 13 (3.50%) Life Science
6 12 (3.23%) e-Learning
7 11 (2.96%) Analytical Mindset
8 10 (2.70%) Learning Management System
8 10 (2.70%) Mobile App
8 10 (2.70%) Social Media
9 9 (2.43%) Cloud Native
10 7 (1.89%) AI Agents
10 7 (1.89%) Self-Motivation
10 7 (1.89%) Team-Oriented Environment
11 6 (1.62%) Blog
11 6 (1.62%) Data Centre
12 5 (1.35%) Educational Technology
12 5 (1.35%) Low-Code
13 4 (1.08%) Graphic Design
14 3 (0.81%) SCORM
Operating Systems
1 2 (0.54%) Android
1 2 (0.54%) Apple iOS
Processes & Methodologies
1 149 (40.16%) Agile
2 138 (37.20%) User Experience
3 97 (26.15%) Analytics
4 82 (22.10%) Continuous Improvement
5 74 (19.95%) Problem-Solving
6 64 (17.25%) Mentoring
7 56 (15.09%) UX Design
8 53 (14.29%) User-Centered Design (UCD)
9 52 (14.02%) E-Commerce
10 51 (13.75%) CI/CD
11 48 (12.94%) AI
11 48 (12.94%) Coaching
12 47 (12.67%) Data Management
13 45 (12.13%) Front End Development
14 43 (11.59%) Data Engineering
15 42 (11.32%) SEO
16 41 (11.05%) Data Modelling
16 41 (11.05%) User Research
17 39 (10.51%) Data Architecture
17 39 (10.51%) Prototyping
Programming Languages
1 74 (19.95%) JavaScript
2 50 (13.48%) SQL
2 50 (13.48%) TypeScript
3 23 (6.20%) Python
4 18 (4.85%) C#
5 17 (4.58%) Java
6 7 (1.89%) PowerShell
7 5 (1.35%) PHP
8 2 (0.54%) Go
8 2 (0.54%) T-SQL
8 2 (0.54%) XAML
9 1 (0.27%) PL/SQL
9 1 (0.27%) R
Qualifications
1 80 (21.56%) Degree
2 48 (12.94%) Security Cleared
3 46 (12.40%) SC Cleared
4 23 (6.20%) ACCA
5 17 (4.58%) Computer Science Degree
6 13 (3.50%) CIMA
7 9 (2.43%) DBS Check
8 8 (2.16%) Postgraduate
9 3 (0.81%) CIPD
9 3 (0.81%) DV Cleared
10 1 (0.27%) AWS Certification
10 1 (0.27%) AWS Certified Developer
10 1 (0.27%) AWS Certified Solutions Architect
10 1 (0.27%) Chartered Engineer
10 1 (0.27%) CISSP
10 1 (0.27%) CRISC
10 1 (0.27%) ISTQB
10 1 (0.27%) ISTQB Advanced Certification
10 1 (0.27%) Master's Degree
10 1 (0.27%) PMP
Quality Assurance & Compliance
1 59 (15.90%) WCAG
2 34 (9.16%) QA
3 12 (3.23%) GDPR
4 10 (2.70%) GAAP
5 9 (2.43%) Data Quality
6 1 (0.27%) IFRS
6 1 (0.27%) ISO 19650
6 1 (0.27%) PERC
6 1 (0.27%) PMO
6 1 (0.27%) Section 508
6 1 (0.27%) SLA
System Software
1 5 (1.35%) Docker
Systems Management
1 10 (2.70%) Terraform
2 1 (0.27%) AppManager
2 1 (0.27%) BMC PATROL
2 1 (0.27%) Microsoft Intune
2 1 (0.27%) Single Sign-On
Vendors
1 93 (25.07%) Microsoft
2 46 (12.40%) Adobe
3 33 (8.89%) Google
4 10 (2.70%) Apple
5 5 (1.35%) Salesforce
6 4 (1.08%) Oracle
7 3 (0.81%) Dynatrace
8 2 (0.54%) Ahrefs
8 2 (0.54%) Databricks
8 2 (0.54%) Hotjar
8 2 (0.54%) HubSpot
8 2 (0.54%) Screaming Frog
9 1 (0.27%) dotdigital
9 1 (0.27%) Freshdesk
9 1 (0.27%) Hootsuite
9 1 (0.27%) Instagram
9 1 (0.27%) Optimizely
9 1 (0.27%) Planon
9 1 (0.27%) Spotify
9 1 (0.27%) TikTok