CI/CD Jobs with Work from Home Options

CI/CD
UK > Work from Home

The table below provides summary statistics for permanent remote or hybrid work requiring CI/CD skills. It includes a benchmarking guide to the annual salaries offered in vacancies that cited CI/CD over the 6 months leading up to 26 July 2024, comparing them to the same period in the previous two years.

6 months to
26 Jul 2024
Same period 2023 Same period 2022
Rank 41 21 19
Rank change year-on-year -20 -2 -2
Permanent jobs citing CI/CD 1,504 3,299 10,367
As % of all permanent jobs with a WFH option 5.38% 10.05% 13.20%
As % of the Processes & Methodologies category 6.08% 10.48% 13.59%
Number of salaries quoted 1,186 2,528 4,723
10th Percentile £44,869 £47,500 £46,250
25th Percentile £53,750 £57,500 £55,000
Median annual salary (50th Percentile) £67,500 £75,000 £70,000
Median % change year-on-year -10.00% +7.14% +5.26%
75th Percentile £84,919 £90,000 £87,500
90th Percentile £96,250 £105,000 £100,000
UK median annual salary £70,000 £75,000 £72,500
% change year-on-year -6.67% +3.45% +7.41%

All Process and Methodology Skills
Work from Home

CI/CD falls under the Processes and Methodologies category. For comparison with the information above, the following table provides summary statistics for all permanent job vacancies with remote or hybrid options requiring process or methodology skills.

Permanent vacancies with a requirement for process or methodology skills 24,720 31,469 76,283
As % of all permanent jobs with a WFH option 88.48% 95.89% 97.14%
Number of salaries quoted 17,624 23,346 43,834
10th Percentile £35,000 £37,500 £36,250
25th Percentile £42,500 £47,500 £46,250
Median annual salary (50th Percentile) £57,965 £62,500 £60,000
Median % change year-on-year -7.26% +4.17% +9.09%
75th Percentile £77,500 £81,250 £80,000
90th Percentile £96,250 £100,000 £95,000
UK median annual salary £55,000 £60,000 £60,000
% change year-on-year -8.33% - +9.09%

CI/CD
Trend for Jobs with a WFH Option

Job vacancies with a work from home option citing CI/CD as a proportion of all IT jobs advertised.
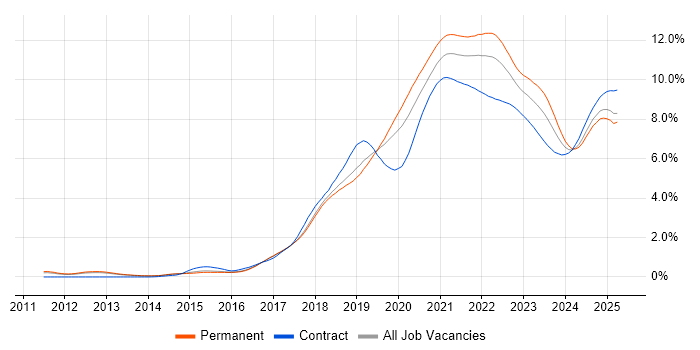
CI/CD trend for jobs with a WFH option

CI/CD
Salary Trend for Jobs with a WFH Option

3-month moving average salary quoted in job vacancies with a work from home option citing CI/CD.

CI/CD salary trend for jobs with a WFH option

CI/CD
Salary Histogram for Jobs with a WFH Option

Salary distribution for jobs with a work from home option citing CI/CD over the 6 months to 26 July 2024.

CI/CD salary histogram for jobs with a WFH option

CI/CD
Co-occurring Skills and Capabilities with WFH Options by Category

The follow tables expand on the table above by listing co-occurrences grouped by category. The same employment type, locality and period is covered with up to 20 co-occurrences shown in each of the following categories:

Application Platforms
1 37 (2.46%) Apache
2 35 (2.33%) Apache Spark
3 34 (2.26%) SharePoint
4 25 (1.66%) Confluence
5 23 (1.53%) nginx
6 20 (1.33%) Apache Airflow
7 19 (1.26%) IIS
8 17 (1.13%) Microsoft Exchange
8 17 (1.13%) OpenStack
9 12 (0.80%) Umbraco
10 10 (0.66%) CMS
11 3 (0.20%) Moodle
11 3 (0.20%) Oracle Workflow
11 3 (0.20%) SAS
11 3 (0.20%) Tomcat
12 2 (0.13%) Sitecore CMS
12 2 (0.13%) WordPress
13 1 (0.066%) BizTalk Server
13 1 (0.066%) JBoss
13 1 (0.066%) Luigi
Applications
1 13 (0.86%) Microsoft Office
2 3 (0.20%) S-PLUS
3 2 (0.13%) Notion
4 1 (0.066%) Blender
4 1 (0.066%) Microsoft Excel
Business Applications
1 31 (2.06%) Dynamics CRM
2 12 (0.80%) Remedy ITSM
3 3 (0.20%) SAP S/4HANA
4 2 (0.13%) Oracle Applications
4 2 (0.13%) Salesforce CRM
5 1 (0.066%) Dynamics NAV
Cloud Services
1 802 (53.32%) Azure
2 688 (45.74%) AWS
3 342 (22.74%) Azure DevOps
4 171 (11.37%) Serverless
5 136 (9.04%) SaaS
6 121 (8.05%) GCP
7 113 (7.51%) GitHub
8 104 (6.91%) Power Platform
9 90 (5.98%) AWS Lambda
10 67 (4.45%) Dynamics 365
11 63 (4.19%) AWS CloudFormation
12 61 (4.06%) Azure Data Factory
13 60 (3.99%) Entra ID
14 59 (3.92%) Amazon S3
15 56 (3.72%) GitHub Actions
16 54 (3.59%) Azure Storage
17 52 (3.46%) Microsoft 365
18 50 (3.32%) Amazon EKS
19 44 (2.93%) Azure Logic Apps
20 43 (2.86%) Azure Monitor
Communications & Networking
1 61 (4.06%) Firewall
2 37 (2.46%) DNS
3 32 (2.13%) WAN
4 25 (1.66%) SD-WAN
5 22 (1.46%) DHCP
6 16 (1.06%) VPN
7 10 (0.66%) HTTP
8 9 (0.60%) Network Security
8 9 (0.60%) TCP/IP
9 7 (0.47%) Internet
9 7 (0.47%) LAN
10 5 (0.33%) AMQP
10 5 (0.33%) MQTT
10 5 (0.33%) Reverse Proxy
11 4 (0.27%) SSL
12 3 (0.20%) BGP
12 3 (0.20%) HTTPS
12 3 (0.20%) VLAN
12 3 (0.20%) WLAN
13 2 (0.13%) Broadband
Database & Business Intelligence
1 140 (9.31%) SQL Server
2 101 (6.72%) PostgreSQL
3 91 (6.05%) NoSQL
4 71 (4.72%) Amazon RDS
5 68 (4.52%) DynamoDB
6 65 (4.32%) Power BI
7 62 (4.12%) MySQL
8 56 (3.72%) Relational Database
9 48 (3.19%) Data Warehouse
10 47 (3.13%) Azure SQL Database
11 40 (2.66%) MongoDB
12 31 (2.06%) Data Lake
13 24 (1.60%) Big Data
14 23 (1.53%) Redis
15 18 (1.20%) BigQuery
15 18 (1.20%) SQL Server Integration Services
16 16 (1.06%) Elasticsearch
17 13 (0.86%) MariaDB
17 13 (0.86%) Metadata
17 13 (0.86%) SQL Server Reporting Services
Development Applications
1 254 (16.89%) Git
2 184 (12.23%) Jenkins
3 136 (9.04%) GitLab
4 106 (7.05%) JIRA
5 53 (3.52%) Selenium
6 51 (3.39%) TeamCity
7 43 (2.86%) Postman
8 39 (2.59%) Cucumber
9 33 (2.19%) Visual Studio
10 28 (1.86%) JUnit
11 25 (1.66%) Bitbucket
12 23 (1.53%) Team Foundation Server
13 21 (1.40%) Octopus Deploy
14 16 (1.06%) JMeter
15 15 (1.00%) Cypress.io
16 13 (0.86%) TestNG
17 12 (0.80%) CircleCI
17 12 (0.80%) REST Assured
17 12 (0.80%) SpecFlow
18 11 (0.73%) SonarQube
General
1 358 (23.80%) Social Skills
2 253 (16.82%) Finance
3 101 (6.72%) Analytical Skills
4 96 (6.38%) Retail
5 92 (6.12%) Inclusion and Diversity
6 65 (4.32%) Public Sector
7 63 (4.19%) Banking
8 54 (3.59%) Law
9 48 (3.19%) Aerospace
10 25 (1.66%) Marketing
11 24 (1.60%) Legal
12 22 (1.46%) Health Technology
13 20 (1.33%) Back Office
13 20 (1.33%) Manufacturing
14 16 (1.06%) Games
15 15 (1.00%) Influencing Skills
16 14 (0.93%) Automotive
16 14 (0.93%) Front Office
16 14 (0.93%) Tech for Good
16 14 (0.93%) Telecoms
Job Titles
1 449 (29.85%) Developer
2 368 (24.47%) Senior
3 224 (14.89%) DevOps Engineer
4 195 (12.97%) Lead
5 176 (11.70%) Software Engineer
6 158 (10.51%) Senior Developer
7 112 (7.45%) Architect
8 98 (6.52%) Azure Engineer
8 98 (6.52%) Full Stack Developer
9 97 (6.45%) Cloud Engineer
10 96 (6.38%) .NET Developer
11 95 (6.32%) Data Engineer
12 83 (5.52%) AWS Engineer
13 73 (4.85%) C# Developer
14 66 (4.39%) Software Developer
15 55 (3.66%) Senior Software Engineer
16 45 (2.99%) AWS DevOps
16 45 (2.99%) AWS DevOps Engineer
17 43 (2.86%) Infrastructure Engineer
18 42 (2.79%) Azure Developer
Libraries, Frameworks & Software Standards
1 313 (20.81%) .NET
2 215 (14.30%) React
3 146 (9.71%) Node.js
4 124 (8.24%) REST
5 106 (7.05%) AngularJS
6 104 (6.91%) RESTful
7 100 (6.65%) .NET Framework
8 95 (6.32%) Web Services
9 92 (6.12%) GraphQL
10 87 (5.78%) CSS
11 83 (5.52%) HTML
12 82 (5.45%) Django
13 77 (5.12%) Kafka
14 71 (4.72%) .NET Core
15 63 (4.19%) ARM Templates
16 61 (4.06%) RabbitMQ
17 50 (3.32%) ASP.NET
18 43 (2.86%) gRPC
18 43 (2.86%) Spring
19 42 (2.79%) Vue
Miscellaneous
1 96 (6.38%) Cloud Native
2 63 (4.19%) Product Ownership
3 49 (3.26%) Greenfield Project
4 39 (2.59%) Management Information System
5 35 (2.33%) Self-Motivation
6 33 (2.19%) Data Centre
7 31 (2.06%) Onboarding
8 30 (1.99%) Distributed Systems
8 30 (1.99%) Public Cloud
9 28 (1.86%) Blog
9 28 (1.86%) IoT
10 27 (1.80%) Distributed Denial-of-Service
10 27 (1.80%) Enterprise Software
10 27 (1.80%) Linux Command Line
10 27 (1.80%) Mobile App
11 26 (1.73%) Data Structures
12 23 (1.53%) Algorithms
13 19 (1.26%) Private Cloud
14 18 (1.20%) FMCG
15 16 (1.06%) PKI
Operating Systems
1 233 (15.49%) Linux
2 136 (9.04%) Windows
3 42 (2.79%) Windows Server
4 21 (1.40%) Unix
5 18 (1.20%) Android
6 17 (1.13%) Red Hat Enterprise Linux
6 17 (1.13%) Windows Server 2016
7 16 (1.06%) Apple iOS
7 16 (1.06%) Windows Server 2019
8 11 (0.73%) VMS
9 10 (0.66%) Oracle Linux
9 10 (0.66%) Solaris
10 5 (0.33%) CentOS
11 3 (0.20%) Amazon Linux
11 3 (0.20%) Windows Server 2008
12 2 (0.13%) Embedded Linux
13 1 (0.066%) Robot Operating System
13 1 (0.066%) Ubuntu
13 1 (0.066%) Windows 10
13 1 (0.066%) Windows Server 2012
Processes & Methodologies
1 895 (59.51%) DevOps
2 707 (47.01%) Agile
3 402 (26.73%) Software Engineering
4 307 (20.41%) Infrastructure as Code
5 278 (18.48%) Problem-Solving
6 275 (18.28%) Continuous Integration
7 256 (17.02%) TDD
8 237 (15.76%) Microservices
9 232 (15.43%) Full Stack Development
10 218 (14.49%) Scrum
11 196 (13.03%) Test Automation
12 185 (12.30%) Containerisation
13 168 (11.17%) Mentoring
14 167 (11.10%) Analytics
15 162 (10.77%) Continuous Deployment
15 162 (10.77%) SDLC
16 140 (9.31%) Continuous Improvement
17 135 (8.98%) Continuous Delivery
18 122 (8.11%) Roadmaps
19 112 (7.45%) Computer Science
Programming Languages
1 407 (27.06%) Python
2 363 (24.14%) C#
3 307 (20.41%) SQL
4 246 (16.36%) Java
5 237 (15.76%) JavaScript
6 155 (10.31%) PowerShell
7 141 (9.38%) TypeScript
8 102 (6.78%) Bash
9 82 (5.45%) Go
10 56 (3.72%) Bicep
11 37 (2.46%) PHP
12 28 (1.86%) C++
13 25 (1.66%) Shell Script
14 19 (1.26%) Ruby
14 19 (1.26%) Scala
15 17 (1.13%) Kusto Query Language
15 17 (1.13%) VB
15 17 (1.13%) VBScript
16 16 (1.06%) C
16 16 (1.06%) Groovy
Qualifications
1 244 (16.22%) Security Cleared
2 168 (11.17%) Degree
3 148 (9.84%) SC Cleared
4 87 (5.78%) Computer Science Degree
5 84 (5.59%) Azure Certification
6 71 (4.72%) DV Cleared
7 65 (4.32%) AWS Certification
8 52 (3.46%) DBS Check
9 27 (1.80%) CISSP
10 26 (1.73%) ITIL Foundation Certificate
11 25 (1.66%) Cisco Certification
11 25 (1.66%) CISM
12 24 (1.60%) (ISC)2 CCSP
12 24 (1.60%) CCSK
12 24 (1.60%) CCSP
13 21 (1.40%) Master's Degree
14 20 (1.33%) BPSS Clearance
15 14 (0.93%) Microsoft Certification
16 13 (0.86%) AWS Certified DevOps Engineer
17 11 (0.73%) ISTQB
Quality Assurance & Compliance
1 129 (8.58%) QA
2 49 (3.26%) Accessibility
3 42 (2.79%) Data Quality
4 30 (1.99%) NIST
5 15 (1.00%) ISO/IEC 27001
6 13 (0.86%) GDPR
7 10 (0.66%) SOC 2
8 7 (0.47%) HIPAA
8 7 (0.47%) PCI DSS
8 7 (0.47%) WCAG
9 6 (0.40%) NCSC
10 4 (0.27%) EMIR
10 4 (0.27%) ISO 9001
10 4 (0.27%) MiFID
10 4 (0.27%) SLA
11 3 (0.20%) Cyber Essentials
12 2 (0.13%) California Consumer Privacy Act
12 2 (0.13%) PSD2
13 1 (0.066%) Government Security Classifications
13 1 (0.066%) Software Quality Assurance
System Software
1 446 (29.65%) Docker
2 61 (4.06%) Active Directory
3 48 (3.19%) Virtual Machines
4 36 (2.39%) Virtual Desktop
5 7 (0.47%) Hyper-V
6 5 (0.33%) VMware Infrastructure
7 4 (0.27%) Firmware
7 4 (0.27%) VMware ESXi
8 2 (0.13%) Embedded Firmware
8 2 (0.13%) vSphere
9 1 (0.066%) Ceph
9 1 (0.066%) KVM
9 1 (0.066%) Virtual Servers
Systems Management
1 437 (29.06%) Kubernetes
2 401 (26.66%) Terraform
3 160 (10.64%) Ansible
4 46 (3.06%) Grafana
5 34 (2.26%) Single Sign-On
6 29 (1.93%) Puppet
7 26 (1.73%) Docker Swarm
8 20 (1.33%) Microsoft Intune
8 20 (1.33%) Progress Chef
8 20 (1.33%) Prometheus
9 19 (1.26%) SCCM
10 17 (1.13%) Active Directory Federation Services
11 16 (1.06%) SCOM
11 16 (1.06%) WSUS
12 10 (0.66%) ZABBIX
13 9 (0.60%) Consul
13 9 (0.60%) Istio
13 9 (0.60%) Kibana
14 7 (0.47%) Packer
15 6 (0.40%) Argo
Vendors
1 286 (19.02%) Microsoft
2 70 (4.65%) Databricks
3 44 (2.93%) Google
4 42 (2.79%) Oracle
5 17 (1.13%) Salesforce
6 16 (1.06%) Splunk
7 15 (1.00%) BT
8 14 (0.93%) Remedy
9 13 (0.86%) ServiceNow
10 12 (0.80%) BMC
11 10 (0.66%) Red Hat
11 10 (0.66%) SAP
11 10 (0.66%) Serena
11 10 (0.66%) VMware
12 8 (0.53%) Atlassian
12 8 (0.53%) Informatica
12 8 (0.53%) Xamarin
13 7 (0.47%) Apple
14 6 (0.40%) Dynatrace
14 6 (0.40%) Facebook