Hybrid/Remote Inclusion and Diversity Job Trends

Inclusion and Diversity
UK > Work from Home

The table below looks at the prevalence of the term Inclusion and Diversity in remote or hybrid work. Included is a benchmarking guide to the salaries offered in vacancies that cited Inclusion and Diversity over the 6 months leading up to 16 September 2025, comparing them to the same period in the previous two years.

6 months to
16 Sep 2025
Same period 2024 Same period 2023
Rank 14 29 39
Rank change year-on-year +15 +10 +12
Permanent jobs citing Inclusion and Diversity 1,906 1,583 1,676
As % of all permanent jobs with a WFH option 11.77% 6.80% 6.68%
As % of the General category 16.39% 10.88% 10.25%
Number of salaries quoted 411 715 984
10th Percentile £25,600 £36,250 £36,095
25th Percentile £35,106 £45,000 £47,452
Median annual salary (50th Percentile) £52,500 £58,800 £65,000
Median % change year-on-year -10.71% -9.54% +8.33%
75th Percentile £71,875 £72,250 £81,250
90th Percentile £82,500 £86,250 £100,000
UK median annual salary £55,000 £58,310 £65,000
% change year-on-year -5.68% -10.29% +8.33%

All General Skills
Work from Home

Inclusion and Diversity falls under the General Skills category. For comparison with the information above, the following table provides summary statistics for all permanent job vacancies with remote or hybrid options requiring common skills.

Permanent vacancies with a requirement for common skills 11,630 14,556 16,353
As % of all permanent jobs with a WFH option 71.82% 62.55% 65.18%
Number of salaries quoted 6,320 8,408 13,080
10th Percentile £28,750 £35,000 £37,000
25th Percentile £39,365 £45,000 £46,570
Median annual salary (50th Percentile) £57,500 £60,000 £62,500
Median % change year-on-year -4.17% -4.00% +4.17%
75th Percentile £80,000 £82,813 £82,500
90th Percentile £105,000 £110,000 £101,250
UK median annual salary £54,000 £55,213 £60,000
% change year-on-year -2.20% -7.98% -

Inclusion and Diversity
Trend for Jobs with a WFH Option

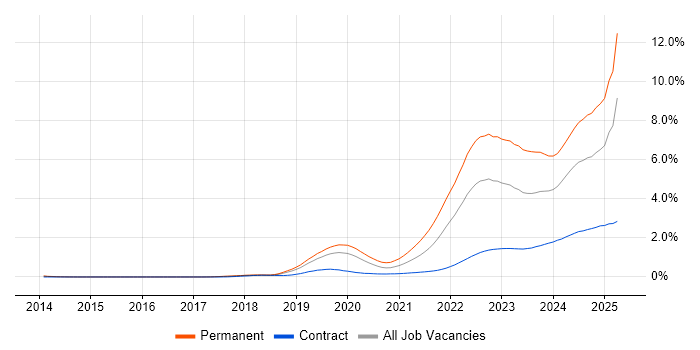
Job vacancies with remote working options citing Inclusion and Diversity as a proportion of all IT jobs advertised.

Inclusion and Diversity trend for jobs with Hybrid/Remote/WFH options

Inclusion and Diversity
Salary Trend for Jobs with Hybrid Work Options

Salary distribution trend for jobs with remote work options citing Inclusion and Diversity.

Salary distribution trend for jobs with remote work options citing Inclusion and Diversity

Inclusion and Diversity
Salary Histogram for Jobs with a WFH Option

Salary distribution for jobs with remote working options citing Inclusion and Diversity over the 6 months to 16 September 2025.

Inclusion and Diversity salary histogram for jobs with a WFH option

Inclusion and Diversity
Co-occurring Skills and Capabilities with WFH Options by Category

The follow tables expand on the table above by listing co-occurrences grouped by category. The same employment type, locality and period is covered with up to 20 co-occurrences shown in each of the following categories:

Application Platforms
1 163 (8.55%) Confluence
2 29 (1.52%) SharePoint
3 18 (0.94%) Skype for Business
4 13 (0.68%) CMS
5 11 (0.58%) Microsoft Exchange
6 5 (0.26%) Apache Spark
7 4 (0.21%) Apache
8 3 (0.16%) IIS
8 3 (0.16%) SAS
8 3 (0.16%) WordPress
9 2 (0.10%) Drupal
9 2 (0.10%) HCL Notes
9 2 (0.10%) Umbraco
10 1 (0.052%) Alfresco
10 1 (0.052%) EPiServer
10 1 (0.052%) Headless CMS
10 1 (0.052%) Mendix
10 1 (0.052%) Moodle
10 1 (0.052%) nginx
10 1 (0.052%) Oracle SOA Suite
Applications
1 44 (2.31%) Microsoft Office
2 37 (1.94%) Microsoft Excel
3 14 (0.73%) Adobe XD
4 12 (0.63%) Adobe Premiere
5 9 (0.47%) Photoshop
6 7 (0.37%) Adobe After Effects
6 7 (0.37%) Maya
6 7 (0.37%) Microsoft PowerPoint
6 7 (0.37%) Microsoft Project
6 7 (0.37%) Spreadsheet
7 6 (0.31%) Adobe Creative Suite
8 5 (0.26%) AutoCAD
8 5 (0.26%) MS Visio
9 4 (0.21%) Blender
9 4 (0.21%) MotionBuilder
10 3 (0.16%) 3ds Max
10 3 (0.16%) ZBrush
11 2 (0.10%) Adobe Captivate
11 2 (0.10%) Adobe Illustrator
11 2 (0.10%) InDesign
Business Applications
1 12 (0.63%) Salesforce CRM
2 4 (0.21%) SAP S/4HANA
3 3 (0.16%) Sparx Enterprise Architect
4 2 (0.10%) Dynamics CRM
4 2 (0.10%) Oracle General Ledger
4 2 (0.10%) Oracle Payables
4 2 (0.10%) Oracle Receivables
4 2 (0.10%) SAP PS
5 1 (0.052%) Aladdin
5 1 (0.052%) Elite 3E
5 1 (0.052%) Magento
5 1 (0.052%) Oracle EBS
5 1 (0.052%) Payment Gateway
5 1 (0.052%) Primavera
5 1 (0.052%) Raiser’s Edge
5 1 (0.052%) SAP BPC
Cloud Services
1 579 (30.38%) Azure
2 542 (28.44%) AWS
3 343 (18.00%) GCP
4 72 (3.78%) Microsoft 365
5 67 (3.52%) Power Platform
6 51 (2.68%) AWS CloudFormation
7 50 (2.62%) Amazon EKS
8 32 (1.68%) Dynamics 365
9 29 (1.52%) Power Automate
10 25 (1.31%) Azure DevOps
11 20 (1.05%) SaaS
12 18 (0.94%) Figma
12 18 (0.94%) Google Analytics
13 12 (0.63%) Zapier
14 11 (0.58%) PowerApps
15 10 (0.52%) Entra ID
15 10 (0.52%) Miro
16 9 (0.47%) Azure Data Factory
17 8 (0.42%) Google Sheets
18 7 (0.37%) PaaS
Communications & Networking
1 269 (14.11%) VPN
2 262 (13.75%) Cisco IOS
3 21 (1.10%) Wireless
4 19 (1.00%) WAN
5 18 (0.94%) Skype
5 18 (0.94%) Unified Communications
6 17 (0.89%) LAN
6 17 (0.89%) Network Security
7 8 (0.42%) DNS
7 8 (0.42%) Wi-Fi
8 7 (0.37%) Broadband
8 7 (0.37%) Firewall
9 6 (0.31%) DHCP
9 6 (0.31%) VoIP
10 5 (0.26%) Internet
10 5 (0.26%) MPLS
11 4 (0.21%) SD-WAN
11 4 (0.21%) TCP/IP
12 3 (0.16%) FTP
12 3 (0.16%) HTTP
Database & Business Intelligence
1 261 (13.69%) SQL Server
2 49 (2.57%) Elasticsearch
3 46 (2.41%) Power BI
4 17 (0.89%) Data Warehouse
4 17 (0.89%) Metadata
5 12 (0.63%) Power Query
6 10 (0.52%) PostgreSQL
7 8 (0.42%) Relational Database
8 7 (0.37%) NoSQL
8 7 (0.37%) Tableau
9 5 (0.26%) Amazon Redshift
9 5 (0.26%) Looker
9 5 (0.26%) Metadata Repository
10 4 (0.21%) Data Hub
10 4 (0.21%) Data Mining
10 4 (0.21%) MongoDB
10 4 (0.21%) Tick Data
11 3 (0.16%) Azure SQL Data Warehouse
11 3 (0.16%) Big Data
11 3 (0.16%) MySQL
Development Applications
1 268 (14.06%) JIRA
2 252 (13.22%) GitLab
2 252 (13.22%) Selenium
3 249 (13.06%) SonarQube
4 247 (12.96%) Bitbucket
4 247 (12.96%) Cucumber
4 247 (12.96%) Maven
4 247 (12.96%) Sonatype Nexus
5 14 (0.73%) Axure RP
5 14 (0.73%) Balsamiq
6 12 (0.63%) Git
7 6 (0.31%) Visual Studio
8 5 (0.26%) Cypress.io
8 5 (0.26%) Jenkins
8 5 (0.26%) WebDriver
9 3 (0.16%) ERwin
9 3 (0.16%) JUnit
9 3 (0.16%) Mockito
9 3 (0.16%) Visual Studio Code
10 2 (0.10%) ER Studio
General
1 403 (21.14%) Analytical Skills
2 399 (20.93%) Finance
3 379 (19.88%) Social Skills
4 353 (18.52%) Law
5 322 (16.89%) Legal
6 258 (13.54%) Banking
7 158 (8.29%) Retail
8 124 (6.51%) Public Sector
9 95 (4.98%) Marketing
10 91 (4.77%) Investment Banking
11 90 (4.72%) Corporate Banking
12 53 (2.78%) Organisational Skills
13 37 (1.94%) Presentation Skills
14 27 (1.42%) Advertising
15 21 (1.10%) Telecoms
16 18 (0.94%) Local Government
17 17 (0.89%) Games
18 15 (0.79%) Manufacturing
19 13 (0.68%) Influencing Skills
20 11 (0.58%) Back Office
Job Titles
1 438 (22.98%) Software Engineer
2 303 (15.90%) Senior
3 284 (14.90%) Infrastructure Engineer
4 186 (9.76%) Senior Software Engineer
5 106 (5.56%) Developer
6 95 (4.98%) Lead
7 86 (4.51%) Analyst
8 56 (2.94%) Software Developer
9 55 (2.89%) Architect
10 47 (2.47%) Microsoft Specialist
11 43 (2.26%) Cisco Specialist
12 30 (1.57%) Senior Manager
13 25 (1.31%) Consultant
14 23 (1.21%) Business Analyst
15 22 (1.15%) Sales Executive
16 21 (1.10%) Designer
16 21 (1.10%) IT Support
16 21 (1.10%) Support Engineer
17 20 (1.05%) Product Manager
17 20 (1.05%) Senior Developer
Libraries, Frameworks & Software Standards
1 265 (13.90%) HTML
2 264 (13.85%) CSS
2 264 (13.85%) Elastic Stack
3 261 (13.69%) React
4 259 (13.59%) Kafka
5 258 (13.54%) Spring
6 250 (13.12%) Spring Boot
7 248 (13.01%) Redux
8 247 (12.96%) JPA
9 239 (12.54%) .NET
10 228 (11.96%) Node.js
11 160 (8.39%) Hibernate
12 111 (5.82%) REST
13 95 (4.98%) RESTful
14 92 (4.83%) Sass
15 90 (4.72%) CSS3
15 90 (4.72%) HTML5
15 90 (4.72%) Jest
16 51 (2.68%) Pandas
17 24 (1.26%) EDI
Miscellaneous
1 776 (40.71%) Cyberattack
2 297 (15.58%) Product Ownership
3 249 (13.06%) Enterprise Software
4 201 (10.55%) Self-Motivation
5 179 (9.39%) Linux Command Line
6 54 (2.83%) Onboarding
7 40 (2.10%) Management Information System
7 40 (2.10%) Social Media
8 31 (1.63%) Data Centre
9 28 (1.47%) Cloud Native
10 26 (1.36%) Video Conferencing
11 18 (0.94%) Digital Signage
11 18 (0.94%) Microsoft Licensing
12 16 (0.84%) Hybrid Cloud
13 15 (0.79%) NHS
13 15 (0.79%) SCADA
14 13 (0.68%) Renewable Energy
15 12 (0.63%) Hedge funds
15 12 (0.63%) Reinsurance
16 11 (0.58%) Xbox
Operating Systems
1 511 (26.81%) Linux
2 318 (16.68%) Android
3 299 (15.69%) Windows
4 13 (0.68%) Windows Server
5 10 (0.52%) Windows 10
6 7 (0.37%) Apple iOS
7 6 (0.31%) Unix
8 2 (0.10%) Mac OS
Processes & Methodologies
1 643 (33.74%) Agile
2 628 (32.95%) Line Management
3 594 (31.16%) DevOps
4 500 (26.23%) Software Engineering
5 439 (23.03%) Microservices
6 404 (21.20%) Problem-Solving
7 373 (19.57%) Mentoring
8 364 (19.10%) Cybersecurity
9 324 (17.00%) User Experience
10 320 (16.79%) CI/CD
11 315 (16.53%) Mathematics
12 307 (16.11%) Containerisation
13 302 (15.84%) Risk Management
14 288 (15.11%) Creative Thinking
15 286 (15.01%) Infrastructure Engineering
16 279 (14.64%) SDLC
17 277 (14.53%) Test Automation
18 275 (14.43%) Task Automation
19 266 (13.96%) Platform Engineering
20 262 (13.75%) Storage Management
Programming Languages
1 564 (29.59%) Python
2 514 (26.97%) JavaScript
3 512 (26.86%) Java
4 325 (17.05%) SQL
5 273 (14.32%) PowerShell
6 264 (13.85%) Bash
7 239 (12.54%) C++
8 229 (12.01%) Go
9 228 (11.96%) Rust
10 93 (4.88%) TypeScript
11 19 (1.00%) C#
12 14 (0.73%) Data Analysis Expressions
13 10 (0.52%) PHP
14 8 (0.42%) C
15 7 (0.37%) RPG
16 6 (0.31%) Scala
16 6 (0.31%) T-SQL
17 4 (0.21%) Apex Code
17 4 (0.21%) R
17 4 (0.21%) Shell Script
Qualifications
1 304 (15.95%) Security Cleared
2 231 (12.12%) DV Cleared
3 228 (11.96%) Degree
4 182 (9.55%) AWS Certification
5 178 (9.34%) AWS Certified Developer
5 178 (9.34%) AWS Certified Solutions Architect
6 65 (3.41%) SC Cleared
7 35 (1.84%) Computer Science Degree
8 19 (1.00%) DBS Check
9 18 (0.94%) Microsoft Certification
10 13 (0.68%) Chartered Engineer
11 11 (0.58%) Master's Degree
12 10 (0.52%) ACCA
13 9 (0.47%) CIMA
13 9 (0.47%) ITIL Certification
14 8 (0.42%) CITP
14 8 (0.42%) HNC
15 6 (0.31%) Azure Certification
15 6 (0.31%) BPSS Clearance
16 5 (0.26%) CIPD
Quality Assurance & Compliance
1 302 (15.84%) NCSC
2 298 (15.63%) QA
3 123 (6.45%) Accessibility
4 28 (1.47%) Data Quality
5 23 (1.21%) NIST
6 22 (1.15%) ISO/IEC 27001
7 20 (1.05%) GDPR
8 16 (0.84%) WCAG
9 7 (0.37%) PMO
10 6 (0.31%) Cyber Essentials
11 5 (0.26%) COBIT
11 5 (0.26%) SLA
12 2 (0.10%) Actionable Recommendations
12 2 (0.10%) California Consumer Privacy Act
12 2 (0.10%) Cyber Essentials PLUS
12 2 (0.10%) EU AI Act
12 2 (0.10%) IEC 61508
12 2 (0.10%) ISO 19650
13 1 (0.052%) APQC
13 1 (0.052%) NIST 800
System Software
1 585 (30.69%) Docker
2 264 (13.85%) Hyper-V
2 264 (13.85%) vSphere
3 262 (13.75%) VMware NSX
4 34 (1.78%) Active Directory
5 3 (0.16%) VMware Infrastructure
6 2 (0.10%) Terminal Services
6 2 (0.10%) Virtual Machines
7 1 (0.052%) Firmware
7 1 (0.052%) Forefront TMG
7 1 (0.052%) HDFS
7 1 (0.052%) ISA Server
7 1 (0.052%) Varnish
Systems Management
1 331 (17.37%) Terraform
2 329 (17.26%) Ansible
3 322 (16.89%) Kubernetes
4 13 (0.68%) Microsoft Intune
5 4 (0.21%) Cisco CUCM
5 4 (0.21%) SCCM
6 3 (0.16%) AirWatch
6 3 (0.16%) Argo
7 2 (0.10%) Functional Safety
7 2 (0.10%) Grafana
7 2 (0.10%) Kustomize
7 2 (0.10%) Prometheus
8 1 (0.052%) Marathon
8 1 (0.052%) Nmap
8 1 (0.052%) Plesk
8 1 (0.052%) Systems Management Server (SMS)
Vendors
1 386 (20.25%) Cisco
2 264 (13.85%) Juniper
2 264 (13.85%) Splunk
3 262 (13.75%) 3PAR
4 247 (12.96%) Microsoft
4 247 (12.96%) Solace
5 54 (2.83%) Adobe
6 47 (2.47%) Google
7 36 (1.89%) Apple
8 35 (1.84%) Salesforce
9 34 (1.78%) Palo Alto
10 27 (1.42%) Dell
11 18 (0.94%) Mitel
11 18 (0.94%) Polycom
11 18 (0.94%) ShoreTel
11 18 (0.94%) YouTube
12 16 (0.84%) Fortinet
13 14 (0.73%) Oracle
14 13 (0.68%) Aruba
14 13 (0.68%) Facebook