Hybrid/Remote MySQL Job Trends

MySQL
UK > Work from Home

The table below provides summary statistics and salary benchmarking for remote or hybrid work requiring MySQL skills. It covers permanent job vacancies from the 6 months leading up to 26 November 2025, with comparisons to the same periods in the previous two years.

6 months to
26 Nov 2025
Same period 2024 Same period 2023
Rank 170 137 111
Rank change year-on-year -33 -26 +12
Permanent jobs citing MySQL 227 466 609
As % of all permanent jobs with remote/hybrid work options 1.49% 2.34% 2.90%
As % of the Database & Business Intelligence category 9.82% 10.13% 11.75%
Number of salaries quoted 201 298 523
10th Percentile £25,000 £31,250 £37,500
25th Percentile £28,750 £40,000 £45,000
Median annual salary (50th Percentile) £45,000 £52,500 £57,500
Median % change year-on-year -14.29% -8.70% +1.81%
75th Percentile £58,750 £67,500 £72,500
90th Percentile £72,500 £84,974 £84,056
UK median annual salary £55,000 £55,000 £55,000
% change year-on-year - - -4.35%

All Database and Business Intelligence Skills
Work from Home

MySQL falls under the Databases and Business Intelligence category. For comparison with the information above, the following table provides summary statistics for all permanent job vacancies with remote or hybrid options requiring database or business intelligence skills.

Permanent vacancies with a requirement for database or business intelligence skills 2,312 4,602 5,183
As % of all permanent jobs with a WFH option 15.16% 23.16% 24.64%
Number of salaries quoted 1,775 2,831 4,143
10th Percentile £35,500 £40,000 £39,800
25th Percentile £45,000 £48,750 £47,500
Median annual salary (50th Percentile) £60,000 £70,000 £60,000
Median % change year-on-year -14.29% +16.67% -0.41%
75th Percentile £80,000 £95,000 £77,542
90th Percentile £110,000 £122,500 £93,750
UK median annual salary £60,000 £65,000 £60,000
% change year-on-year -7.69% +8.33% -4.00%

MySQL
Job Vacancy Trend for Remote/Hybrid Jobs

Historical trend showing the proportion of permanent IT job postings citing MySQL and offering remote or hybrid work options relative to all permanent IT jobs advertised.
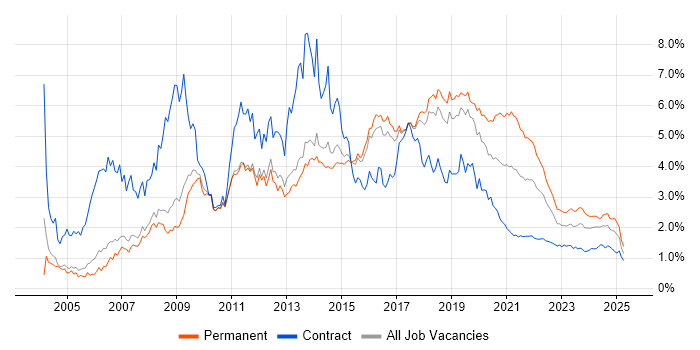
MySQL job vacancy trend for remote/hybrid jobs

MySQL
Salary Trend for Remote/Hybrid Jobs

Salary distribution trend for jobs with remote/hybrid work options citing MySQL.

Salary distribution trend for jobs with remote/hybrid work options citing MySQL

MySQL
Salary Histogram for Remote/Hybrid Jobs

Salary distribution for jobs with remote/hybrid work options citing MySQL over the 6 months to 26 November 2025.

MySQL salary histogram for jobs with remote/hybrid work options

MySQL
Co-Occurring Skills & Capabilities in Remote/Hybrid Jobs by Category

The following tables expand on the one above by listing co-occurrences grouped by category. They cover the same employment type, locality and period, with up to 20 co-occurrences shown in each category:

Application Platforms
1 14 (6.17%) Apache Solr
2 9 (3.96%) CMS
2 9 (3.96%) Confluence
3 6 (2.64%) IIS
3 6 (2.64%) SharePoint
3 6 (2.64%) WordPress
4 4 (1.76%) Microsoft Exchange
4 4 (1.76%) nginx
5 2 (0.88%) Apache Spark
6 1 (0.44%) Apache
6 1 (0.44%) JBoss
6 1 (0.44%) SugarCRM
Applications
1 4 (1.76%) Adobe Illustrator
1 4 (1.76%) Photoshop
2 3 (1.32%) Adobe XD
Business Applications
1 4 (1.76%) Magento
2 1 (0.44%) Payment Gateway
2 1 (0.44%) Shopify
Cloud Services
1 98 (43.17%) Azure
2 76 (33.48%) AWS
3 24 (10.57%) SaaS
4 17 (7.49%) GitHub
5 16 (7.05%) GCP
6 15 (6.61%) Cloudflare
7 14 (6.17%) Serverless
8 9 (3.96%) Power Platform
9 8 (3.52%) Amazon S3
9 8 (3.52%) AWS CloudFormation
9 8 (3.52%) Azure DevOps
10 7 (3.08%) AWS Lambda
10 7 (3.08%) Azure Data Factory
10 7 (3.08%) npm
11 6 (2.64%) Amazon SQS
11 6 (2.64%) Microsoft 365
12 5 (2.20%) Azure Service Bus
13 4 (1.76%) Cloud Computing
14 3 (1.32%) Amazon EC2
14 3 (1.32%) Google Analytics
Communications & Networking
1 3 (1.32%) Broadband
2 2 (0.88%) DNS
3 1 (0.44%) DHCP
3 1 (0.44%) HTTP
3 1 (0.44%) HTTPS
3 1 (0.44%) IPsec
3 1 (0.44%) IPv6
3 1 (0.44%) RFID
3 1 (0.44%) TCP/IP
Database & Business Intelligence
1 87 (38.33%) SQL Server
2 40 (17.62%) PostgreSQL
3 26 (11.45%) Relational Database
4 23 (10.13%) Elasticsearch
5 22 (9.69%) MongoDB
6 20 (8.81%) NoSQL
7 13 (5.73%) BusinessObjects
8 10 (4.41%) Data Warehouse
9 9 (3.96%) Amazon Redshift
9 9 (3.96%) MariaDB
10 7 (3.08%) DynamoDB
11 6 (2.64%) Power BI
11 6 (2.64%) RDBMS
11 6 (2.64%) Tableau
12 5 (2.20%) Redis
13 4 (1.76%) Crystal Reports
14 3 (1.32%) SQL Server Integration Services
15 2 (0.88%) Apache Cassandra
15 2 (0.88%) Azure SQL Database
15 2 (0.88%) DB2
Development Applications
1 61 (26.87%) Git
2 22 (9.69%) JIRA
3 6 (2.64%) Bitbucket
3 6 (2.64%) Jenkins
4 5 (2.20%) Cypress.io
4 5 (2.20%) git-flow
4 5 (2.20%) NUnit
4 5 (2.20%) TeamCity
5 4 (1.76%) Jasmine
6 3 (1.32%) CircleCI
6 3 (1.32%) Mocha
6 3 (1.32%) webpack
7 2 (0.88%) Eclipse
7 2 (0.88%) GitLab
7 2 (0.88%) JMeter
7 2 (0.88%) JUnit
7 2 (0.88%) Mockito
7 2 (0.88%) Robot Framework
7 2 (0.88%) SonarQube
8 1 (0.44%) Visual Studio
General
1 89 (39.21%) Social Skills
2 44 (19.38%) Finance
3 22 (9.69%) Analytical Skills
4 16 (7.05%) Law
5 9 (3.96%) Marketing
6 7 (3.08%) Automotive
6 7 (3.08%) Front Office
6 7 (3.08%) Public Sector
7 6 (2.64%) Games
8 5 (2.20%) Inclusion and Diversity
9 3 (1.32%) Advertising
9 3 (1.32%) Billing
9 3 (1.32%) Multimedia
10 2 (0.88%) Retail
10 2 (0.88%) Tech for Good
11 1 (0.44%) Banking
11 1 (0.44%) Health Technology
11 1 (0.44%) Manufacturing
11 1 (0.44%) Pharmaceutical
Job Titles
1 149 (65.64%) Developer
2 45 (19.82%) Graduate
2 45 (19.82%) Graduate Developer
3 38 (16.74%) PHP Developer
4 34 (14.98%) IT Graduate
5 28 (12.33%) Senior
6 27 (11.89%) C# Developer
7 24 (10.57%) Senior Developer
7 24 (10.57%) Software Developer
8 23 (10.13%) Full-Stack Developer
9 17 (7.49%) Azure Developer
9 17 (7.49%) Graduate C# Developer
9 17 (7.49%) Graduate PHP Developer
9 17 (7.49%) Graduate SQL Developer
9 17 (7.49%) SQL Developer
10 14 (6.17%) Analyst
10 14 (6.17%) Support Engineer
11 13 (5.73%) Graduate Software Developer
12 12 (5.29%) Senior Full-Stack Developer
13 10 (4.41%) C# Software Developer
Libraries, Frameworks & Software Standards
1 97 (42.73%) CSS
2 68 (29.96%) .NET
3 53 (23.35%) HTML
4 49 (21.59%) jQuery
5 46 (20.26%) ASP.NET
6 40 (17.62%) React
7 31 (13.66%) Laravel
8 28 (12.33%) Node.js
9 22 (9.69%) AngularJS
9 22 (9.69%) REST
10 20 (8.81%) RESTful
11 19 (8.37%) Symfony
12 17 (7.49%) Vue
13 13 (5.73%) CodeIgniter
14 12 (5.29%) CakePHP
15 11 (4.85%) CSS3
15 11 (4.85%) HTML5
16 10 (4.41%) RabbitMQ
17 9 (3.96%) .NET Core
18 7 (3.08%) ASP.NET Core
Miscellaneous
1 16 (7.05%) Product Ownership
2 14 (6.17%) Virtual Team
3 13 (5.73%) Cloud Native
4 8 (3.52%) Self-Motivation
5 7 (3.08%) Management Information System
6 5 (2.20%) Mobile App
7 4 (1.76%) Online Games
8 3 (1.32%) Clustering
8 3 (1.32%) Data Centre
8 3 (1.32%) Legacy Code
8 3 (1.32%) Legacy Systems
8 3 (1.32%) Renewable Energy
8 3 (1.32%) Social Media
8 3 (1.32%) Sports Betting
9 2 (0.88%) Distributed Systems
9 2 (0.88%) Greenfield Project
9 2 (0.88%) IoT
9 2 (0.88%) Legacy Applications
10 1 (0.44%) Data Structures
10 1 (0.44%) Enterprise Software
Operating Systems
1 38 (16.74%) Linux
2 23 (10.13%) Windows
3 15 (6.61%) Windows Server
4 5 (2.20%) Unix
5 3 (1.32%) Android
5 3 (1.32%) Apple iOS
5 3 (1.32%) CentOS
5 3 (1.32%) Mac OS
5 3 (1.32%) Rocky
5 3 (1.32%) Ubuntu
6 2 (0.88%) Solaris
6 2 (0.88%) VMS
Processes & Methodologies
1 116 (51.10%) Agile
2 95 (41.85%) Problem-Solving
3 65 (28.63%) MVC
4 64 (28.19%) OO
5 56 (24.67%) CI/CD
6 53 (23.35%) OOP
7 50 (22.03%) Computer Science
8 49 (21.59%) Full-Stack Development
9 48 (21.15%) Continuous Improvement
10 34 (14.98%) DevOps
11 28 (12.33%) Software Engineering
12 27 (11.89%) Mentoring
13 26 (11.45%) AI
14 25 (11.01%) Microservices
14 25 (11.01%) Test Automation
15 24 (10.57%) Containerisation
16 20 (8.81%) Scrum
17 18 (7.93%) ETL
17 18 (7.93%) User Experience
18 17 (7.49%) High Availability
Programming Languages
1 113 (49.78%) PHP
2 101 (44.49%) SQL
3 90 (39.65%) JavaScript
4 83 (36.56%) C#
5 55 (24.23%) Java
6 44 (19.38%) C++
7 43 (18.94%) TypeScript
8 36 (15.86%) Python
9 9 (3.96%) PowerShell
10 5 (2.20%) Shell Script
10 5 (2.20%) T-SQL
11 3 (1.32%) Bash
11 3 (1.32%) Go
11 3 (1.32%) Kotlin
11 3 (1.32%) R
11 3 (1.32%) Swift
12 2 (0.88%) Perl
12 2 (0.88%) Scala
12 2 (0.88%) VB
Qualifications
1 58 (25.55%) Degree
2 50 (22.03%) Computer Science Degree
3 13 (5.73%) Security Cleared
4 11 (4.85%) SC Cleared
5 6 (2.64%) Master's Degree
6 4 (1.76%) BPSS Clearance
7 3 (1.32%) DBS Check
7 3 (1.32%) ITIL Foundation Certificate
8 2 (0.88%) Azure Certification
8 2 (0.88%) DV Cleared
9 1 (0.44%) AWS Certification
9 1 (0.44%) AWS Certified Developer
9 1 (0.44%) AWS Certified Solutions Architect
9 1 (0.44%) MCSE
9 1 (0.44%) Microsoft Certification
Quality Assurance & Compliance
1 18 (7.93%) QA
2 7 (3.08%) Accessibility
3 6 (2.64%) SLA
4 2 (0.88%) Data Quality
4 2 (0.88%) GDPR
4 2 (0.88%) HL7
4 2 (0.88%) ISO/IEC 27001
System Software
1 39 (17.18%) Docker
2 3 (1.32%) Active Directory
3 2 (0.88%) VMware NSX
3 2 (0.88%) vSphere
Systems Management
1 20 (8.81%) Terraform
2 18 (7.93%) Kubernetes
3 15 (6.61%) Ansible
4 3 (1.32%) Grafana
4 3 (1.32%) Nagios
5 2 (0.88%) Prometheus
6 1 (0.44%) Argo
Vendors
1 23 (10.13%) Microsoft
2 9 (3.96%) SAP
3 6 (2.64%) Oracle
3 6 (2.64%) Rollbar
4 5 (2.20%) Google
5 4 (1.76%) WooCommerce
6 3 (1.32%) Adobe
6 3 (1.32%) Apple
6 3 (1.32%) HubSpot
6 3 (1.32%) Informatica
6 3 (1.32%) RedGate
6 3 (1.32%) Talend
7 2 (0.88%) Atlassian
7 2 (0.88%) Databricks
7 2 (0.88%) OpenAI
7 2 (0.88%) Sage
7 2 (0.88%) Salesforce
7 2 (0.88%) Splunk
7 2 (0.88%) VMware
7 2 (0.88%) Zend