Decision-Making Jobs with Work from Home Options

Decision-Making
UK > Work from Home

The table below provides summary statistics for permanent remote or hybrid work requiring Decision-Making skills. It includes a benchmarking guide to the annual salaries offered in vacancies that cited Decision-Making over the 6 months leading up to 26 July 2024, comparing them to the same period in the previous two years.

6 months to
26 Jul 2024
Same period 2023 Same period 2022
Rank 39 67 82
Rank change year-on-year +28 +15 +25
Permanent jobs citing Decision-Making 1,544 1,446 3,425
As % of all permanent jobs with a WFH option 5.53% 4.41% 4.36%
As % of the Processes & Methodologies category 6.25% 4.59% 4.49%
Number of salaries quoted 713 854 1,578
10th Percentile £34,905 £36,000 £36,750
25th Percentile £41,500 £45,000 £45,617
Median annual salary (50th Percentile) £55,000 £60,125 £62,500
Median % change year-on-year -8.52% -3.80% +13.64%
75th Percentile £70,000 £80,000 £81,250
90th Percentile £91,250 £95,000 £91,250
UK median annual salary £55,000 £59,556 £60,000
% change year-on-year -7.65% -0.74% +9.09%

All Process and Methodology Skills
Work from Home

Decision-Making falls under the Processes and Methodologies category. For comparison with the information above, the following table provides summary statistics for all permanent job vacancies with remote or hybrid options requiring process or methodology skills.

Permanent vacancies with a requirement for process or methodology skills 24,720 31,469 76,283
As % of all permanent jobs with a WFH option 88.48% 95.89% 97.14%
Number of salaries quoted 17,624 23,346 43,834
10th Percentile £35,000 £37,500 £36,250
25th Percentile £42,500 £47,500 £46,250
Median annual salary (50th Percentile) £57,965 £62,500 £60,000
Median % change year-on-year -7.26% +4.17% +9.09%
75th Percentile £77,500 £81,250 £80,000
90th Percentile £96,250 £100,000 £95,000
UK median annual salary £55,000 £60,000 £60,000
% change year-on-year -8.33% - +9.09%

Decision-Making
Trend for Jobs with a WFH Option

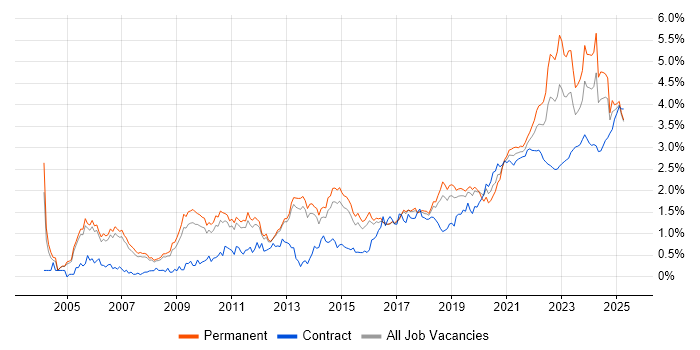
Job vacancies with a work from home option citing Decision-Making as a proportion of all IT jobs advertised.

Decision-Making trend for jobs with a WFH option

Decision-Making
Salary Trend for Jobs with a WFH Option

3-month moving average salary quoted in job vacancies with a work from home option citing Decision-Making.

Decision-Making salary trend for jobs with a WFH option

Decision-Making
Salary Histogram for Jobs with a WFH Option

Salary distribution for jobs with a work from home option citing Decision-Making over the 6 months to 26 July 2024.

Decision-Making salary histogram for jobs with a WFH option

Decision-Making
Co-occurring Skills and Capabilities with WFH Options by Category

The follow tables expand on the table above by listing co-occurrences grouped by category. The same employment type, locality and period is covered with up to 20 co-occurrences shown in each of the following categories:

Application Platforms
1 19 (1.23%) SharePoint
2 16 (1.04%) Confluence
3 11 (0.71%) Microsoft Exchange
4 9 (0.58%) SAS
5 8 (0.52%) Apache Airflow
5 8 (0.52%) Apache Spark
5 8 (0.52%) CMS
5 8 (0.52%) OpenStack
6 5 (0.32%) Apache
7 3 (0.19%) ArcGIS
8 2 (0.13%) Oracle Application Server
8 2 (0.13%) WebLogic
9 1 (0.065%) Camunda
9 1 (0.065%) EPiServer
9 1 (0.065%) Headless CMS
9 1 (0.065%) nginx
9 1 (0.065%) OpenEdge
Applications
1 535 (34.65%) Microsoft Excel
2 35 (2.27%) Microsoft Office
3 22 (1.42%) Microsoft PowerPoint
4 14 (0.91%) Microsoft Project
5 7 (0.45%) Sketch
6 6 (0.39%) InVision
7 4 (0.26%) MS Visio
8 3 (0.19%) Chatbot
8 3 (0.19%) Spreadsheet
9 2 (0.13%) Simulink
9 2 (0.13%) Stateflow
10 1 (0.065%) Adobe Captivate
10 1 (0.065%) AutoCAD
10 1 (0.065%) EPLAN
Business Applications
1 22 (1.42%) NEC Housing
2 12 (0.78%) Dynamics CRM
3 11 (0.71%) Salesforce CRM
4 10 (0.65%) Infor SunSystems
4 10 (0.65%) iTrent
5 4 (0.26%) SAP S/4HANA
6 3 (0.19%) SAP ERP
7 2 (0.13%) MIS ActiveH
7 2 (0.13%) NetSuite
7 2 (0.13%) Unit4 Business World
8 1 (0.065%) Endur
8 1 (0.065%) SAP CO
8 1 (0.065%) SAP FI
8 1 (0.065%) SAP FI/CO
8 1 (0.065%) Shopify
8 1 (0.065%) Visualfiles
Cloud Services
1 168 (10.88%) Azure
2 128 (8.29%) Power Platform
3 119 (7.71%) AWS
4 47 (3.04%) GCP
5 44 (2.85%) SaaS
6 42 (2.72%) Microsoft 365
7 21 (1.36%) Figma
8 18 (1.17%) IaaS
8 18 (1.17%) Power Automate
9 17 (1.10%) Amazon S3
9 17 (1.10%) Snowflake
10 16 (1.04%) Dynamics 365
11 15 (0.97%) Serverless
12 14 (0.91%) AWS Lambda
13 13 (0.84%) Amazon EC2
13 13 (0.84%) Google Analytics
14 12 (0.78%) AWS CloudFormation
14 12 (0.78%) dbt
15 11 (0.71%) Nutanix
16 10 (0.65%) Amazon EKS
Communications & Networking
1 458 (29.66%) Broadband
2 23 (1.49%) Firewall
3 20 (1.30%) VoIP
4 18 (1.17%) DNS
4 18 (1.17%) Unified Communications
5 12 (0.78%) WAN
6 9 (0.58%) Network Security
7 8 (0.52%) TCP/IP
8 7 (0.45%) DHCP
8 7 (0.45%) SMS
9 6 (0.39%) Intranet
9 6 (0.39%) Intrusion Detection
9 6 (0.39%) LAN
10 5 (0.32%) VLAN
11 4 (0.26%) iSCSI
11 4 (0.26%) SAN
12 3 (0.19%) HTTPS
12 3 (0.19%) MPLS
12 3 (0.19%) SSL
13 2 (0.13%) Internet
Database & Business Intelligence
1 120 (7.77%) Power BI
2 103 (6.67%) Tableau
3 71 (4.60%) Data Warehouse
4 57 (3.69%) SQL Server
5 34 (2.20%) BigQuery
6 26 (1.68%) Relational Database
7 16 (1.04%) BusinessObjects
7 16 (1.04%) Data Lake
8 15 (0.97%) QlikView
9 14 (0.91%) Amazon Redshift
9 14 (0.91%) SQL Server Integration Services
10 13 (0.84%) Qlik Sense
11 12 (0.78%) Big Data
11 12 (0.78%) DB2
12 11 (0.71%) Power Query
12 11 (0.71%) SQL Server Reporting Services
13 10 (0.65%) Amazon RDS
13 10 (0.65%) MySQL
13 10 (0.65%) NoSQL
14 9 (0.58%) GIS
Development Applications
1 66 (4.27%) Git
2 52 (3.37%) JIRA
3 11 (0.71%) SQL Server Management Studio (SSMS)
3 11 (0.71%) Subversion
4 9 (0.58%) GitLab
5 5 (0.32%) Jenkins
6 4 (0.26%) CircleCI
7 3 (0.19%) Visual Studio
8 1 (0.065%) Artifactory
8 1 (0.065%) Bitbucket
8 1 (0.065%) fastlane
8 1 (0.065%) Terragrunt
8 1 (0.065%) Xcode
General
1 940 (60.88%) Social Skills
2 770 (49.87%) Finance
3 725 (46.96%) Analytical Skills
4 482 (31.22%) Influencing Skills
5 121 (7.84%) Inclusion and Diversity
6 109 (7.06%) Legal
7 104 (6.74%) Marketing
8 91 (5.89%) Retail
9 90 (5.83%) Presentation Skills
10 74 (4.79%) Public Sector
11 44 (2.85%) Telecoms
12 39 (2.53%) Games
13 36 (2.33%) Local Government
14 33 (2.14%) Law
15 32 (2.07%) Manufacturing
16 28 (1.81%) Automotive
17 25 (1.62%) Organisational Skills
17 25 (1.62%) Police
18 21 (1.36%) Banking
19 20 (1.30%) Social Housing
Job Titles
1 680 (44.04%) Analyst
2 448 (29.02%) Senior
3 267 (17.29%) Senior Analyst
4 147 (9.52%) Financial Analyst
5 122 (7.90%) Commercial Analyst
6 106 (6.87%) Lead
7 88 (5.70%) Architect
8 72 (4.66%) Data Analyst
9 61 (3.95%) Senior Manager
10 58 (3.76%) Project Manager
11 51 (3.30%) Data Scientist
12 49 (3.17%) Development Manager
12 49 (3.17%) Senior Data Scientist
13 47 (3.04%) Business Manager
14 43 (2.78%) Solutions Architect
15 41 (2.66%) Developer
16 40 (2.59%) Business Development Manager
17 39 (2.53%) Product Manager
18 35 (2.27%) Data Engineer
18 35 (2.27%) Portfolio Manager
Libraries, Frameworks & Software Standards
1 52 (3.37%) TensorFlow
2 50 (3.24%) PySpark
3 46 (2.98%) Pandas
3 46 (2.98%) scikit-learn
4 36 (2.33%) .NET
5 19 (1.23%) HTML
6 18 (1.17%) React
7 15 (0.97%) Node.js
8 11 (0.71%) LDAP
9 8 (0.52%) ASP.NET
9 8 (0.52%) RabbitMQ
10 7 (0.45%) CSS
10 7 (0.45%) Web Services
11 6 (0.39%) .NET Core
11 6 (0.39%) PyTorch
11 6 (0.39%) Vue
12 5 (0.32%) .NET Framework
12 5 (0.32%) Kafka
13 4 (0.26%) Laravel
13 4 (0.26%) RESTful
Miscellaneous
1 73 (4.73%) Algorithms
2 72 (4.66%) Management Information System
3 53 (3.43%) Product Ownership
4 36 (2.33%) PMI
5 35 (2.27%) Mobile App
6 31 (2.01%) Self-Motivation
7 30 (1.94%) Data Structures
7 30 (1.94%) IoT
8 27 (1.75%) Onboarding
9 23 (1.49%) Social Media
10 20 (1.30%) Data Centre
11 17 (1.10%) Cyberattack
12 16 (1.04%) Analytical Mindset
13 15 (0.97%) Driving Licence
14 14 (0.91%) Renewable Energy
15 13 (0.84%) NHS
15 13 (0.84%) Public Cloud
16 12 (0.78%) Client/Server
16 12 (0.78%) Virtual Team
17 11 (0.71%) Cloud Native
Operating Systems
1 52 (3.37%) Windows
2 31 (2.01%) Linux
3 13 (0.84%) Apple iOS
4 10 (0.65%) Android
4 10 (0.65%) Windows Server
5 8 (0.52%) VME
5 8 (0.52%) Windows Vista
6 3 (0.19%) Amazon Linux
6 3 (0.19%) Windows Server 2008
6 3 (0.19%) Windows Server 2012
7 2 (0.13%) Unix
7 2 (0.13%) Windows 10
8 1 (0.065%) Embedded Linux
8 1 (0.065%) Ubuntu
8 1 (0.065%) Windows Server 2016
8 1 (0.065%) Windows Server 2019
Processes & Methodologies
1 735 (47.60%) Agile
2 646 (41.84%) Mentoring
3 595 (38.54%) Actionable Insight
4 491 (31.80%) Business Case
5 463 (29.99%) Budgeting and Forecasting
6 454 (29.40%) Budgeting
7 328 (21.24%) Problem-Solving
8 208 (13.47%) Analytics
9 197 (12.76%) Visualisation
10 177 (11.46%) Project Management
11 172 (11.14%) Business Intelligence
11 172 (11.14%) Coaching
12 144 (9.33%) Roadmaps
13 122 (7.90%) Data Analysis
14 114 (7.38%) Continuous Improvement
15 96 (6.22%) Data-Driven Decision Making
16 93 (6.02%) Mathematics
17 92 (5.96%) Data Science
18 91 (5.89%) Statistics
19 78 (5.05%) Data Management
Programming Languages
1 253 (16.39%) SQL
2 171 (11.08%) Python
3 40 (2.59%) R
4 38 (2.46%) C#
5 22 (1.42%) JavaScript
6 17 (1.10%) T-SQL
7 16 (1.04%) Bash
8 13 (0.84%) Data Analysis Expressions
8 13 (0.84%) PowerShell
9 11 (0.71%) Java
9 11 (0.71%) Julia
9 11 (0.71%) Perl
10 8 (0.52%) COBOL
10 8 (0.52%) Micro Focus COBOL
10 8 (0.52%) PHP
11 7 (0.45%) TypeScript
12 6 (0.39%) MATLAB
12 6 (0.39%) Scala
12 6 (0.39%) VBA
13 4 (0.26%) Ruby
Qualifications
1 475 (30.76%) ACCA
2 460 (29.79%) CIMA
3 328 (21.24%) Degree
4 98 (6.35%) DBS Check
5 96 (6.22%) Security Cleared
6 77 (4.99%) Master's Degree
7 48 (3.11%) PMI Certification
8 45 (2.91%) SC Cleared
9 37 (2.40%) APMP
10 33 (2.14%) Computer Science Degree
11 27 (1.75%) CISSP
12 22 (1.42%) DV Cleared
13 15 (0.97%) BPSS Clearance
14 14 (0.91%) PhD
15 13 (0.84%) PMP
16 12 (0.78%) CISM
17 9 (0.58%) ISEB
18 7 (0.45%) Numerate Degree
18 7 (0.45%) PRINCE2 Practitioner
19 6 (0.39%) CRISC
Quality Assurance & Compliance
1 58 (3.76%) Data Quality
2 51 (3.30%) Accessibility
3 46 (2.98%) QA
4 29 (1.88%) ISO/IEC 27001
5 24 (1.55%) SLA
6 19 (1.23%) GDPR
7 16 (1.04%) IFRS
8 15 (0.97%) Actionable Recommendations
8 15 (0.97%) NIST
9 9 (0.58%) Cyber Essentials
9 9 (0.58%) NCSC
10 8 (0.52%) ISO 9001
10 8 (0.52%) PMO
11 6 (0.39%) GRC
11 6 (0.39%) PCI DSS
12 5 (0.32%) GMP
13 3 (0.19%) California Consumer Privacy Act
13 3 (0.19%) HAZOP
13 3 (0.19%) NEBOSH
14 2 (0.13%) Def Stans
System Software
1 28 (1.81%) Active Directory
2 14 (0.91%) VMware Infrastructure
3 11 (0.71%) Virtual Machines
4 7 (0.45%) Docker
5 6 (0.39%) Hyper-V
6 4 (0.26%) NFS
7 1 (0.065%) Firmware
Systems Management
1 26 (1.68%) Kubernetes
2 20 (1.30%) Terraform
3 8 (0.52%) Microsoft Intune
4 3 (0.19%) Ansible
4 3 (0.19%) Single Sign-On
5 2 (0.13%) Active Directory Federation Services
5 2 (0.13%) SCCM
6 1 (0.065%) Argo
6 1 (0.065%) Autotask
6 1 (0.065%) FTK
6 1 (0.065%) Plesk
Vendors
1 601 (38.92%) Microsoft
2 73 (4.73%) Databricks
3 48 (3.11%) Google
4 43 (2.78%) SAP
5 31 (2.01%) Oracle
6 27 (1.75%) Salesforce
7 22 (1.42%) NEC
8 20 (1.30%) ServiceNow
8 20 (1.30%) VMware
9 15 (0.97%) CA
10 14 (0.91%) Adobe
11 13 (0.84%) IBM
12 12 (0.78%) BT
13 10 (0.65%) Infor
14 8 (0.52%) Micro Focus
15 7 (0.45%) Facebook
15 7 (0.45%) Workday
16 6 (0.39%) Hotjar
17 5 (0.32%) Splunk
18 4 (0.26%) RedGate