Internet Jobs with Work from Home Options

Internet
UK > Work from Home

The table below provides summary statistics for permanent remote or hybrid work requiring Internet skills. It includes a benchmarking guide to the annual salaries offered in vacancies that cited Internet over the 6 months leading up to 26 July 2024, comparing them to the same period in the previous two years.

6 months to
26 Jul 2024
Same period 2023 Same period 2022
Rank 276 259 255
Rank change year-on-year -17 -4 -24
Permanent jobs citing Internet 300 409 1,226
As % of all permanent jobs with a WFH option 1.07% 1.25% 1.56%
As % of the Communications & Networking category 7.16% 10.54% 13.03%
Number of salaries quoted 188 302 597
10th Percentile £26,250 £31,250 £32,600
25th Percentile £36,250 £38,813 £44,750
Median annual salary (50th Percentile) £55,000 £65,000 £60,000
Median % change year-on-year -15.38% +8.33% +20.00%
75th Percentile £66,250 £80,000 £85,000
90th Percentile £80,000 £90,000 £97,500
UK median annual salary £48,000 £50,000 £57,750
% change year-on-year -4.00% -13.42% +15.50%

All Communications and Computer Networking Skills
Work from Home

Internet falls under the Communications and Computer Networking category. For comparison with the information above, the following table provides summary statistics for all permanent job vacancies with remote or hybrid options requiring communications or computer networking skills.

Permanent vacancies with a requirement for communications or computer networking skills 4,190 3,882 9,409
As % of all permanent jobs with a WFH option 15.00% 11.83% 11.98%
Number of salaries quoted 2,346 3,097 5,593
10th Percentile £31,250 £31,569 £31,250
25th Percentile £41,250 £41,250 £41,500
Median annual salary (50th Percentile) £52,500 £57,500 £56,456
Median % change year-on-year -8.70% +1.85% +2.65%
75th Percentile £67,968 £76,250 £73,750
90th Percentile £81,250 £88,750 £90,000
UK median annual salary £49,000 £51,573 £52,500
% change year-on-year -4.99% -1.77% +5.00%

Internet
Trend for Jobs with a WFH Option

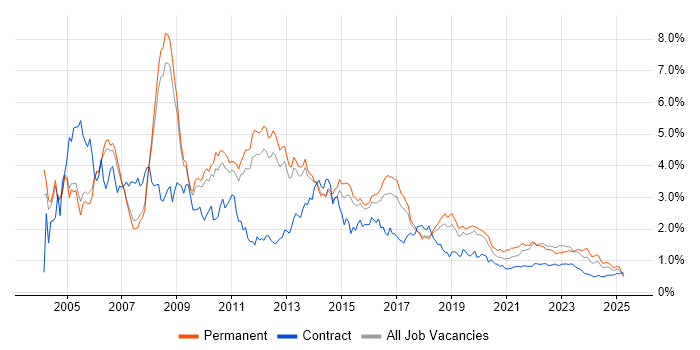
Job vacancies with a work from home option citing Internet as a proportion of all IT jobs advertised.

Internet trend for jobs with a WFH option

Internet
Salary Trend for Jobs with a WFH Option

3-month moving average salary quoted in job vacancies with a work from home option citing Internet.

Internet salary trend for jobs with a WFH option

Internet
Salary Histogram for Jobs with a WFH Option

Salary distribution for jobs with a work from home option citing Internet over the 6 months to 26 July 2024.

Internet salary histogram for jobs with a WFH option

Internet
Co-occurring Skills and Capabilities with WFH Options by Category

The follow tables expand on the table above by listing co-occurrences grouped by category. The same employment type, locality and period is covered with up to 20 co-occurrences shown in each of the following categories:

Application Platforms
1 54 (18.00%) Apache
2 5 (1.67%) IIS
3 4 (1.33%) Microsoft Exchange
3 4 (1.33%) SharePoint
4 2 (0.67%) CMS
4 2 (0.67%) Confluence
4 2 (0.67%) WordPress
Applications
1 23 (7.67%) Microsoft Office
2 10 (3.33%) Microsoft Excel
3 5 (1.67%) Microsoft PowerPoint
4 3 (1.00%) MS Visio
Business Applications
1 3 (1.00%) Sparx Enterprise Architect
2 2 (0.67%) Oracle Payables
3 1 (0.33%) Oracle Applications
3 1 (0.33%) Oracle Assets
3 1 (0.33%) Oracle EBS
3 1 (0.33%) Oracle EBS R12
3 1 (0.33%) Oracle E-Business Tax
3 1 (0.33%) Oracle General Ledger
3 1 (0.33%) Oracle Internet Expenses
3 1 (0.33%) Oracle iProcurement
3 1 (0.33%) Oracle Procure-to-Pay
3 1 (0.33%) Oracle Receivables
Cloud Services
1 86 (28.67%) Azure
2 55 (18.33%) Amazon S3
3 51 (17.00%) Microsoft 365
4 20 (6.67%) AWS
4 20 (6.67%) Entra ID
5 14 (4.67%) SaaS
6 10 (3.33%) IaaS
6 10 (3.33%) PaaS
7 6 (2.00%) Serverless
8 5 (1.67%) Cloud Computing
9 4 (1.33%) GitHub
10 3 (1.00%) Lucidchart
11 2 (0.67%) Amazon ECS
11 2 (0.67%) Azure DevOps
11 2 (0.67%) Google Workspace
11 2 (0.67%) Mimecast
12 1 (0.33%) Azure App Service
12 1 (0.33%) Google Docs
12 1 (0.33%) OCI
12 1 (0.33%) Rubrik
Communications & Networking
1 125 (41.67%) Firewall
2 102 (34.00%) VPN
3 55 (18.33%) SNMP
4 54 (18.00%) IPsec
5 45 (15.00%) LAN
5 45 (15.00%) WAN
6 32 (10.67%) Wi-Fi
7 22 (7.33%) Wireless
8 20 (6.67%) HTTP
9 18 (6.00%) TCP/IP
10 15 (5.00%) Broadband
10 15 (5.00%) DNS
11 10 (3.33%) BGP
11 10 (3.33%) WPA
12 8 (2.67%) Ethernet
13 7 (2.33%) DHCP
13 7 (2.33%) SD-WAN
14 6 (2.00%) Network Security
15 5 (1.67%) Remote Desktop
15 5 (1.67%) VoIP
Database & Business Intelligence
1 58 (19.33%) Elasticsearch
1 58 (19.33%) MongoDB
2 44 (14.67%) SQL Server
3 12 (4.00%) Azure SQL Database
4 7 (2.33%) SQL Server Reporting Services
5 4 (1.33%) Relational Database
6 3 (1.00%) Big Data
6 3 (1.00%) MySQL
6 3 (1.00%) NoSQL
7 2 (0.67%) MariaDB
8 1 (0.33%) BusinessObjects
8 1 (0.33%) GIS
8 1 (0.33%) PostgreSQL
8 1 (0.33%) Power BI
8 1 (0.33%) QlikView
Development Applications
1 4 (1.33%) JIRA
2 3 (1.00%) Jenkins
3 2 (0.67%) Browser DevTools
3 2 (0.67%) GitLab
3 2 (0.67%) Katalon Studio
3 2 (0.67%) Postman
3 2 (0.67%) Visual Studio
4 1 (0.33%) Bitbucket
4 1 (0.33%) ScriptRunner
4 1 (0.33%) Selenium
4 1 (0.33%) Toad
General
1 93 (31.00%) Finance
2 75 (25.00%) Social Skills
3 31 (10.33%) Retail
4 18 (6.00%) Analytical Skills
4 18 (6.00%) Electronics
5 14 (4.67%) Games
6 10 (3.33%) Inclusion and Diversity
6 10 (3.33%) Legal
7 8 (2.67%) Documentation Skills
7 8 (2.67%) Mandarin Language
7 8 (2.67%) Marketing
8 7 (2.33%) Law
8 7 (2.33%) Organisational Skills
9 6 (2.00%) Aerospace
9 6 (2.00%) Automotive
9 6 (2.00%) Telecoms
10 5 (1.67%) Public Sector
11 3 (1.00%) Billing
11 3 (1.00%) Manufacturing
11 3 (1.00%) Pharmaceutical
Job Titles
1 63 (21.00%) Consultant
2 62 (20.67%) Senior
3 54 (18.00%) NetApp Consultant
4 42 (14.00%) Infrastructure Engineer
5 39 (13.00%) Support Engineer
6 35 (11.67%) Developer
7 29 (9.67%) IT Support
8 27 (9.00%) Analyst
9 26 (8.67%) .NET Developer
10 21 (7.00%) IT Engineer
11 20 (6.67%) Senior Infrastructure Engineer
12 17 (5.67%) Hardware Engineer
12 17 (5.67%) IT Support Engineer
13 16 (5.33%) Architect
13 16 (5.33%) Lead
14 15 (5.00%) Infrastructure Support
14 15 (5.00%) Infrastructure Support Engineer
14 15 (5.00%) VMware Engineer
14 15 (5.00%) VMware Infrastructure Engineer
14 15 (5.00%) VMware Support Engineer
Libraries, Frameworks & Software Standards
1 55 (18.33%) YAML
2 54 (18.00%) RabbitMQ
3 31 (10.33%) .NET
4 27 (9.00%) HTML
5 25 (8.33%) .NET Core
6 24 (8.00%) ASP.NET
6 24 (8.00%) ASP.NET MVC
7 19 (6.33%) Entity Framework
8 18 (6.00%) AngularJS
9 17 (5.67%) ASP.NET Web API
10 14 (4.67%) HTML5
11 12 (4.00%) .NET Framework
11 12 (4.00%) CSS
12 10 (3.33%) Lightning Web Components
12 10 (3.33%) XML
13 9 (3.00%) Blazor
14 8 (2.67%) CSS3
14 8 (2.67%) RESTful
14 8 (2.67%) Twitter Bootstrap
15 7 (2.33%) React
Miscellaneous
1 67 (22.33%) Data Centre
2 22 (7.33%) IoT
3 16 (5.33%) Clustering
3 16 (5.33%) Greenfield Project
4 15 (5.00%) PKI
5 13 (4.33%) Social Media
6 12 (4.00%) NHS
7 11 (3.67%) Self-Motivation
8 8 (2.67%) Replication
9 7 (2.33%) Driving Licence
10 6 (2.00%) Cloud Native
10 6 (2.00%) Management Information System
11 4 (1.33%) CCTV
11 4 (1.33%) Cyber Threat
11 4 (1.33%) Mobile App
12 3 (1.00%) Client/Server
12 3 (1.00%) Video Conferencing
13 2 (0.67%) Fat Client
13 2 (0.67%) Handset
13 2 (0.67%) Thin Client
Operating Systems
1 148 (49.33%) Windows
2 102 (34.00%) Linux
3 54 (18.00%) Data ONTAP
4 32 (10.67%) Windows Server
5 28 (9.33%) Ubuntu
6 27 (9.00%) VMS
7 22 (7.33%) Windows 10
8 18 (6.00%) Windows Server 2019
9 16 (5.33%) Windows Server 2012
10 15 (5.00%) Android
10 15 (5.00%) Apple iOS
11 10 (3.33%) Mac OS
12 9 (3.00%) Windows Server 2016
13 4 (1.33%) Red Hat Enterprise Linux
14 3 (1.00%) Debian
15 2 (0.67%) Mac OS X
15 2 (0.67%) Unix
16 1 (0.33%) CentOS
16 1 (0.33%) Fedora
16 1 (0.33%) openSUSE
Processes & Methodologies
1 86 (28.67%) Problem-Solving
2 78 (26.00%) Agile
3 74 (24.67%) Project Management
4 73 (24.33%) Actionable Insight
5 65 (21.67%) Infrastructure Engineering
6 58 (19.33%) Release Management
7 56 (18.67%) Project Planning
8 55 (18.33%) Infrastructure Management
9 54 (18.00%) Storage Management
10 29 (9.67%) Customer Service
10 29 (9.67%) DevSecOps
10 29 (9.67%) Full Stack Development
11 28 (9.33%) Application Security
11 28 (9.33%) Collaborative Culture
12 24 (8.00%) MVC
13 22 (7.33%) Cybersecurity
13 22 (7.33%) Microservices
14 18 (6.00%) ITIL
15 17 (5.67%) Problem Management
15 17 (5.67%) SIEM
Programming Languages
1 67 (22.33%) Python
2 34 (11.33%) SQL
3 31 (10.33%) JavaScript
4 28 (9.33%) C#
5 24 (8.00%) PowerShell
6 15 (5.00%) ActionScript
6 15 (5.00%) VB
7 10 (3.33%) C
8 6 (2.00%) C++
8 6 (2.00%) Embedded C++
8 6 (2.00%) Java
9 5 (1.67%) TypeScript
10 4 (1.33%) Bash
10 4 (1.33%) Embedded C
11 3 (1.00%) PHP
12 2 (0.67%) Groovy
13 1 (0.33%) Bourne shell
13 1 (0.33%) Kotlin
13 1 (0.33%) Perl
13 1 (0.33%) XPath
Qualifications
1 49 (16.33%) Degree
2 31 (10.33%) Security Cleared
3 27 (9.00%) DV Cleared
4 16 (5.33%) Cisco Certification
5 10 (3.33%) CCNP
6 8 (2.67%) DBS Check
7 7 (2.33%) CCNA
8 6 (2.00%) Microsoft Certification
9 4 (1.33%) CISSP
10 3 (1.00%) (ISC)2 CCSP
10 3 (1.00%) A+ Certification
10 3 (1.00%) Azure Certification
10 3 (1.00%) CCIE
10 3 (1.00%) CCIE Security
10 3 (1.00%) CCSP
10 3 (1.00%) Computer Science Degree
10 3 (1.00%) JNCIP
10 3 (1.00%) SC Cleared
11 2 (0.67%) JNCIE
11 2 (0.67%) MCITP
Quality Assurance & Compliance
1 21 (7.00%) SLA
2 11 (3.67%) Cyber Essentials
3 8 (2.67%) QA
4 7 (2.33%) ISO 9001
5 4 (1.33%) ISO/IEC 27001
5 4 (1.33%) NIST
6 3 (1.00%) GDPR
7 1 (0.33%) Cyber Essentials PLUS
7 1 (0.33%) Disclosure Scotland
7 1 (0.33%) NCSC
System Software
1 83 (27.67%) VMware Infrastructure
2 76 (25.33%) Active Directory
3 58 (19.33%) Docker
4 23 (7.67%) vSphere
5 16 (5.33%) VMware ESXi
6 15 (5.00%) OpenSSH
6 15 (5.00%) XenApp
7 8 (2.67%) Virtual Machines
8 4 (1.33%) Hyper-V
8 4 (1.33%) Terminal Services
9 3 (1.00%) Firmware
10 2 (0.67%) VMware Server
11 1 (0.33%) Samba
11 1 (0.33%) VMware NSX
Systems Management
1 87 (29.00%) Ansible
2 70 (23.33%) vCenter Server
3 55 (18.33%) Kubernetes
4 54 (18.00%) Prometheus
5 34 (11.33%) Terraform
6 15 (5.00%) IBM BigFix
6 15 (5.00%) PowerCLI
7 8 (2.67%) CASB
7 8 (2.67%) Microsoft Intune
8 7 (2.33%) PaperCut
9 2 (0.67%) FortiGate
9 2 (0.67%) Grafana
10 1 (0.33%) Graphite
10 1 (0.33%) HAProxy
10 1 (0.33%) Nagios
10 1 (0.33%) Puppet
Vendors
1 85 (28.33%) Microsoft
1 85 (28.33%) VMware
2 59 (19.67%) Palo Alto
3 57 (19.00%) Red Hat
4 55 (18.33%) NetApp
5 54 (18.00%) SolidFire
6 20 (6.67%) Cisco
7 19 (6.33%) Citrix
8 15 (5.00%) IBM
9 14 (4.67%) Veeam
10 10 (3.33%) Salesforce
11 9 (3.00%) ServiceNow
12 8 (2.67%) Google
13 7 (2.33%) BT
13 7 (2.33%) Canon
14 6 (2.00%) Aderant
14 6 (2.00%) ConnectWise
14 6 (2.00%) HP
15 5 (1.67%) Zscaler
16 4 (1.33%) Meraki