User Experience Jobs with Work from Home Options

UX
UK > Work from Home

The table below provides summary statistics for permanent remote or hybrid work requiring User Experience skills. It includes a benchmarking guide to the annual salaries offered in vacancies that cited User Experience over the 6 months leading up to 26 July 2024, comparing them to the same period in the previous two years.

6 months to
26 Jul 2024
Same period 2023 Same period 2022
Rank 85 75 37
Rank change year-on-year -10 -38 +2
Permanent jobs citing User Experience 896 1,369 6,923
As % of all permanent jobs with a WFH option 3.21% 4.17% 8.82%
As % of the Processes & Methodologies category 3.62% 4.35% 9.08%
Number of salaries quoted 667 1,049 2,282
10th Percentile £31,250 £40,000 £38,000
25th Percentile £42,500 £50,000 £47,500
Median annual salary (50th Percentile) £55,000 £65,000 £60,000
Median % change year-on-year -15.38% +8.33% +9.09%
75th Percentile £68,750 £85,000 £77,500
90th Percentile £83,750 £111,250 £92,500
UK median annual salary £52,550 £62,500 £60,000
% change year-on-year -15.92% +4.17% +9.09%

All Process and Methodology Skills
Work from Home

User Experience falls under the Processes and Methodologies category. For comparison with the information above, the following table provides summary statistics for all permanent job vacancies with remote or hybrid options requiring process or methodology skills.

Permanent vacancies with a requirement for process or methodology skills 24,720 31,469 76,283
As % of all permanent jobs with a WFH option 88.48% 95.89% 97.14%
Number of salaries quoted 17,624 23,346 43,834
10th Percentile £35,000 £37,500 £36,250
25th Percentile £42,500 £47,500 £46,250
Median annual salary (50th Percentile) £57,965 £62,500 £60,000
Median % change year-on-year -7.26% +4.17% +9.09%
75th Percentile £77,500 £81,250 £80,000
90th Percentile £96,250 £100,000 £95,000
UK median annual salary £55,000 £60,000 £60,000
% change year-on-year -8.33% - +9.09%

User Experience
Trend for Jobs with a WFH Option

Job vacancies with a work from home option citing User Experience as a proportion of all IT jobs advertised.
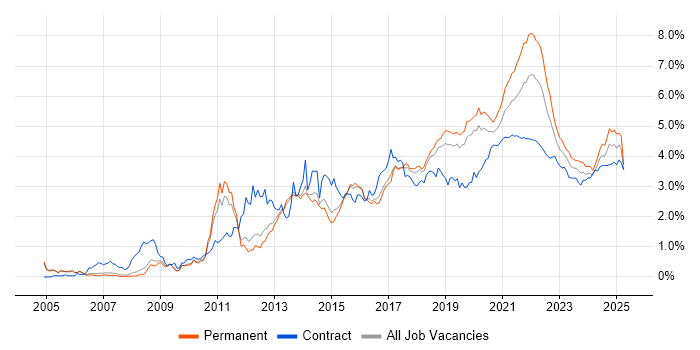
User Experience trend for jobs with a WFH option

User Experience
Salary Trend for Jobs with a WFH Option

3-month moving average salary quoted in job vacancies with a work from home option citing User Experience.

User Experience salary trend for jobs with a WFH option

User Experience
Salary Histogram for Jobs with a WFH Option

Salary distribution for jobs with a work from home option citing User Experience over the 6 months to 26 July 2024.

User Experience salary histogram for jobs with a WFH option

User Experience
Co-occurring Skills and Capabilities with WFH Options by Category

The follow tables expand on the table above by listing co-occurrences grouped by category. The same employment type, locality and period is covered with up to 20 co-occurrences shown in each of the following categories:

Application Platforms
1 40 (4.46%) CMS
2 36 (4.02%) Apache
3 34 (3.79%) Apache Airflow
4 29 (3.24%) Confluence
4 29 (3.24%) WordPress
5 18 (2.01%) SharePoint
6 8 (0.89%) Drupal
7 6 (0.67%) Apache Spark
7 6 (0.67%) Kentico
7 6 (0.67%) Microsoft Exchange
7 6 (0.67%) nginx
8 5 (0.56%) Adobe Experience Manager
8 5 (0.56%) Umbraco
9 4 (0.45%) Headless CMS
10 1 (0.11%) Ethereum
10 1 (0.11%) IIS
10 1 (0.11%) Joomla!
10 1 (0.11%) Oracle Workflow
10 1 (0.11%) SharePoint Server
10 1 (0.11%) Sitecore CMS
Applications
1 32 (3.57%) Adobe XD
2 27 (3.01%) Adobe Creative Suite
3 25 (2.79%) Sketch
4 23 (2.57%) Photoshop
5 22 (2.46%) Adobe Illustrator
6 21 (2.34%) Microsoft Office
7 12 (1.34%) Microsoft Excel
8 11 (1.23%) Adobe After Effects
8 11 (1.23%) InVision
9 8 (0.89%) InDesign
10 6 (0.67%) Microsoft PowerPoint
11 5 (0.56%) Blender
11 5 (0.56%) Microsoft Project
11 5 (0.56%) Spreadsheet
12 3 (0.33%) Adobe Premiere
12 3 (0.33%) Chatbot
12 3 (0.33%) Trello
13 2 (0.22%) MS Visio
13 2 (0.22%) Zeplin
14 1 (0.11%) Acrobat
Business Applications
1 20 (2.23%) NEC Housing
2 15 (1.67%) Magento
3 10 (1.12%) SAP S/4HANA
3 10 (1.12%) Shopify
4 8 (0.89%) SAP CO
4 8 (0.89%) SAP FI
4 8 (0.89%) SAP FI/CO
5 6 (0.67%) Dynamics CRM
6 3 (0.33%) Dynamics NAV
6 3 (0.33%) Payment Gateway
7 1 (0.11%) Data Workbench
7 1 (0.11%) Endur
7 1 (0.11%) NetSuite
7 1 (0.11%) SAP CRM
Cloud Services
1 151 (16.85%) AWS
2 95 (10.60%) Azure
3 87 (9.71%) Figma
4 73 (8.15%) SaaS
5 47 (5.25%) GCP
6 37 (4.13%) Microsoft 365
7 28 (3.13%) Power Platform
8 26 (2.90%) Azure DevOps
9 18 (2.01%) Google Analytics
9 18 (2.01%) Miro
10 17 (1.90%) GitHub
10 17 (1.90%) Power Automate
11 15 (1.67%) npm
11 15 (1.67%) PowerApps
12 13 (1.45%) Dynamics 365
13 9 (1.00%) Adobe Creative Cloud
14 8 (0.89%) Cloud Computing
15 7 (0.78%) Amazon S3
15 7 (0.78%) Entra ID
15 7 (0.78%) Firebase
Communications & Networking
1 12 (1.34%) Firewall
2 10 (1.12%) Intranet
3 7 (0.78%) DNS
4 6 (0.67%) TCP/IP
5 5 (0.56%) DHCP
5 5 (0.56%) VPN
6 4 (0.45%) HTTP
6 4 (0.45%) Wi-Fi
7 2 (0.22%) NGFW
7 2 (0.22%) SAN
7 2 (0.22%) SNA
7 2 (0.22%) VoIP
7 2 (0.22%) WAN
7 2 (0.22%) Wireless
8 1 (0.11%) AMQP
8 1 (0.11%) Ethernet
8 1 (0.11%) NAS
8 1 (0.11%) NetScaler
8 1 (0.11%) Unified Communications
8 1 (0.11%) VLAN
Database & Business Intelligence
1 37 (4.13%) SQL Server
2 34 (3.79%) Apache Ignite
3 32 (3.57%) MySQL
4 22 (2.46%) Power BI
5 16 (1.79%) Relational Database
6 14 (1.56%) PostgreSQL
7 11 (1.23%) Elasticsearch
7 11 (1.23%) Redis
8 9 (1.00%) Big Data
8 9 (1.00%) Tableau
9 7 (0.78%) Data Warehouse
9 7 (0.78%) MongoDB
10 5 (0.56%) Azure SQL Database
10 5 (0.56%) Hadoop
10 5 (0.56%) MS Access
10 5 (0.56%) Power Query
11 4 (0.45%) Amazon RDS
11 4 (0.45%) Amazon Redshift
11 4 (0.45%) Scylla
12 3 (0.33%) DynamoDB
Development Applications
1 92 (10.27%) JIRA
2 87 (9.71%) Git
3 20 (2.23%) Axure RP
4 15 (1.67%) webpack
5 14 (1.56%) Balsamiq
6 9 (1.00%) Jenkins
7 8 (0.89%) Bitbucket
8 7 (0.78%) gulp
8 7 (0.78%) Visual Studio
9 6 (0.67%) Selenium
10 5 (0.56%) Cypress.io
10 5 (0.56%) Maven
10 5 (0.56%) Vite
11 4 (0.45%) PHPUnit
12 3 (0.33%) Android Studio
12 3 (0.33%) Cucumber
13 2 (0.22%) fastlane
13 2 (0.22%) Subversion
14 1 (0.11%) Jasmine
14 1 (0.11%) Xcode
General
1 319 (35.60%) Social Skills
2 178 (19.87%) Finance
3 150 (16.74%) Marketing
4 96 (10.71%) Public Sector
5 80 (8.93%) Analytical Skills
6 61 (6.81%) Inclusion and Diversity
7 53 (5.92%) Presentation Skills
8 45 (5.02%) Retail
9 35 (3.91%) Front Office
10 30 (3.35%) Legal
11 28 (3.13%) Manufacturing
12 25 (2.79%) Local Government
13 22 (2.46%) Banking
14 21 (2.34%) Games
14 21 (2.34%) Police
15 20 (2.23%) Organisational Skills
15 20 (2.23%) Social Housing
16 18 (2.01%) Automotive
16 18 (2.01%) Pharmaceutical
17 15 (1.67%) Advertising
Job Titles
1 284 (31.70%) Developer
2 145 (16.18%) Senior
3 103 (11.50%) Designer
4 85 (9.49%) Front-End Developer (Client-Side Developer)
5 78 (8.71%) Lead
6 77 (8.59%) Software Engineer
7 58 (6.47%) Senior Developer
7 58 (6.47%) UX Designer
8 54 (6.03%) Product Manager
9 52 (5.80%) React Developer
10 46 (5.13%) Architect
11 43 (4.80%) Analyst
11 43 (4.80%) UI Developer
12 38 (4.24%) Front-End Engineer (Client-Side Engineer)
13 37 (4.13%) Full Stack Developer
14 36 (4.02%) Developer/Software Engineer
15 35 (3.91%) UI Designer
15 35 (3.91%) UI Engineer
16 32 (3.57%) ITSM Architect
16 32 (3.57%) Service Architect
Libraries, Frameworks & Software Standards
1 193 (21.54%) HTML
2 177 (19.75%) CSS
3 129 (14.40%) React
4 87 (9.71%) Node.js
5 68 (7.59%) .NET
6 59 (6.58%) AngularJS
6 59 (6.58%) RESTful
7 50 (5.58%) Vue
8 46 (5.13%) jQuery
9 44 (4.91%) Redux
10 43 (4.80%) HTML5
11 38 (4.24%) Laravel
12 34 (3.79%) gRPC
12 34 (3.79%) Protocol Buffers
13 29 (3.24%) Sass
14 24 (2.68%) JSON
15 21 (2.34%) Tailwind CSS
16 19 (2.12%) Next.js
17 17 (1.90%) GraphQL
17 17 (1.90%) REST
Miscellaneous
1 88 (9.82%) Mobile App
2 64 (7.14%) Product Ownership
3 35 (3.91%) Data Centre
4 34 (3.79%) Fixed Income
5 29 (3.24%) Algorithms
6 27 (3.01%) Social Media
7 23 (2.57%) Data Structures
8 21 (2.34%) Management Information System
9 20 (2.23%) Self-Motivation
10 18 (2.01%) Life Science
11 17 (1.90%) Onboarding
12 16 (1.79%) Graphic Design
13 15 (1.67%) Greenfield Project
14 13 (1.45%) Animation
15 12 (1.34%) NHS
16 11 (1.23%) Operational Technology
17 10 (1.12%) SCADA
18 9 (1.00%) Blog
18 9 (1.00%) Digital Media
18 9 (1.00%) Virtual Team
Operating Systems
1 46 (5.13%) Windows
2 40 (4.46%) Android
3 36 (4.02%) Apple iOS
4 18 (2.01%) Windows Server
5 16 (1.79%) Linux
6 5 (0.56%) Windows 10
7 3 (0.33%) Mac OS
7 3 (0.33%) Windows Embedded Compact
8 1 (0.11%) Unix
8 1 (0.11%) VMS
8 1 (0.11%) Windows Server 2016
8 1 (0.11%) Windows Server 2019
Processes & Methodologies
1 341 (38.06%) UX Design
2 313 (34.93%) Agile
3 208 (23.21%) Problem-Solving
4 122 (13.62%) Software Engineering
5 117 (13.06%) Full Stack Development
6 115 (12.83%) Front End Development
7 108 (12.05%) Roadmaps
8 106 (11.83%) Project Management
9 104 (11.61%) DevOps
10 84 (9.38%) Wireframes
11 82 (9.15%) E-Commerce
11 82 (9.15%) Stakeholder Management
12 79 (8.82%) User Research
13 72 (8.04%) Analytics
14 67 (7.48%) Continuous Improvement
14 67 (7.48%) Web Development
15 65 (7.25%) Project Delivery
16 62 (6.92%) Customer Experience
16 62 (6.92%) ITIL
17 60 (6.70%) Mentoring
Programming Languages
1 243 (27.12%) JavaScript
2 108 (12.05%) TypeScript
3 76 (8.48%) Python
4 65 (7.25%) SQL
5 63 (7.03%) PHP
6 62 (6.92%) C#
7 42 (4.69%) Java
8 19 (2.12%) Kotlin
9 11 (1.23%) Swift
9 11 (1.23%) T-SQL
10 7 (0.78%) Go
10 7 (0.78%) VB.NET
11 6 (0.67%) C++
11 6 (0.67%) Data Analysis Expressions
11 6 (0.67%) VBA
12 5 (0.56%) C
12 5 (0.56%) Scala
12 5 (0.56%) VB
13 4 (0.45%) Bash
14 3 (0.33%) R
Qualifications
1 212 (23.66%) Degree
2 48 (5.36%) Security Cleared
3 43 (4.80%) SC Cleared
4 35 (3.91%) Computer Science Degree
5 23 (2.57%) DBS Check
6 21 (2.34%) Microsoft Certification
7 14 (1.56%) Master's Degree
8 7 (0.78%) MBA
9 6 (0.67%) CSPO
9 6 (0.67%) IIBA
10 4 (0.45%) BPSS Clearance
10 4 (0.45%) ITIL Certification
10 4 (0.45%) ITIL Foundation Certificate
11 3 (0.33%) Azure Certification
11 3 (0.33%) ISTQB
11 3 (0.33%) MCSE
11 3 (0.33%) Six Sigma Black Belt
12 2 (0.22%) DV Cleared
12 2 (0.22%) ISTQB Foundation Certification
12 2 (0.22%) Numerate Degree
Quality Assurance & Compliance
1 72 (8.04%) Accessibility
2 54 (6.03%) QA
3 13 (1.45%) WCAG
4 10 (1.12%) Data Quality
5 9 (1.00%) GDPR
6 6 (0.67%) Actionable Recommendations
7 5 (0.56%) PMO
8 4 (0.45%) HIPAA
8 4 (0.45%) ISO/IEC 27001
9 3 (0.33%) SLA
10 2 (0.22%) GLP
10 2 (0.22%) ISO 14001
10 2 (0.22%) ISO 9001
10 2 (0.22%) PCI DSS
System Software
1 15 (1.67%) Active Directory
2 13 (1.45%) VMware Infrastructure
3 11 (1.23%) Hyper-V
4 10 (1.12%) Docker
5 2 (0.22%) Firmware
5 2 (0.22%) Virtual Desktop
5 2 (0.22%) Virtual Machines
5 2 (0.22%) VMware ESXi
6 1 (0.11%) XenDesktop
Systems Management
1 12 (1.34%) Kubernetes
1 12 (1.34%) Microsoft Intune
2 6 (0.67%) Terraform
3 4 (0.45%) SCCM
4 3 (0.33%) WSUS
5 2 (0.22%) Ansible
5 2 (0.22%) Plesk
5 2 (0.22%) vCenter Server
6 1 (0.11%) Single Sign-On
Vendors
1 167 (18.64%) Microsoft
2 110 (12.28%) Adobe
3 43 (4.80%) Google
4 39 (4.35%) Apple
5 37 (4.13%) Dell
6 35 (3.91%) Samsung
7 32 (3.57%) HP
8 20 (2.23%) NEC
9 19 (2.12%) VMware
10 18 (2.01%) Intel
10 18 (2.01%) SAP
11 16 (1.79%) Salesforce
12 10 (1.12%) Atlassian
12 10 (1.12%) Xamarin
13 9 (1.00%) ServiceNow
14 8 (0.89%) Hotjar
14 8 (0.89%) WooCommerce
15 7 (0.78%) Facebook
16 5 (0.56%) Cisco
16 5 (0.56%) Twitter