SLA Jobs with Hybrid/Remote/WFH Options

Service Level Agreement (SLA)
UK > Work from Home

The table below provides summary statistics for permanent remote or hybrid work requiring SLA skills. It includes a benchmarking guide to the annual salaries offered in vacancies that cited SLA over the 6 months leading up to 1 May 2025, comparing them to the same period in the previous two years.

6 months to
1 May 2025
Same period 2024 Same period 2023
Rank 210 260 196
Rank change year-on-year +50 -64 +50
Permanent jobs citing SLA 207 405 747
As % of all permanent jobs with a WFH option 1.38% 1.20% 1.75%
As % of the Quality Assurance & Compliance category 7.58% 9.42% 11.86%
Number of salaries quoted 173 336 540
10th Percentile £28,500 £27,750 £25,000
25th Percentile £30,000 £32,750 £31,250
Median annual salary (50th Percentile) £42,000 £48,500 £45,000
Median % change year-on-year -13.40% +7.78% +5.88%
75th Percentile £58,750 £60,000 £67,500
90th Percentile £75,000 £70,000 £80,000
UK median annual salary £36,000 £32,500 £40,000
% change year-on-year +10.77% -18.75% +5.26%

All Quality Assurance and Compliance Skills
Work from Home

SLA falls under the Quality Assurance and Compliance category. For comparison with the information above, the following table provides summary statistics for all permanent job vacancies with remote or hybrid options requiring quality assurance or compliance skills.

Permanent vacancies with a requirement for quality assurance or compliance skills 2,731 4,300 6,301
As % of all permanent jobs with a WFH option 18.26% 12.71% 14.74%
Number of salaries quoted 1,721 3,268 4,262
10th Percentile £37,170 £34,675 £36,250
25th Percentile £47,500 £42,500 £46,250
Median annual salary (50th Percentile) £62,500 £57,500 £60,000
Median % change year-on-year +8.70% -4.17% +9.09%
75th Percentile £75,000 £73,750 £77,500
90th Percentile £93,778 £95,000 £92,500
UK median annual salary £60,000 £52,500 £57,500
% change year-on-year +14.29% -8.70% +4.55%

SLA
Trend for Jobs with a WFH Option

Job vacancies with remote working options citing SLA as a proportion of all IT jobs advertised.
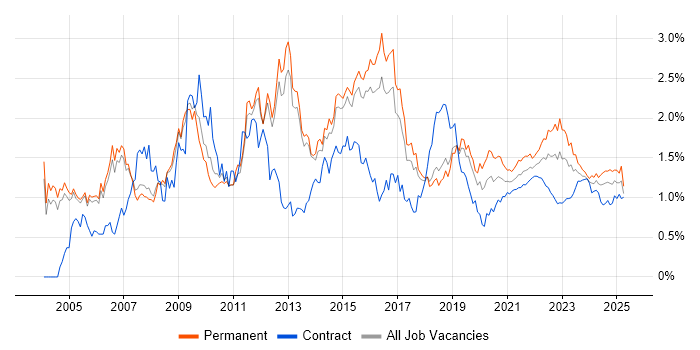
SLA trend for jobs with Hybrid/Remote/WFH options

SLA
Salary Trend for Jobs with a WFH Option

3-month moving average salary quoted in job vacancies with remote working options citing SLA.

SLA salary trend for jobs with a WFH option

SLA
Salary Histogram for Jobs with a WFH Option

Salary distribution for jobs with remote working options citing SLA over the 6 months to 1 May 2025.

SLA salary histogram for jobs with a WFH option

SLA
Co-occurring Skills and Capabilities with WFH Options by Category

The follow tables expand on the table above by listing co-occurrences grouped by category. The same employment type, locality and period is covered with up to 20 co-occurrences shown in each of the following categories:

Application Platforms
1 29 (14.01%) Microsoft Exchange
2 15 (7.25%) IIS
3 12 (5.80%) SharePoint
4 6 (2.90%) Confluence
5 3 (1.45%) Skype for Business
Applications
1 23 (11.11%) Microsoft Office
2 2 (0.97%) Microsoft Excel
3 1 (0.48%) 1Password
3 1 (0.48%) Weka
Business Applications
1 3 (1.45%) Remedy ITSM
2 2 (0.97%) Carpe Diem
2 2 (0.97%) Dynamics CRM
2 2 (0.97%) Dynamics NAV
2 2 (0.97%) Elite 3E
3 1 (0.48%) NetSuite
3 1 (0.48%) Sage 200
3 1 (0.48%) Shopify
Cloud Services
1 79 (38.16%) Microsoft 365
2 59 (28.50%) Azure
3 50 (24.15%) AWS
4 25 (12.08%) SaaS
5 12 (5.80%) IaaS
6 9 (4.35%) Cloud Computing
6 9 (4.35%) Entra ID
7 8 (3.86%) PaaS
7 8 (3.86%) Power Platform
8 6 (2.90%) OneDrive
9 5 (2.42%) Dynamics 365
10 4 (1.93%) PowerApps
11 3 (1.45%) Azure DevOps
11 3 (1.45%) Google Workspace
11 3 (1.45%) Power Automate
12 2 (0.97%) Azure Logic Apps
12 2 (0.97%) Azure Monitor
12 2 (0.97%) GitHub
13 1 (0.48%) Azure AKS
13 1 (0.48%) Rubrik
Communications & Networking
1 28 (13.53%) DNS
2 18 (8.70%) DHCP
3 16 (7.73%) TCP/IP
4 11 (5.31%) LAN
5 10 (4.83%) Remote Desktop
5 10 (4.83%) WAN
5 10 (4.83%) Wi-Fi
5 10 (4.83%) Wireless
6 8 (3.86%) Firewall
6 8 (3.86%) SAN
6 8 (3.86%) VPN
7 6 (2.90%) LoRaWAN
8 4 (1.93%) BGP
8 4 (1.93%) Cisco IOS
8 4 (1.93%) IPsec
8 4 (1.93%) Junos
8 4 (1.93%) MPLS
8 4 (1.93%) Unified Communications
8 4 (1.93%) VoIP
9 3 (1.45%) Skype
Database & Business Intelligence
1 21 (10.14%) SQL Server
2 2 (0.97%) Power BI
2 2 (0.97%) Tableau
3 1 (0.48%) Azure SQL Database
3 1 (0.48%) Crystal Reports
3 1 (0.48%) Elasticsearch
3 1 (0.48%) MySQL
3 1 (0.48%) PostgreSQL
Development Applications
1 18 (8.70%) JIRA
2 8 (3.86%) Jenkins
3 6 (2.90%) AppScan
3 6 (2.90%) Atlassian Bamboo
3 6 (2.90%) SonarQube
4 2 (0.97%) Visual Studio
5 1 (0.48%) Git
5 1 (0.48%) GitLab
5 1 (0.48%) Hudson
5 1 (0.48%) Subversion
General
1 68 (32.85%) Social Skills
2 60 (28.99%) Finance
3 29 (14.01%) Analytical Skills
4 14 (6.76%) Legal
5 10 (4.83%) Welsh Language
6 5 (2.42%) Games
6 5 (2.42%) Retail
7 4 (1.93%) Back Office
7 4 (1.93%) Banking
7 4 (1.93%) Law
7 4 (1.93%) Organisational Skills
8 3 (1.45%) Inclusion and Diversity
8 3 (1.45%) Public Sector
8 3 (1.45%) Telecoms
9 2 (0.97%) Marketing
9 2 (0.97%) Multimedia
9 2 (0.97%) Presentation Skills
10 1 (0.48%) Billing
10 1 (0.48%) Documentation Skills
10 1 (0.48%) Manufacturing
Job Titles
1 27 (13.04%) 2nd Line Support
2 26 (12.56%) Analyst
2 26 (12.56%) Desktop Support
3 19 (9.18%) Support Technician
4 18 (8.70%) Lead
4 18 (8.70%) Service Manager
5 17 (8.21%) IT Support
6 16 (7.73%) Desktop Support Technician
6 16 (7.73%) Desktop Technician
6 16 (7.73%) Senior
7 15 (7.25%) Support Engineer
8 12 (5.80%) Server Engineer
9 11 (5.31%) Administrator
9 11 (5.31%) Service Desk Manager
10 10 (4.83%) 2nd Line Desktop Support
10 10 (4.83%) Server Support
11 9 (4.35%) 1st Line Support
12 8 (3.86%) Business Analyst
13 7 (3.38%) Account Manager
13 7 (3.38%) Support Analyst
Libraries, Frameworks & Software Standards
1 17 (8.21%) .NET
2 4 (1.93%) HTML
3 2 (0.97%) AngularJS
3 2 (0.97%) React
3 2 (0.97%) SAML
4 1 (0.48%) .NET Core
4 1 (0.48%) ASP.NET
4 1 (0.48%) Elastic Stack
4 1 (0.48%) FreeMarker
4 1 (0.48%) Software Packaging
Miscellaneous
1 33 (15.94%) Management Information System
2 15 (7.25%) Client/Server
3 14 (6.76%) Data Centre
3 14 (6.76%) IoT
3 14 (6.76%) Private Cloud
4 13 (6.28%) Onboarding
5 10 (4.83%) CMDB
6 9 (4.35%) Clustering
6 9 (4.35%) Driving Licence
6 9 (4.35%) Self-Motivation
7 8 (3.86%) Hybrid Cloud
8 7 (3.38%) Social Media
9 6 (2.90%) NB-IoT
9 6 (2.90%) Smart City
9 6 (2.90%) Smart Meter
10 4 (1.93%) Legacy Systems
10 4 (1.93%) Mobile Games
10 4 (1.93%) Replication
10 4 (1.93%) Video Conferencing
11 3 (1.45%) Foreign Exchange (FX)
Operating Systems
1 79 (38.16%) Windows
2 50 (24.15%) Windows Server
3 23 (11.11%) Linux
4 16 (7.73%) Windows 10
5 12 (5.80%) Android
6 9 (4.35%) AIX
7 7 (3.38%) Red Hat Enterprise Linux
7 7 (3.38%) Unix
8 5 (2.42%) Windows Vista
9 4 (1.93%) Windows 7
9 4 (1.93%) Windows Server 2019
10 3 (1.45%) Windows Server 2012
10 3 (1.45%) Windows Server 2016
11 2 (0.97%) Mac OS
11 2 (0.97%) Mac OS X
11 2 (0.97%) Windows Server 2003
11 2 (0.97%) Windows Server 2008
Processes & Methodologies
1 97 (46.86%) ITIL
2 68 (32.85%) Customer Service
3 55 (26.57%) Problem-Solving
3 55 (26.57%) Service Management
4 42 (20.29%) Change Management
5 41 (19.81%) Problem Management
6 35 (16.91%) ITSM
7 29 (14.01%) Asset Management
8 25 (12.08%) Collaborative Working
9 21 (10.14%) Disaster Recovery
10 20 (9.66%) People Management
11 19 (9.18%) Continuous Improvement
12 18 (8.70%) DevOps
12 18 (8.70%) Incident Management
12 18 (8.70%) Process Improvement
13 17 (8.21%) Configuration Management
14 16 (7.73%) Project Management
15 15 (7.25%) Security Management
16 14 (6.76%) Information Security Management
16 14 (6.76%) Service Delivery
Programming Languages
1 11 (5.31%) PowerShell
1 11 (5.31%) SQL
2 9 (4.35%) Python
3 4 (1.93%) Shell Script
4 3 (1.45%) C#
4 3 (1.45%) JavaScript
4 3 (1.45%) PHP
5 2 (0.97%) Java
6 1 (0.48%) Bash
6 1 (0.48%) PL/SQL
Qualifications
1 26 (12.56%) ITIL Certification
2 25 (12.08%) Microsoft Certification
3 20 (9.66%) Degree
4 17 (8.21%) DBS Check
5 15 (7.25%) Cisco Certification
6 13 (6.28%) Azure Certification
7 12 (5.80%) AWS Certification
7 12 (5.80%) MCSA
8 9 (4.35%) MCITP
8 9 (4.35%) Network+ Certification
9 8 (3.86%) CCNA
9 8 (3.86%) MCSE
9 8 (3.86%) Security Cleared
10 7 (3.38%) IBM AIX Certification
11 6 (2.90%) CCNP
11 6 (2.90%) ITIL Foundation Certificate
12 4 (1.93%) JNCIS
12 4 (1.93%) SC Cleared
13 2 (0.97%) CWTS
13 2 (0.97%) DV Cleared
Quality Assurance & Compliance
1 4 (1.93%) Accessibility
2 2 (0.97%) QA
3 1 (0.48%) GDPR
System Software
1 67 (32.37%) Active Directory
2 22 (10.63%) VMware Infrastructure
3 9 (4.35%) Virtual Desktop
4 8 (3.86%) Hyper-V
5 4 (1.93%) Veritas Cluster Server
6 3 (1.45%) Docker
6 3 (1.45%) VMware ESXi
7 2 (0.97%) Virtual Servers
8 1 (0.48%) VMware Server
8 1 (0.48%) vSphere
Systems Management
1 18 (8.70%) SCCM
2 17 (8.21%) Microsoft Intune
3 10 (4.83%) Ansible
4 9 (4.35%) Progress Chef
4 9 (4.35%) Puppet
5 6 (2.90%) Opsgenie
6 5 (2.42%) AirWatch
6 5 (2.42%) Single Sign-On
7 4 (1.93%) Active Directory Federation Services
7 4 (1.93%) Kubernetes
8 3 (1.45%) Jamf Pro
9 2 (0.97%) SCOM
9 2 (0.97%) SCOrch
9 2 (0.97%) SCSM
10 1 (0.48%) Failover Clustering
10 1 (0.48%) Kibana
10 1 (0.48%) logstash
10 1 (0.48%) NetBackup
10 1 (0.48%) Norton AntiVirus
10 1 (0.48%) Tivoli Storage Manager
Vendors
1 85 (41.06%) Microsoft
2 24 (11.59%) VMware
3 19 (9.18%) Cisco
4 16 (7.73%) Apple
5 15 (7.25%) Oracle
6 12 (5.80%) Atlassian
7 11 (5.31%) Citrix
8 8 (3.86%) ServiceNow
9 7 (3.38%) Red Hat
9 7 (3.38%) Symantec
10 4 (1.93%) Juniper
10 4 (1.93%) Veritas
11 3 (1.45%) EMC
11 3 (1.45%) Remedy
11 3 (1.45%) SaltStack
11 3 (1.45%) Veeam
12 2 (0.97%) DocuSign
12 2 (0.97%) Freshdesk
12 2 (0.97%) iManage
12 2 (0.97%) Intapp