Full-Stack Development Jobs with Hybrid/Remote/WFH Options

Full-Stack Development
UK > Work from Home

The table below provides summary statistics for permanent remote or hybrid work requiring Full-Stack Development skills. It includes a benchmarking guide to the annual salaries offered in vacancies that cited Full-Stack Development over the 6 months leading up to 16 July 2025, comparing them to the same period in the previous two years.

6 months to
16 Jul 2025
Same period 2024 Same period 2023
Rank 94 46 55
Rank change year-on-year -48 +9 -26
Permanent jobs citing Full-Stack Development 767 1,696 1,755
As % of all permanent jobs with a WFH option 3.64% 5.18% 5.05%
As % of the Processes & Methodologies category 3.92% 5.82% 5.26%
Number of salaries quoted 441 1,458 1,526
10th Percentile £42,500 £40,000 £42,500
25th Percentile £52,500 £45,000 £52,500
Median annual salary (50th Percentile) £66,100 £60,000 £67,500
Median % change year-on-year +10.17% -11.11% +8.00%
75th Percentile £93,778 £77,500 £86,250
90th Percentile £136,250 £90,375 £112,500
UK median annual salary £70,000 £60,000 £70,000
% change year-on-year +16.67% -14.29% +12.00%

All Process and Methodology Skills
Work from Home

Full-Stack Development falls under the Processes and Methodologies category. For comparison with the information above, the following table provides summary statistics for all permanent job vacancies with remote or hybrid options requiring process or methodology skills.

Permanent vacancies with a requirement for process or methodology skills 19,574 29,160 33,339
As % of all permanent jobs with a WFH option 92.88% 89.07% 95.93%
Number of salaries quoted 10,359 21,452 24,510
10th Percentile £25,313 £33,750 £37,500
25th Percentile £39,000 £42,500 £47,500
Median annual salary (50th Percentile) £57,500 £57,500 £62,500
Median % change year-on-year - -8.00% +4.17%
75th Percentile £76,250 £75,772 £81,250
90th Percentile £100,000 £95,000 £100,000
UK median annual salary £55,000 £55,000 £60,249
% change year-on-year - -8.71% +0.42%

Full-Stack Development
Trend for Jobs with a WFH Option

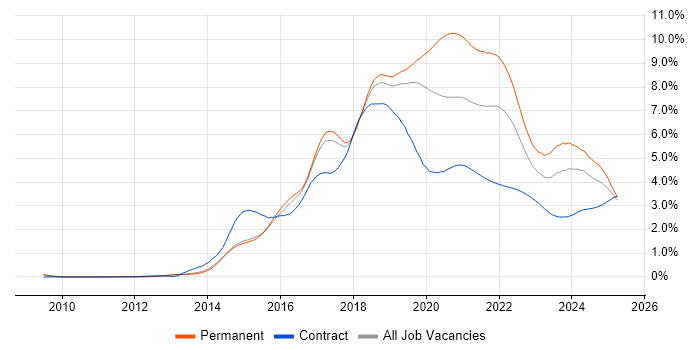
Job vacancies with remote working options citing Full-Stack Development as a proportion of all IT jobs advertised.

Full-Stack Development trend for jobs with Hybrid/Remote/WFH options

Full-Stack Development
Salary Trend for Jobs with a WFH Option

3-month moving average salary quoted in job vacancies with remote working options citing Full-Stack Development.

Full-Stack Development salary trend for jobs with a WFH option

Full-Stack Development
Salary Histogram for Jobs with a WFH Option

Salary distribution for jobs with remote working options citing Full-Stack Development over the 6 months to 16 July 2025.

Full-Stack Development salary histogram for jobs with a WFH option

Full-Stack Development
Co-occurring Skills and Capabilities with WFH Options by Category

The follow tables expand on the table above by listing co-occurrences grouped by category. The same employment type, locality and period is covered with up to 20 co-occurrences shown in each of the following categories:

Application Platforms
1 163 (21.25%) Confluence
2 25 (3.26%) IIS
3 13 (1.69%) Microsoft Exchange
4 12 (1.56%) CMS
5 9 (1.17%) Headless CMS
6 5 (0.65%) WordPress
7 3 (0.39%) SharePoint
7 3 (0.39%) Umbraco
8 2 (0.26%) nginx
9 1 (0.13%) Apache
9 1 (0.13%) Apache Spark
9 1 (0.13%) Drupal
9 1 (0.13%) MetaMask
Applications
1 6 (0.78%) Chatbot
2 2 (0.26%) Photoshop
3 1 (0.13%) Microsoft Office
Business Applications
1 14 (1.83%) Shopify
2 7 (0.91%) Payment Gateway
3 6 (0.78%) Magento
4 1 (0.13%) Dynamics CRM
4 1 (0.13%) Salesforce CRM
Cloud Services
1 465 (60.63%) AWS
2 426 (55.54%) Azure
3 216 (28.16%) GCP
4 60 (7.82%) SaaS
5 44 (5.74%) Serverless
6 29 (3.78%) GitHub
7 27 (3.52%) AWS Lambda
8 22 (2.87%) Azure DevOps
9 19 (2.48%) Figma
10 17 (2.22%) Azure Service Bus
11 15 (1.96%) npm
12 12 (1.56%) Amazon S3
12 12 (1.56%) Vercel
13 9 (1.17%) Amazon ECS
13 9 (1.17%) Cloudflare
14 8 (1.04%) Amazon SQS
14 8 (1.04%) Azure Cosmos DB
14 8 (1.04%) Google Analytics
14 8 (1.04%) Power Platform
15 7 (0.91%) Azure Functions
Communications & Networking
1 13 (1.69%) Internet
2 4 (0.52%) Broadband
3 1 (0.13%) FTP
3 1 (0.13%) Unified Communications
3 1 (0.13%) WAN
Database & Business Intelligence
1 328 (42.76%) SQL Server
2 63 (8.21%) MongoDB
3 55 (7.17%) MySQL
4 43 (5.61%) Azure SQL Database
5 31 (4.04%) Elasticsearch
6 30 (3.91%) PostgreSQL
7 29 (3.78%) NoSQL
8 21 (2.74%) Redis
9 18 (2.35%) DynamoDB
10 13 (1.69%) Data Hub
10 13 (1.69%) SQL CLR
11 12 (1.56%) Relational Database
12 8 (1.04%) NonStop SQL
13 7 (0.91%) Power BI
14 4 (0.52%) Hazelcast
15 3 (0.39%) BigQuery
15 3 (0.39%) SQL Server Integration Services
15 3 (0.39%) SQL Server Reporting Services
16 2 (0.26%) Big Data
16 2 (0.26%) Data Warehouse
Development Applications
1 267 (34.81%) JIRA
2 258 (33.64%) Cucumber
2 258 (33.64%) Sonatype Nexus
3 255 (33.25%) GitLab
3 255 (33.25%) Maven
4 251 (32.72%) SonarQube
5 248 (32.33%) Bitbucket
5 248 (32.33%) Selenium
6 87 (11.34%) Git
7 29 (3.78%) Cypress.io
8 22 (2.87%) webpack
9 16 (2.09%) Visual Studio
10 12 (1.56%) TeamCity
11 11 (1.43%) Jenkins
12 9 (1.17%) NUnit
13 8 (1.04%) Jasmine
14 5 (0.65%) PHPUnit
14 5 (0.65%) Team Foundation Server
15 3 (0.39%) Mocha
15 3 (0.39%) Octopus Deploy
General
1 384 (50.07%) Finance
2 283 (36.90%) Banking
3 252 (32.86%) Inclusion and Diversity
4 119 (15.51%) Retail
5 90 (11.73%) Corporate Banking
5 90 (11.73%) Investment Banking
6 76 (9.91%) Social Skills
7 49 (6.39%) Front Office
8 14 (1.83%) Back Office
9 13 (1.69%) Analytical Skills
9 13 (1.69%) Games
10 12 (1.56%) Law
10 12 (1.56%) Marketing
11 9 (1.17%) Advertising
12 7 (0.91%) Health Technology
13 5 (0.65%) Organisational Skills
13 5 (0.65%) Public Sector
14 4 (0.52%) Digital Healthcare
14 4 (0.52%) Tech for Good
14 4 (0.52%) Telecoms
Job Titles
1 350 (45.63%) Developer
2 343 (44.72%) Software Engineer
3 215 (28.03%) Full-Stack Developer
4 124 (16.17%) Senior
5 91 (11.86%) Full-Stack Engineer
6 81 (10.56%) Senior Developer
7 77 (10.04%) .NET Developer
7 77 (10.04%) Lead
8 51 (6.65%) Senior Full-Stack Developer
9 46 (6.00%) Lead Developer
10 42 (5.48%) Full-Stack Software Engineer
11 40 (5.22%) C# Developer
12 37 (4.82%) Developer/Software Engineer
13 36 (4.69%) Software Developer
14 28 (3.65%) Senior Full-Stack Engineer
15 27 (3.52%) Full-Stack C# Developer
16 26 (3.39%) Full-Stack .NET Developer
17 22 (2.87%) Lead Full-Stack Developer
18 21 (2.74%) Lead Software Developer
19 20 (2.61%) Java Developer
Libraries, Frameworks & Software Standards
1 523 (68.19%) React
2 378 (49.28%) HTML
3 360 (46.94%) CSS
4 294 (38.33%) Redux
5 283 (36.90%) Kafka
6 282 (36.77%) Spring Boot
7 271 (35.33%) Spring
8 248 (32.33%) JPA
9 201 (26.21%) .NET
10 185 (24.12%) RESTful
11 158 (20.60%) Hibernate
12 152 (19.82%) AngularJS
13 137 (17.86%) Node.js
14 134 (17.47%) HTML5
15 128 (16.69%) Jest
16 120 (15.65%) CSS3
17 117 (15.25%) REST
18 108 (14.08%) .NET Core
19 96 (12.52%) Sass
20 95 (12.39%) Vue
Miscellaneous
1 274 (35.72%) Product Ownership
2 255 (33.25%) Enterprise Software
3 35 (4.56%) Fixed Income
4 30 (3.91%) Cloud Native
5 23 (3.00%) Hedge funds
5 23 (3.00%) Team-Oriented Environment
6 21 (2.74%) Greenfield Project
7 20 (2.61%) Mobile App
8 14 (1.83%) Algorithms
8 14 (1.83%) Equities
8 14 (1.83%) Private Cloud
8 14 (1.83%) Public Cloud
9 12 (1.56%) Distributed Systems
10 11 (1.43%) Foreign Exchange (FX)
10 11 (1.43%) Legacy Systems
10 11 (1.43%) Virtual Team
11 8 (1.04%) Derivative
11 8 (1.04%) Online Banking
12 7 (0.91%) Data Structures
13 6 (0.78%) IoT
Operating Systems
1 14 (1.83%) Windows
2 13 (1.69%) Windows Server
3 12 (1.56%) Linux
4 10 (1.30%) Android
5 4 (0.52%) Unix
6 3 (0.39%) Apple iOS
7 1 (0.13%) Robot Operating System
Processes & Methodologies
1 480 (62.58%) Agile
2 439 (57.24%) Software Engineering
3 360 (46.94%) Microservices
4 351 (45.76%) CI/CD
5 339 (44.20%) DevOps
6 310 (40.42%) Test Automation
7 285 (37.16%) Containerisation
8 281 (36.64%) Front End Development
9 271 (35.33%) SDLC
10 258 (33.64%) Performance Optimisation
11 254 (33.12%) TDD
12 227 (29.60%) Clean Code
13 186 (24.25%) Continuous Improvement
14 166 (21.64%) User Experience
15 138 (17.99%) Mentoring
16 96 (12.52%) Responsive Web Design
17 94 (12.26%) Migration
18 90 (11.73%) Problem-Solving
18 90 (11.73%) Strategic Thinking
19 76 (9.91%) MVC
Programming Languages
1 535 (69.75%) JavaScript
2 388 (50.59%) SQL
3 336 (43.81%) Java
4 316 (41.20%) TypeScript
5 207 (26.99%) C#
6 108 (14.08%) Python
7 34 (4.43%) PHP
8 20 (2.61%) Go
9 14 (1.83%) C++
10 11 (1.43%) VB.NET
11 8 (1.04%) Kotlin
12 7 (0.91%) PowerShell
13 6 (0.78%) C
14 5 (0.65%) Delphi
15 4 (0.52%) Rust
16 3 (0.39%) R
16 3 (0.39%) Ruby
17 2 (0.26%) Groovy
17 2 (0.26%) MATLAB
17 2 (0.26%) T-SQL
Qualifications
1 52 (6.78%) Degree
2 16 (2.09%) Computer Science Degree
3 7 (0.91%) Numerate Degree
3 7 (0.91%) Security Cleared
4 5 (0.65%) SC Cleared
5 3 (0.39%) DV Cleared
5 3 (0.39%) Master's Degree
6 1 (0.13%) BC Cleared
6 1 (0.13%) DBS Check
6 1 (0.13%) Microsoft Certification
6 1 (0.13%) PhD
Quality Assurance & Compliance
1 268 (34.94%) QA
2 110 (14.34%) Accessibility
3 3 (0.39%) GDPR
4 2 (0.26%) ISO/IEC 27001
4 2 (0.26%) WCAG
5 1 (0.13%) MiFID
System Software
1 325 (42.37%) Docker
2 13 (1.69%) VMware Infrastructure
3 1 (0.13%) Active Directory
3 1 (0.13%) Virtual Machines
Systems Management
1 297 (38.72%) Kubernetes
2 31 (4.04%) Terraform
3 4 (0.52%) Argo
4 2 (0.26%) Grafana
4 2 (0.26%) HAProxy
4 2 (0.26%) Prometheus
5 1 (0.13%) Ansible
Vendors
1 247 (32.20%) Solace
2 105 (13.69%) Microsoft
3 13 (1.69%) VMware
4 9 (1.17%) Databricks
4 9 (1.17%) DevExpress
4 9 (1.17%) Rollbar
5 8 (1.04%) Apple
6 6 (0.78%) Facebook
6 6 (0.78%) PayPal
6 6 (0.78%) YouTube
7 5 (0.65%) Salesforce
8 4 (0.52%) Google
8 4 (0.52%) Telerik
9 3 (0.39%) Oracle
9 3 (0.39%) Ping Identity
9 3 (0.39%) SAP
10 2 (0.26%) Adobe
10 2 (0.26%) HubSpot
10 2 (0.26%) Sun
10 2 (0.26%) WooCommerce