Docker Jobs with Hybrid/Remote/WFH Options

Docker
UK > Work from Home

The table below provides summary statistics for permanent remote or hybrid work requiring Docker skills. It includes a benchmarking guide to the annual salaries offered in vacancies that cited Docker over the 6 months leading up to 19 March 2025, comparing them to the same period in the previous two years.

6 months to
19 Mar 2025
Same period 2024 Same period 2023
Rank 35 53 30
Rank change year-on-year +18 -23 -10
Permanent jobs citing Docker 1,134 1,625 3,889
As % of all permanent jobs with a WFH option 7.36% 5.14% 8.31%
As % of the System Software category 51.06% 37.34% 53.11%
Number of salaries quoted 737 1,327 2,475
10th Percentile £50,000 £43,750 £46,000
25th Percentile £57,500 £53,750 £55,000
Median annual salary (50th Percentile) £75,000 £70,000 £70,000
Median % change year-on-year +7.14% - -
75th Percentile £102,410 £83,750 £90,000
90th Percentile £138,750 £97,500 £105,000
UK median annual salary £75,000 £70,000 £72,500
% change year-on-year +7.14% -3.45% -

All System Software Skills
Work from Home

Docker falls under the System Software category. For comparison with the information above, the following table provides summary statistics for all permanent job vacancies with remote or hybrid options requiring system software skills.

Permanent vacancies with a requirement for system software skills 2,221 4,352 7,322
As % of all permanent jobs with a WFH option 14.42% 13.76% 15.65%
Number of salaries quoted 1,555 3,662 5,232
10th Percentile £31,250 £31,250 £31,250
25th Percentile £43,750 £41,250 £42,500
Median annual salary (50th Percentile) £60,000 £55,000 £60,000
Median % change year-on-year +9.09% -8.33% -4.00%
75th Percentile £83,750 £72,500 £80,000
90th Percentile £115,000 £86,250 £95,000
UK median annual salary £57,500 £50,000 £55,000
% change year-on-year +15.00% -9.09% -1.79%

Docker
Trend for Jobs with a WFH Option

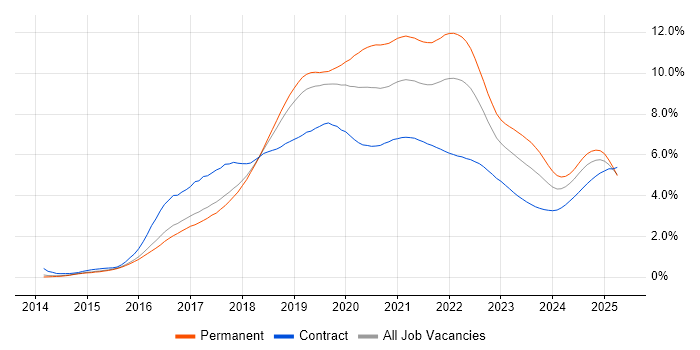
Job vacancies with remote working options citing Docker as a proportion of all IT jobs advertised.

Docker trend for jobs with Hybrid/Remote/WFH options

Docker
Salary Trend for Jobs with a WFH Option

3-month moving average salary quoted in job vacancies with remote working options citing Docker.

Docker salary trend for jobs with a WFH option

Docker
Salary Histogram for Jobs with a WFH Option

Salary distribution for jobs with remote working options citing Docker over the 6 months to 19 March 2025.

Docker salary histogram for jobs with a WFH option

Docker
Co-occurring Skills and Capabilities with WFH Options by Category

The follow tables expand on the table above by listing co-occurrences grouped by category. The same employment type, locality and period is covered with up to 20 co-occurrences shown in each of the following categories:

Application Platforms
1 88 (7.76%) Apache Airflow
2 85 (7.50%) Apache
2 85 (7.50%) Apache Spark
3 51 (4.50%) Confluence
4 26 (2.29%) Jupyter
5 18 (1.59%) CMS
6 15 (1.32%) nginx
7 10 (0.88%) Microsoft Exchange
8 7 (0.62%) SharePoint
9 6 (0.53%) IIS
10 5 (0.44%) Apache Solr
11 2 (0.18%) OpenStack
11 2 (0.18%) Tomcat
11 2 (0.18%) WordPress
12 1 (0.088%) CICS
12 1 (0.088%) Drupal
Applications
1 7 (0.62%) Microsoft Excel
2 1 (0.088%) EngageOne
Business Applications
1 1 (0.088%) Oracle Payables
1 1 (0.088%) TIBCO iProcess
Cloud Services
1 709 (62.52%) AWS
2 411 (36.24%) Serverless
3 382 (33.69%) Azure
4 373 (32.89%) AWS Lambda
5 324 (28.57%) GitHub
6 301 (26.54%) Amazon S3
7 273 (24.07%) Amazon SQS
8 235 (20.72%) Amazon Kinesis
9 218 (19.22%) GCP
10 151 (13.32%) Amazon ECS
11 120 (10.58%) Azure DevOps
12 100 (8.82%) dbt
13 85 (7.50%) AWS CloudFormation
13 85 (7.50%) SaaS
14 83 (7.32%) OpenShift
15 62 (5.47%) Amazon EC2
16 52 (4.59%) GitHub Actions
17 41 (3.62%) PaaS
18 40 (3.53%) Cloud Computing
19 39 (3.44%) Azure Service Bus
Communications & Networking
1 33 (2.91%) TCP/IP
2 30 (2.65%) Broadband
3 29 (2.56%) Internet
4 25 (2.20%) Firewall
5 21 (1.85%) DNS
6 14 (1.23%) Network Security
7 12 (1.06%) DHCP
8 9 (0.79%) HTTP
8 9 (0.79%) SSL
9 6 (0.53%) VLAN
10 4 (0.35%) 5G
10 4 (0.35%) VPN
11 3 (0.26%) HTTPS
11 3 (0.26%) SMTP
11 3 (0.26%) VSAN
12 1 (0.088%) IPv4
12 1 (0.088%) LAN
12 1 (0.088%) OSPF
12 1 (0.088%) SAN
12 1 (0.088%) WLAN
Database & Business Intelligence
1 369 (32.54%) PostgreSQL
2 291 (25.66%) Redis
3 245 (21.60%) DynamoDB
4 91 (8.02%) NoSQL
5 76 (6.70%) Amazon RDS
6 72 (6.35%) Amazon Athena
7 71 (6.26%) Apache Arrow
7 71 (6.26%) Apache Iceberg
7 71 (6.26%) Apache Ignite
7 71 (6.26%) Dremio
8 68 (6.00%) Elasticsearch
9 66 (5.82%) MySQL
10 53 (4.67%) SQL Server
11 44 (3.88%) Big Data
12 43 (3.79%) MongoDB
13 42 (3.70%) Amazon Redshift
14 35 (3.09%) Relational Database
15 17 (1.50%) BigQuery
15 17 (1.50%) Data Warehouse
16 16 (1.41%) Power BI
Development Applications
1 317 (27.95%) Jenkins
2 204 (17.99%) Git
3 73 (6.44%) Artifactory
4 68 (6.00%) JIRA
5 58 (5.11%) SonarQube
6 42 (3.70%) GitLab
7 33 (2.91%) Octopus Deploy
8 32 (2.82%) webpack
9 31 (2.73%) JUnit
10 28 (2.47%) Sonatype Nexus
11 27 (2.38%) Visual Studio
12 25 (2.20%) MSBuild
12 25 (2.20%) Team Foundation Server
13 23 (2.03%) Jasmine
13 23 (2.03%) Karma Test Runner
13 23 (2.03%) Mockito
13 23 (2.03%) Protractor
14 22 (1.94%) Eclipse
14 22 (1.94%) IntelliJ
14 22 (1.94%) Maven
General
1 316 (27.87%) Finance
2 297 (26.19%) Inclusion and Diversity
3 245 (21.60%) Social Skills
4 242 (21.34%) Marketing
5 238 (20.99%) Advertising
6 175 (15.43%) Banking
7 121 (10.67%) Front Office
8 46 (4.06%) Analytical Skills
9 40 (3.53%) Retail
10 39 (3.44%) Public Sector
11 16 (1.41%) Games
12 13 (1.15%) Law
13 11 (0.97%) Automotive
14 10 (0.88%) Presentation Skills
15 9 (0.79%) Legal
16 7 (0.62%) Investment Banking
16 7 (0.62%) Pharmaceutical
17 6 (0.53%) Back Office
18 5 (0.44%) Telecoms
19 3 (0.26%) Manufacturing
Job Titles
1 341 (30.07%) Software Engineer
2 242 (21.34%) Developer
3 229 (20.19%) Senior
4 198 (17.46%) DevOps Engineer
5 152 (13.40%) Python Engineer
6 123 (10.85%) AWS Engineer
7 122 (10.76%) AWS DevOps
8 119 (10.49%) AWS DevOps Engineer
9 117 (10.32%) Lead
10 96 (8.47%) Data Engineer
11 68 (6.00%) Senior Developer
12 62 (5.47%) Architect
13 45 (3.97%) Java Developer
14 41 (3.62%) Finance Manager
15 40 (3.53%) Senior DevOps
16 39 (3.44%) DevOps Manager
16 39 (3.44%) Senior Software Engineer
17 37 (3.26%) Platform Engineer
17 37 (3.26%) Senior DevOps Engineer
18 35 (3.09%) Backend Developer
Libraries, Frameworks & Software Standards
1 379 (33.42%) React
2 332 (29.28%) REST
3 316 (27.87%) AngularJS
4 294 (25.93%) Node.js
5 235 (20.72%) Tailwind CSS
6 150 (13.23%) Kafka
7 132 (11.64%) .NET
8 75 (6.61%) PySpark
9 74 (6.53%) HTML
10 73 (6.44%) Elastic Stack
10 73 (6.44%) RESTful
11 72 (6.35%) J2EE
12 61 (5.38%) CSS
13 60 (5.29%) Spring
14 59 (5.20%) RabbitMQ
15 58 (5.11%) Django
16 57 (5.03%) Spring Boot
17 56 (4.94%) ASP.NET
18 46 (4.06%) OAuth
19 45 (3.97%) Flask
Miscellaneous
1 233 (20.55%) Blog
1 233 (20.55%) Digital Media
2 69 (6.08%) Algorithms
3 65 (5.73%) Cloud Native
4 48 (4.23%) Private Cloud
5 45 (3.97%) Distributed Systems
6 42 (3.70%) Management Information System
7 40 (3.53%) Product Ownership
8 33 (2.91%) Onboarding
9 23 (2.03%) Cyberattack
10 17 (1.50%) Legacy Code
10 17 (1.50%) Linux Command Line
11 15 (1.32%) Legacy Systems
11 15 (1.32%) Mobile App
12 13 (1.15%) Greenfield Project
12 13 (1.15%) Public Cloud
13 12 (1.06%) Virtual Team
14 9 (0.79%) Self-Motivation
15 8 (0.71%) Data Structures
15 8 (0.71%) IoT
Operating Systems
1 188 (16.58%) Linux
2 49 (4.32%) Windows
3 40 (3.53%) Unix
4 19 (1.68%) Windows Server
5 14 (1.23%) Android
6 9 (0.79%) Ubuntu
7 6 (0.53%) Debian
7 6 (0.53%) Red Hat Enterprise Linux
8 5 (0.44%) CentOS
9 4 (0.35%) Windows Server 2016
10 3 (0.26%) Windows 10
10 3 (0.26%) Windows Server 2012
10 3 (0.26%) Windows Server 2019
11 2 (0.18%) Apple iOS
11 2 (0.18%) CoreOS
11 2 (0.18%) Solaris
11 2 (0.18%) zOS
12 1 (0.088%) Mac OS
12 1 (0.088%) Oracle Linux
12 1 (0.088%) VMS
Processes & Methodologies
1 630 (55.56%) Agile
2 596 (52.56%) Software Engineering
3 551 (48.59%) DevOps
4 462 (40.74%) CI/CD
5 358 (31.57%) Containerisation
6 312 (27.51%) Full-Stack Development
7 297 (26.19%) Microservices
8 294 (25.93%) Continuous Delivery
9 277 (24.43%) Scrum
10 251 (22.13%) User Experience
11 240 (21.16%) E-Commerce
12 233 (20.55%) Epics
13 205 (18.08%) Mentoring
14 192 (16.93%) Problem-Solving
15 177 (15.61%) Site Reliability Engineering
16 119 (10.49%) Infrastructure as Code
17 112 (9.88%) Asset Management
18 111 (9.79%) Test Automation
19 108 (9.52%) Computer Science
19 108 (9.52%) Open Source
Programming Languages
1 451 (39.77%) Python
2 313 (27.60%) TypeScript
3 278 (24.51%) Java
4 229 (20.19%) JavaScript
5 222 (19.58%) SQL
6 132 (11.64%) C#
7 121 (10.67%) Go
8 87 (7.67%) Bash
9 53 (4.67%) PowerShell
10 41 (3.62%) PHP
11 26 (2.29%) Shell Script
12 21 (1.85%) Rust
13 20 (1.76%) C++
14 15 (1.32%) Kotlin
14 15 (1.32%) Ruby
15 14 (1.23%) Bicep
16 12 (1.06%) C
16 12 (1.06%) Perl
17 11 (0.97%) Scala
18 9 (0.79%) T-SQL
Qualifications
1 136 (11.99%) Degree
2 127 (11.20%) Security Cleared
3 95 (8.38%) Computer Science Degree
4 55 (4.85%) SC Cleared
5 44 (3.88%) Master's Degree
6 37 (3.26%) DV Cleared
7 31 (2.73%) AWS Certification
8 29 (2.56%) BPSS Clearance
9 24 (2.12%) AWS Certified Solutions Architect
9 24 (2.12%) LPIC
9 24 (2.12%) RHCSA
10 22 (1.94%) Azure Certification
11 7 (0.62%) Microsoft Certification
12 4 (0.35%) PhD
13 3 (0.26%) Linux+ Certification
13 3 (0.26%) Numerate Degree
13 3 (0.26%) OCP
13 3 (0.26%) Oracle Certification
13 3 (0.26%) RHCE
14 2 (0.18%) VMware Certified Professional (VCP)
Quality Assurance & Compliance
1 44 (3.88%) GDPR
2 32 (2.82%) QA
3 29 (2.56%) NIST
4 25 (2.20%) SOC 2
5 16 (1.41%) HIPAA
6 14 (1.23%) NCSC
7 10 (0.88%) Accessibility
8 7 (0.62%) Data Quality
9 4 (0.35%) CDISC
10 2 (0.18%) ISO/IEC 27001
10 2 (0.18%) SLA
11 1 (0.088%) Actionable Recommendations
11 1 (0.088%) Basel III
11 1 (0.088%) Cyber Essentials
11 1 (0.088%) GMP
11 1 (0.088%) IFRS
11 1 (0.088%) IFRS 9
11 1 (0.088%) ISO/IEC 27005
11 1 (0.088%) NIST 800
System Software
1 27 (2.38%) Active Directory
2 10 (0.88%) Virtual Machines
3 9 (0.79%) Hyper-V
3 9 (0.79%) VMware Infrastructure
4 3 (0.26%) Dovecot
4 3 (0.26%) Microsoft Virtual Server
4 3 (0.26%) Postfix
4 3 (0.26%) Virtual Servers
4 3 (0.26%) VMware ESXi
4 3 (0.26%) VMware NSX
5 1 (0.088%) LXC
5 1 (0.088%) Samba
Systems Management
1 833 (73.46%) Kubernetes
2 356 (31.39%) Terraform
3 107 (9.44%) Ansible
4 79 (6.97%) Prometheus
5 66 (5.82%) Grafana
6 25 (2.20%) AWS Copilot
7 13 (1.15%) Argo
8 10 (0.88%) Istio
9 9 (0.79%) Nagios
10 8 (0.71%) Puppet
11 7 (0.62%) Kibana
11 7 (0.62%) Microsoft Intune
12 6 (0.53%) Progress Chef
13 5 (0.44%) Active Directory Federation Services
13 5 (0.44%) Failover Clustering
13 5 (0.44%) logstash
14 4 (0.35%) Packer
14 4 (0.35%) Rundeck
15 3 (0.26%) SCCM
15 3 (0.26%) vCenter Server
Vendors
1 105 (9.26%) Google
2 82 (7.23%) Microsoft
3 29 (2.56%) IBM
4 24 (2.12%) Databricks
5 19 (1.68%) VMware
6 17 (1.50%) Oracle
6 17 (1.50%) Splunk
7 9 (0.79%) New Relic
7 9 (0.79%) Red Hat
8 6 (0.53%) Dynatrace
9 5 (0.44%) Atlassian
10 4 (0.35%) IBM Sterling
10 4 (0.35%) Okta
10 4 (0.35%) ServiceNow
11 3 (0.26%) Citrix
11 3 (0.26%) Dell
11 3 (0.26%) Ping Identity
12 2 (0.18%) Bloomberg
12 2 (0.18%) Commvault
12 2 (0.18%) Teradata