Hybrid/Remote JavaScript Job Trends

JavaScript (including ECMAScript)
UK > Work from Home

The table below provides summary statistics and salary benchmarking for remote or hybrid work requiring JavaScript skills. It covers permanent job vacancies from the 6 months leading up to 28 November 2025, with comparisons to the same periods in the previous two years.

6 months to
28 Nov 2025
Same period 2024 Same period 2023
Rank 34 14 15
Rank change year-on-year -20 +1 -6
Permanent jobs citing JavaScript 920 2,475 2,455
As % of all permanent jobs with remote/hybrid work options 6.02% 12.47% 11.75%
As % of the Programming Languages category 21.87% 29.65% 25.01%
Number of salaries quoted 800 1,690 2,192
10th Percentile £37,500 £36,250 £40,000
25th Percentile £48,750 £47,500 £48,750
Median annual salary (50th Percentile) £62,500 £72,000 £62,500
Median % change year-on-year -13.19% +15.20% +4.17%
75th Percentile £85,000 £97,500 £81,250
90th Percentile £135,000 £140,000 £100,000
UK median annual salary £60,000 £65,000 £65,000
% change year-on-year -7.69% - +4.00%

All Programming Languages
Work from Home

JavaScript falls under the Programming Languages category. For comparison with the information above, the following table provides summary statistics for all permanent job vacancies with remote or hybrid options requiring coding skills.

Permanent vacancies with a requirement for coding skills 4,207 8,348 9,817
As % of all permanent jobs with a WFH option 27.53% 42.06% 46.98%
Number of salaries quoted 3,271 5,360 8,307
10th Percentile £35,000 £38,750 £40,000
25th Percentile £46,250 £47,500 £48,750
Median annual salary (50th Percentile) £62,500 £65,000 £65,000
Median % change year-on-year -3.85% - +2.36%
75th Percentile £82,500 £85,000 £83,750
90th Percentile £112,500 £112,500 £100,000
UK median annual salary £62,500 £65,000 £65,000
% change year-on-year -3.85% - -

JavaScript
Job Vacancy Trend for Remote/Hybrid Jobs

Historical trend showing the proportion of permanent IT job postings citing JavaScript and offering remote or hybrid work options relative to all permanent IT jobs advertised.
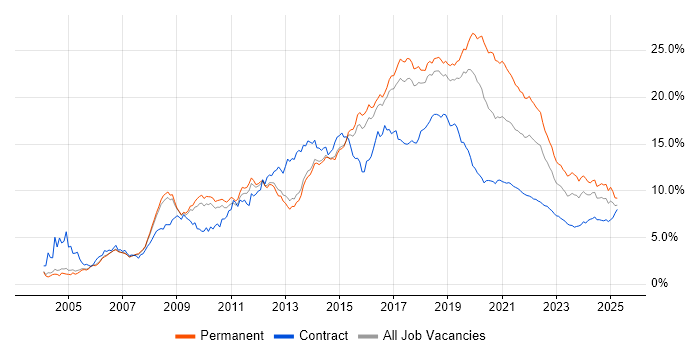
JavaScript job vacancy trend for remote/hybrid jobs

JavaScript
Salary Trend for Remote/Hybrid Jobs

Salary distribution trend for jobs with remote/hybrid work options citing JavaScript.

Salary distribution trend for jobs with remote/hybrid work options citing JavaScript

JavaScript
Salary Histogram for Remote/Hybrid Jobs

Salary distribution for jobs with remote/hybrid work options citing JavaScript over the 6 months to 28 November 2025.

JavaScript salary histogram for jobs with remote/hybrid work options

JavaScript
Co-Occurring Skills & Capabilities in Remote/Hybrid Jobs by Category

The following tables expand on the one above by listing co-occurrences grouped by category. They cover the same employment type, locality and period, with up to 20 co-occurrences shown in each category:

Application Platforms
1 107 (11.63%) Apache Airflow
2 57 (6.20%) Apache
3 34 (3.70%) CMS
4 31 (3.37%) SharePoint
5 17 (1.85%) WordPress
6 14 (1.52%) Apache Solr
7 11 (1.20%) Headless CMS
8 10 (1.09%) IIS
9 9 (0.98%) Confluence
10 6 (0.65%) Drupal
11 5 (0.54%) Anypoint
11 5 (0.54%) Microsoft Exchange
11 5 (0.54%) Umbraco
12 3 (0.33%) ArcGIS
12 3 (0.33%) nginx
12 3 (0.33%) NServiceBus
12 3 (0.33%) Tomcat
12 3 (0.33%) WebLogic
12 3 (0.33%) WebLogic Portal
13 2 (0.22%) EPiServer
Applications
1 14 (1.52%) Adobe XD
2 11 (1.20%) Adobe Creative Suite
3 10 (1.09%) Chatbot
4 8 (0.87%) Photoshop
5 7 (0.76%) Adobe Illustrator
6 4 (0.43%) Microsoft Office
7 3 (0.33%) Simulink
8 2 (0.22%) Elementor
9 1 (0.11%) MS Visio
9 1 (0.11%) Notion
Business Applications
1 26 (2.83%) Shopify
2 17 (1.85%) Dynamics CRM
3 10 (1.09%) NetSuite
4 8 (0.87%) Workday HCM
5 7 (0.76%) Magento
6 5 (0.54%) Infor CloudSuite
6 5 (0.54%) Infor CloudSuite Industrial (formerly SyteLine)
6 5 (0.54%) PlanetPress Connect
7 4 (0.43%) Payment Gateway
8 3 (0.33%) Oracle EBS
8 3 (0.33%) Primavera
9 2 (0.22%) Maximo
9 2 (0.22%) Oracle ERP
9 2 (0.22%) Remedy ITSM
9 2 (0.22%) Sage 1000
10 1 (0.11%) Adobe Campaign
Cloud Services
1 389 (42.28%) AWS
2 338 (36.74%) Azure
3 130 (14.13%) GCP
4 107 (11.63%) dbt
5 91 (9.89%) SaaS
6 87 (9.46%) Serverless
7 57 (6.20%) Power Platform
8 56 (6.09%) Snowflake
9 52 (5.65%) Power Automate
10 50 (5.43%) GitHub
11 48 (5.22%) Azure DevOps
12 46 (5.00%) Dynamics 365
13 45 (4.89%) PowerApps
14 39 (4.24%) Microsoft 365
15 33 (3.59%) AWS Lambda
15 33 (3.59%) Figma
16 26 (2.83%) Amazon S3
16 26 (2.83%) Google Analytics
17 22 (2.39%) Amazon ECS
17 22 (2.39%) Azure Logic Apps
Communications & Networking
1 10 (1.09%) Broadband
2 5 (0.54%) HTTP
3 4 (0.43%) Firewall
3 4 (0.43%) SSH
4 2 (0.22%) AMQP
4 2 (0.22%) Intranet
4 2 (0.22%) OpenVPN
5 1 (0.11%) DNS
5 1 (0.11%) Internet
5 1 (0.11%) Network Security
Database & Business Intelligence
1 106 (11.52%) PostgreSQL
2 104 (11.30%) Amazon Athena
3 103 (11.20%) Apache Arrow
3 103 (11.20%) Apache Iceberg
3 103 (11.20%) Dremio
4 98 (10.65%) SQL Server
5 90 (9.78%) MySQL
6 77 (8.37%) MongoDB
7 58 (6.30%) Elasticsearch
8 53 (5.76%) Apache Ignite
8 53 (5.76%) Data Lake
9 48 (5.22%) Azure SQL Database
10 43 (4.67%) Relational Database
11 40 (4.35%) NoSQL
12 38 (4.13%) Power BI
13 16 (1.74%) SQL Server Integration Services
14 15 (1.63%) Redis
15 12 (1.30%) SQL Server Reporting Services
16 9 (0.98%) DynamoDB
17 8 (0.87%) Amazon RDS
Development Applications
1 157 (17.07%) Git
2 41 (4.46%) Cypress.io
3 35 (3.80%) JIRA
4 25 (2.72%) webpack
5 17 (1.85%) Jenkins
6 16 (1.74%) Selenium
7 12 (1.30%) Axure RP
7 12 (1.30%) GitLab
8 11 (1.20%) Babel
8 11 (1.20%) Balsamiq
8 11 (1.20%) TeamCity
8 11 (1.20%) Visual Studio
9 10 (1.09%) CircleCI
10 9 (0.98%) JMeter
10 9 (0.98%) Team Foundation Server
11 8 (0.87%) SonarQube
12 7 (0.76%) Postman
13 6 (0.65%) Jasmine
13 6 (0.65%) LoadRunner
13 6 (0.65%) MSBuild
General
1 255 (27.72%) Finance
2 233 (25.33%) Social Skills
3 134 (14.57%) Front Office
4 97 (10.54%) Law
5 62 (6.74%) Public Sector
6 59 (6.41%) Banking
7 56 (6.09%) Inclusion and Diversity
8 53 (5.76%) Analytical Skills
8 53 (5.76%) Investment Banking
9 46 (5.00%) Marketing
10 23 (2.50%) Retail
11 17 (1.85%) Games
11 17 (1.85%) Legal
12 11 (1.20%) Documentation Skills
13 9 (0.98%) Manufacturing
14 8 (0.87%) Advertising
15 6 (0.65%) Electronics
15 6 (0.65%) Organisational Skills
16 5 (0.54%) Health Technology
17 4 (0.43%) Aerospace
Job Titles
1 585 (63.59%) Developer
2 217 (23.59%) Senior
3 187 (20.33%) Software Engineer
4 118 (12.83%) Senior Developer
5 110 (11.96%) .NET Developer
6 107 (11.63%) AWS Engineer
7 103 (11.20%) AWS Software Engineer
8 98 (10.65%) Python Engineer
9 97 (10.54%) Full-Stack Developer
9 97 (10.54%) Python Software Engineer
10 80 (8.70%) Developer/Software Engineer
11 73 (7.93%) Software Developer
12 72 (7.83%) Lead
13 71 (7.72%) Java Engineer
14 67 (7.28%) Java Software Engineer
15 65 (7.07%) AWS Developer
16 63 (6.85%) Senior Software Engineer
17 61 (6.63%) Python Developer
18 53 (5.76%) Front-End Developer (Client-Side Developer)
19 52 (5.65%) Senior Java Engineer
Libraries, Frameworks & Software Standards
1 342 (37.17%) React
2 308 (33.48%) HTML
3 285 (30.98%) CSS
4 255 (27.72%) .NET
5 207 (22.50%) Node.js
6 177 (19.24%) AngularJS
7 153 (16.63%) Vue
8 107 (11.63%) Pandas
9 105 (11.41%) NumPy
10 103 (11.20%) SciPy
11 98 (10.65%) REST
12 91 (9.89%) ASP.NET
13 87 (9.46%) .NET Core
14 83 (9.02%) RESTful
15 67 (7.28%) HTML5
16 61 (6.63%) .NET Framework
17 59 (6.41%) gRPC
18 58 (6.30%) GraphQL
19 53 (5.76%) Protocol Buffers
20 50 (5.43%) Entity Framework
Miscellaneous
1 133 (14.46%) Fixed Income
2 111 (12.07%) Foreign Exchange (FX)
3 109 (11.85%) Equities
4 57 (6.20%) Hedge funds
5 53 (5.76%) Derivative
5 53 (5.76%) Pricing Data
5 53 (5.76%) Product Ownership
6 48 (5.22%) Cloud Native
7 26 (2.83%) Enterprise Software
7 26 (2.83%) Mobile App
8 19 (2.07%) Low-Code
9 16 (1.74%) Data Structures
10 14 (1.52%) Distributed Systems
11 12 (1.30%) Onboarding
12 11 (1.20%) Motion Graphics
12 11 (1.20%) Self-Motivation
13 9 (0.98%) Data Centre
14 8 (0.87%) Algorithms
14 8 (0.87%) Analytical Mindset
14 8 (0.87%) Legacy Systems
Operating Systems
1 60 (6.52%) Linux
2 30 (3.26%) Windows
3 20 (2.17%) Windows Server
4 18 (1.96%) Unix
5 16 (1.74%) Android
5 16 (1.74%) Apple iOS
6 4 (0.43%) Mac OS
7 1 (0.11%) Embedded Linux
7 1 (0.11%) FreeRTOS
Processes & Methodologies
1 516 (56.09%) Agile
2 310 (33.70%) Software Engineering
3 243 (26.41%) Full-Stack Development
4 198 (21.52%) CI/CD
5 191 (20.76%) Problem-Solving
6 166 (18.04%) DevOps
7 142 (15.43%) Mentoring
8 140 (15.22%) Asset Management
9 133 (14.46%) Investment Management
10 131 (14.24%) Microservices
11 127 (13.80%) User Experience
12 115 (12.50%) Front End Development
13 102 (11.09%) AI
14 98 (10.65%) MVC
15 95 (10.33%) Scrum
16 86 (9.35%) Computer Science
17 81 (8.80%) Continuous Improvement
17 81 (8.80%) Test Automation
18 78 (8.48%) Fintech
19 77 (8.37%) Roadmaps
Programming Languages
1 387 (42.07%) TypeScript
2 298 (32.39%) Python
3 257 (27.93%) C#
4 208 (22.61%) SQL
5 184 (20.00%) Java
6 76 (8.26%) PHP
7 40 (4.35%) Go
8 22 (2.39%) PowerShell
9 13 (1.41%) VB.NET
10 10 (1.09%) Ruby
11 8 (0.87%) Bash
11 8 (0.87%) C
12 7 (0.76%) Shell Script
12 7 (0.76%) T-SQL
12 7 (0.76%) VBA
13 6 (0.65%) Apex Code
13 6 (0.65%) C++
13 6 (0.65%) Perl
13 6 (0.65%) R
14 5 (0.54%) Objective-C
Qualifications
1 128 (13.91%) Degree
2 87 (9.46%) Security Cleared
3 81 (8.80%) SC Cleared
4 71 (7.72%) Computer Science Degree
5 39 (4.24%) Microsoft Certification
6 24 (2.61%) AWS Certification
7 17 (1.85%) AWS Certified Solutions Architect
7 17 (1.85%) Azure Certification
8 16 (1.74%) TOGAF Certification
9 12 (1.30%) DBS Check
10 11 (1.20%) Master's Degree
11 7 (0.76%) BPSS Clearance
12 4 (0.43%) DV Cleared
13 3 (0.33%) ISTQB
14 2 (0.22%) IBM Certification
14 2 (0.22%) ISTQB Foundation Certification
15 1 (0.11%) AWS Certified Developer
15 1 (0.11%) HND
15 1 (0.11%) MCP
15 1 (0.11%) PhD
Quality Assurance & Compliance
1 76 (8.26%) Accessibility
2 71 (7.72%) QA
3 30 (3.26%) GDPR
4 22 (2.39%) WCAG
5 3 (0.33%) HL7
6 2 (0.22%) ISO/IEC 27001
7 1 (0.11%) Actionable Recommendations
7 1 (0.11%) Data Quality
7 1 (0.11%) HIPAA
7 1 (0.11%) PCI DSS
7 1 (0.11%) SLA
System Software
1 110 (11.96%) Docker
2 6 (0.65%) Active Directory
3 1 (0.11%) HDFS
Systems Management
1 57 (6.20%) Kubernetes
2 50 (5.43%) Terraform
3 18 (1.96%) Grafana
4 15 (1.63%) Ansible
5 12 (1.30%) Prometheus
6 8 (0.87%) Single Sign-On
7 6 (0.65%) Argo
8 3 (0.33%) cPanel
8 3 (0.33%) HP Fortify
8 3 (0.33%) Oracle Enterprise Manager
8 3 (0.33%) Plesk
9 2 (0.22%) Control-M
9 2 (0.22%) Kibana
9 2 (0.22%) Microsoft Intune
10 1 (0.11%) Istio
10 1 (0.11%) Kustomize
Vendors
1 195 (21.20%) Microsoft
2 39 (4.24%) ServiceNow
3 29 (3.15%) Adobe
4 28 (3.04%) Google
5 23 (2.50%) MuleSoft
6 19 (2.07%) Oracle
7 17 (1.85%) Salesforce
8 13 (1.41%) Workday
9 12 (1.30%) IBM
10 10 (1.09%) Apple
10 10 (1.09%) DevExpress
10 10 (1.09%) HubSpot
10 10 (1.09%) Infor
11 9 (0.98%) Guidewire
12 8 (0.87%) IFS
12 8 (0.87%) SAP
13 7 (0.76%) Facebook
13 7 (0.76%) SnapLogic
13 7 (0.76%) YouTube
14 5 (0.54%) Jitterbit