REST Contracts in the City of London

Representational State Transfer (REST)
Central London > City of London

The table below provides summary statistics for contract job vacancies advertised in the City of London requiring REST skills. It includes a benchmarking guide to the contractor rates offered in vacancies that cited REST over the 6 months leading up to 7 June 2025, comparing them to the same period in the previous two years.

6 months to
7 Jun 2025
Same period 2024 Same period 2023
Rank 64 73 82
Rank change year-on-year +9 +9 -29
Contract jobs citing REST 54 50 87
As % of all contract jobs advertised in the City of London 3.17% 2.30% 2.52%
As % of the Libraries, Frameworks & Software Standards category 11.84% 9.80% 9.22%
Number of daily rates quoted 44 37 63
10th Percentile £413 £376 £430
25th Percentile £434 £413 £513
Median daily rate (50th Percentile) £538 £483 £600
Median % change year-on-year +11.40% -19.58% -4.00%
75th Percentile £606 £675 £738
90th Percentile £655 £775 £770
Central London median daily rate £525 £500 £638
% change year-on-year +5.00% -21.57% +6.25%

All Software Libraries and Frameworks
City of London

REST falls under the Software Libraries and Frameworks category. For comparison with the information above, the following table provides summary statistics for all contract job vacancies requiring technical specification, industry standards, software libraries and framework skills in the City of London.

Contract vacancies with a requirement for technical specification, industry standards, software libraries and framework skills 456 510 944
As % of all contract IT jobs advertised in the City of London 26.74% 23.47% 27.37%
Number of daily rates quoted 290 355 608
10th Percentile £404 £400 £425
25th Percentile £451 £463 £505
Median daily rate (50th Percentile) £550 £563 £625
Median % change year-on-year -2.22% -10.00% +4.17%
75th Percentile £675 £688 £738
90th Percentile £760 £795 £825
Central London median daily rate £550 £550 £625
% change year-on-year -0.05% -11.96% +4.17%
Number of hourly rates quoted 1 0 1
10th Percentile - - -
25th Percentile £86.25 - -
Median hourly rate £87.50 - £53.00
Median % change year-on-year - - -14.86%
75th Percentile £88.75 - -
90th Percentile - - -
Central London median hourly rate £87.50 - £53.00
% change year-on-year - - -14.86%

REST
Job Vacancy Trend in the City of London

Job postings citing REST as a proportion of all IT jobs advertised in the City of London.
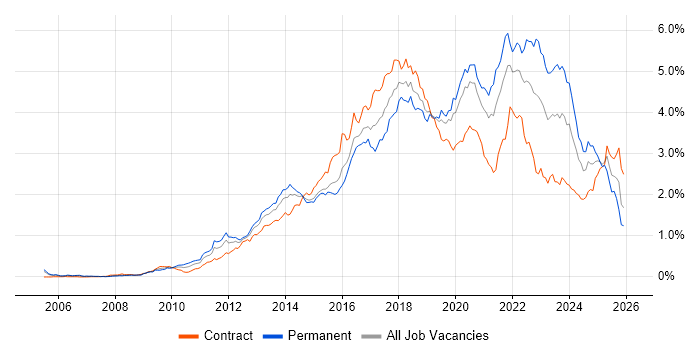
Job vacancy trend for REST in the City of London

REST
Contractor Daily Rate Trend in the City of London

3-month moving average daily rate quoted in jobs citing REST in the City of London.

Daily rate trend for REST in the City of London

REST
Daily Rate Histogram in the City of London

Daily rate distribution for jobs citing REST in the City of London over the 6 months to 7 June 2025.

Daily rate histogram for REST in the City of London

REST
Contractor Hourly Rate Trend in the City of London

3-month moving average hourly rates quoted in jobs citing REST in the City of London.

Hourly rate trend for REST in the City of London

REST
Co-occurring Skills and Capabilities in the City of London by Category

The follow tables expand on the table above by listing co-occurrences grouped by category. The same employment type, locality and period is covered with up to 20 co-occurrences shown in each of the following categories:

Application Platforms
1 5 (9.26%) Confluence
2 4 (7.41%) SharePoint
3 2 (3.70%) Anypoint
4 1 (1.85%) Apache Spark
4 1 (1.85%) Camunda
4 1 (1.85%) Microsoft Exchange
4 1 (1.85%) Mule
Business Applications
1 1 (1.85%) Dynamics CRM
1 1 (1.85%) Fidessa
1 1 (1.85%) Maximo
Cloud Services
1 17 (31.48%) AWS
1 17 (31.48%) Azure
2 5 (9.26%) Azure DevOps
2 5 (9.26%) GitHub
2 5 (9.26%) Power Platform
3 4 (7.41%) GCP
3 4 (7.41%) Power Automate
3 4 (7.41%) PowerApps
4 3 (5.56%) Amazon S3
4 3 (5.56%) Salesforce Sales Cloud
4 3 (5.56%) Salesforce Service Cloud
5 2 (3.70%) Azure Monitor
5 2 (3.70%) dbt
5 2 (3.70%) Dynamics 365
5 2 (3.70%) Entra ID
5 2 (3.70%) GitHub Actions
5 2 (3.70%) OpenShift
6 1 (1.85%) Azure AKS
6 1 (1.85%) Boomi
6 1 (1.85%) Nutanix
Communications & Networking
1 3 (5.56%) Firewall
1 3 (5.56%) HTTP
2 2 (3.70%) DNS
3 1 (1.85%) HTTPS
3 1 (1.85%) Kerberos
3 1 (1.85%) SMTP
3 1 (1.85%) TCP/IP
3 1 (1.85%) VPN
Database & Business Intelligence
1 7 (12.96%) SQL Server
2 5 (9.26%) PostgreSQL
3 3 (5.56%) MySQL
3 3 (5.56%) Relational Database
4 2 (3.70%) Airbyte
4 2 (3.70%) Azure SQL Database
4 2 (3.70%) Geospatial Data
4 2 (3.70%) NoSQL
5 1 (1.85%) Big Data
5 1 (1.85%) BusinessObjects
5 1 (1.85%) CockroachDB
5 1 (1.85%) Crystal Reports
5 1 (1.85%) Data Mart
5 1 (1.85%) Data Warehouse
5 1 (1.85%) Delta Lake
5 1 (1.85%) Power BI
5 1 (1.85%) SAP Data Services
5 1 (1.85%) SQL Server Integration Services
5 1 (1.85%) SQL Server Reporting Services
Development Applications
1 13 (24.07%) Git
2 11 (20.37%) JIRA
3 8 (14.81%) Jenkins
4 6 (11.11%) Postman
4 6 (11.11%) Selenium
5 5 (9.26%) REST Assured
6 3 (5.56%) Bitbucket
7 2 (3.70%) TeamCity
8 1 (1.85%) Artifactory
8 1 (1.85%) Maven
8 1 (1.85%) MLflow
8 1 (1.85%) Storybook
8 1 (1.85%) Subversion
8 1 (1.85%) Visual Studio
8 1 (1.85%) Vite
8 1 (1.85%) webpack
General
1 12 (22.22%) Finance
2 7 (12.96%) Banking
3 6 (11.11%) Analytical Skills
4 5 (9.26%) Public Sector
5 4 (7.41%) Front Office
5 4 (7.41%) Investment Banking
6 3 (5.56%) Marketing
6 3 (5.56%) Publishing
6 3 (5.56%) Social Skills
7 2 (3.70%) Legal
8 1 (1.85%) Back Office
8 1 (1.85%) Financial Institution
8 1 (1.85%) Law
Job Titles
1 24 (44.44%) Developer
2 10 (18.52%) Senior
3 7 (12.96%) Python Engineer
4 5 (9.26%) Test Engineer
5 4 (7.41%) Data Engineer
5 4 (7.41%) Full-Stack Developer
5 4 (7.41%) Java Developer
5 4 (7.41%) Senior Test Engineer
6 3 (5.56%) Architect
6 3 (5.56%) Front-End Developer (Client-Side Developer)
6 3 (5.56%) Java Engineer
6 3 (5.56%) Lead
6 3 (5.56%) Power Platform Developer
6 3 (5.56%) Salesforce Developer
6 3 (5.56%) Senior Data Engineer
6 3 (5.56%) Software Engineer
7 2 (3.70%) Applications Developer
7 2 (3.70%) Java Software Engineer
7 2 (3.70%) ServiceNow Developer
7 2 (3.70%) Technical Leader
Libraries, Frameworks & Software Standards
1 11 (20.37%) React
2 10 (18.52%) SOAP
3 9 (16.67%) CSS
3 9 (16.67%) HTML
4 8 (14.81%) .NET
4 8 (14.81%) Kafka
5 7 (12.96%) Web Services
6 6 (11.11%) pytest
7 5 (9.26%) AngularJS
7 5 (9.26%) JSON
7 5 (9.26%) Spring
8 4 (7.41%) Lightning Web Components
8 4 (7.41%) Vue
8 4 (7.41%) XML
9 3 (5.56%) .NET Framework
9 3 (5.56%) ASP.NET
9 3 (5.56%) GraphQL
9 3 (5.56%) Middleware
9 3 (5.56%) Spring Boot
9 3 (5.56%) Svelte
Miscellaneous
1 3 (5.56%) Data Structures
1 3 (5.56%) Enterprise Software
1 3 (5.56%) Equities
2 2 (3.70%) Algorithms
2 2 (3.70%) Blockchain
2 2 (3.70%) Cloud Native
2 2 (3.70%) Distributed Systems
2 2 (3.70%) Foreign Exchange (FX)
2 2 (3.70%) Product Ownership
2 2 (3.70%) Self-Motivation
3 1 (1.85%) Clustering
3 1 (1.85%) CMDB
3 1 (1.85%) Distributed Architecture
3 1 (1.85%) Fixed Income
3 1 (1.85%) Legacy Systems
3 1 (1.85%) Low-Code
3 1 (1.85%) Management Information System
3 1 (1.85%) Mobile App
3 1 (1.85%) Onboarding
3 1 (1.85%) Reference Data
Operating Systems
1 1 (1.85%) Linux
1 1 (1.85%) Solaris
1 1 (1.85%) Unix
1 1 (1.85%) Windows
1 1 (1.85%) Windows Server
Processes & Methodologies
1 22 (40.74%) Agile
2 19 (35.19%) CI/CD
3 17 (31.48%) DevOps
4 12 (22.22%) Problem-Solving
4 12 (22.22%) Test Automation
5 11 (20.37%) Full-Stack Development
6 8 (14.81%) BDD
6 8 (14.81%) Code Quality
6 8 (14.81%) Microservices
6 8 (14.81%) Open Source
7 7 (12.96%) API Integration
7 7 (12.96%) TDD
8 6 (11.11%) Containerisation
8 6 (11.11%) Data Modelling
8 6 (11.11%) Event-Driven
8 6 (11.11%) Migration
8 6 (11.11%) Scrum
8 6 (11.11%) Software Engineering
8 6 (11.11%) Test Scripting
9 5 (9.26%) Kanban
Programming Languages
1 26 (48.15%) Python
2 18 (33.33%) JavaScript
3 13 (24.07%) Java
4 11 (20.37%) C#
4 11 (20.37%) SQL
5 6 (11.11%) TypeScript
6 4 (7.41%) Apex Code
7 3 (5.56%) PowerShell
8 2 (3.70%) Bash
8 2 (3.70%) DAML
8 2 (3.70%) SPARQL
9 1 (1.85%) DataWeave
9 1 (1.85%) Go
9 1 (1.85%) Groovy
9 1 (1.85%) Perl
9 1 (1.85%) PHP
9 1 (1.85%) Ruby
9 1 (1.85%) Shell Script
9 1 (1.85%) SOQL
9 1 (1.85%) T-SQL
Qualifications
1 6 (11.11%) Security Cleared
2 5 (9.26%) Degree
2 5 (9.26%) SC Cleared
3 3 (5.56%) Computer Science Degree
4 2 (3.70%) PhD
5 1 (1.85%) Azure Certification
5 1 (1.85%) BPSS Clearance
5 1 (1.85%) Master's Degree
Quality Assurance & Compliance
1 7 (12.96%) QA
2 2 (3.70%) Accessibility
2 2 (3.70%) Data Quality
3 1 (1.85%) EMIR
3 1 (1.85%) MiFID
3 1 (1.85%) Sarbanes-Oxley
3 1 (1.85%) WCAG
System Software
1 5 (9.26%) Docker
2 2 (3.70%) Active Directory
3 1 (1.85%) NFS
3 1 (1.85%) OpenAM
3 1 (1.85%) OpenDJ
3 1 (1.85%) OpenIDM
3 1 (1.85%) Veritas File System
3 1 (1.85%) Veritas Volume Manager
3 1 (1.85%) VMware ESXi
3 1 (1.85%) VMware Infrastructure
Systems Management
1 8 (14.81%) Kubernetes
2 4 (7.41%) Ansible
3 2 (3.70%) Terraform
4 1 (1.85%) CloudHub
4 1 (1.85%) Control-M
4 1 (1.85%) Kubeflow
4 1 (1.85%) Netcool
4 1 (1.85%) QRadar
4 1 (1.85%) Red Hat Satellite
4 1 (1.85%) Tivoli
Vendors
1 6 (11.11%) Microsoft
1 6 (11.11%) Oracle
1 6 (11.11%) Salesforce
2 3 (5.56%) MuleSoft
2 3 (5.56%) ServiceNow
3 1 (1.85%) BMC
3 1 (1.85%) Confluent
3 1 (1.85%) CyberArk
3 1 (1.85%) Databricks
3 1 (1.85%) Dynatrace
3 1 (1.85%) ForgeRock
3 1 (1.85%) Google
3 1 (1.85%) Informatica
3 1 (1.85%) Jitterbit
3 1 (1.85%) OutSystems
3 1 (1.85%) Qualys
3 1 (1.85%) Red Hat
3 1 (1.85%) SaltStack
3 1 (1.85%) Splunk
3 1 (1.85%) Talend