Dashboard Development Contracts with Hybrid/Remote/WFH Options

Dashboard Development
UK > Work from Home

The table below provides summary statistics for remote or hybrid contract work requiring Dashboard Development skills. It includes a benchmarking guide to the contractor rates offered in vacancies that cited Dashboard Development over the 6 months leading up to 2 May 2025, comparing them to the same period in the previous two years.

6 months to
2 May 2025
Same period 2024 Same period 2023
Rank 238 287 336
Rank change year-on-year +49 +49 +67
Contract jobs citing Dashboard Development 64 62 139
As % of all contract jobs with a WFH option 0.65% 0.40% 0.54%
As % of the Processes & Methodologies category 0.71% 0.46% 0.60%
Number of daily rates quoted 40 34 96
10th Percentile £279 £360 £375
25th Percentile £391 £416 £455
Median daily rate (50th Percentile) £508 £464 £575
Median % change year-on-year +9.43% -19.35% +27.78%
75th Percentile £691 £488 £646
90th Percentile £799 £618 £694
UK median daily rate £489 £463 £525
% change year-on-year +5.68% -11.90% +5.00%
Number of hourly rates quoted 0 1 2
10th Percentile - - £36.75
25th Percentile - - £37.88
Median hourly rate - £26.24 £39.75
Median % change year-on-year - -33.99% +55.12%
75th Percentile - - £41.63
90th Percentile - - £42.75
UK median hourly rate £25.04 £35.00 £36.00
% change year-on-year -28.45% -2.78% +40.49%

All Process and Methodology Skills
Work from Home

Dashboard Development falls under the Processes and Methodologies category. For comparison with the information above, the following table provides summary statistics for all contract job vacancies with remote or hybrid options requiring process or methodology skills.

Contract vacancies with a requirement for process or methodology skills 9,017 13,465 23,106
As % of all contract jobs with a WFH option 91.06% 87.90% 89.81%
Number of daily rates quoted 6,189 8,984 16,334
10th Percentile £340 £325 £363
25th Percentile £419 £425 £450
Median daily rate (50th Percentile) £525 £525 £540
Median % change year-on-year - -2.78% +2.86%
75th Percentile £638 £638 £650
90th Percentile £763 £750 £750
UK median daily rate £520 £525 £550
% change year-on-year -0.95% -4.55% +4.76%
Number of hourly rates quoted 221 579 532
10th Percentile £14.20 £15.17 £19.00
25th Percentile £19.75 £25.25 £30.54
Median hourly rate £39.00 £43.00 £55.00
Median % change year-on-year -9.30% -21.82% +57.14%
75th Percentile £66.50 £60.00 £68.75
90th Percentile £75.00 £75.25 £80.00
UK median hourly rate £29.00 £35.50 £36.42
% change year-on-year -18.31% -2.53% +45.69%

Dashboard Development
Trend for Jobs with a WFH Option

Job vacancies with remote working options citing Dashboard Development as a proportion of all IT jobs advertised.
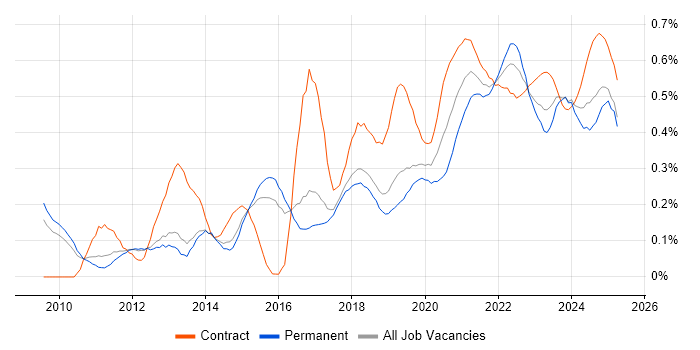
Dashboard Development trend for jobs with Hybrid/Remote/WFH options

Dashboard Development
Daily Rate Trend for Jobs with a WFH Option

3-month moving average daily rate quoted in job vacancies with remote working options citing Dashboard Development.

Dashboard Development daily rate for jobs with a WFH option

Dashboard Development
Daily Rate Histogram for Jobs with a WFH Option

Daily rate distribution for jobs with remote working options citing Dashboard Development over the 6 months to 2 May 2025.

Dashboard Development daily rate histogram for jobs with a WFH option

Dashboard Development
Hourly Rate Trend for Jobs with a WFH Option

3-month moving average hourly rate quoted in job vacancies with remote working options citing Dashboard Development.

Dashboard Development hourly rate for jobs with a WFH option

Dashboard Development
Co-occurring Skills and Capabilities with WFH Options by Category

The follow tables expand on the table above by listing co-occurrences grouped by category. The same employment type, locality and period is covered with up to 20 co-occurrences shown in each of the following categories:

Application Platforms
1 6 (9.38%) Confluence
2 4 (6.25%) SharePoint
Applications
1 13 (20.31%) Microsoft Excel
2 4 (6.25%) Microsoft Office
3 3 (4.69%) MS Visio
4 2 (3.13%) Oracle Smart View
5 1 (1.56%) Microsoft PowerPoint
5 1 (1.56%) Trello
Business Applications
1 1 (1.56%) Raiser’s Edge
1 1 (1.56%) Workday HCM
Cloud Services
1 26 (40.63%) Power Platform
2 12 (18.75%) AWS
3 11 (17.19%) dbt
3 11 (17.19%) GitHub
4 10 (15.63%) GitHub Actions
5 6 (9.38%) Azure
5 6 (9.38%) GCP
6 3 (4.69%) Azure Machine Learning
6 3 (4.69%) Google Tag Manager
6 3 (4.69%) Snowflake
7 2 (3.13%) Google Analytics
7 2 (3.13%) Google Data Studio
8 1 (1.56%) Adobe Analytics
8 1 (1.56%) Azure Cosmos DB
8 1 (1.56%) Dynamics 365
8 1 (1.56%) Google Sheets
8 1 (1.56%) PaaS
8 1 (1.56%) Power Automate
8 1 (1.56%) PowerApps
8 1 (1.56%) SaaS
Communications & Networking
1 1 (1.56%) MQTT
Database & Business Intelligence
1 26 (40.63%) Power BI
2 16 (25.00%) Data Warehouse
3 11 (17.19%) Tableau
4 7 (10.94%) Metadata
5 5 (7.81%) Relational Database
6 4 (6.25%) BusinessObjects
6 4 (6.25%) MS Access
7 3 (4.69%) BigQuery
7 3 (4.69%) Data Lake
8 2 (3.13%) Oracle BI Publisher
8 2 (3.13%) Oracle ODI
8 2 (3.13%) Oracle Reports
8 2 (3.13%) Power Query
9 1 (1.56%) Azure SQL Database
9 1 (1.56%) Data Mining
9 1 (1.56%) MySQL
9 1 (1.56%) RDBMS
9 1 (1.56%) Snowflake Schema
9 1 (1.56%) Star Schema
9 1 (1.56%) Tableau Server
Development Applications
1 6 (9.38%) JIRA
2 1 (1.56%) MLflow
2 1 (1.56%) RStudio
2 1 (1.56%) Visual Studio
General
1 19 (29.69%) Analytical Skills
2 18 (28.13%) Finance
3 16 (25.00%) Social Skills
4 10 (15.63%) Public Sector
5 9 (14.06%) Banking
6 4 (6.25%) Presentation Skills
6 4 (6.25%) Retail
7 3 (4.69%) Marketing
8 2 (3.13%) Investment Banking
8 2 (3.13%) Legal
9 1 (1.56%) Corporate Banking
9 1 (1.56%) Front Office
9 1 (1.56%) Health Technology
9 1 (1.56%) Inclusion and Diversity
9 1 (1.56%) Manufacturing
9 1 (1.56%) Publishing
9 1 (1.56%) Retail Banking
Job Titles
1 14 (21.88%) Analyst
2 10 (15.63%) Developer
3 8 (12.50%) Architect
4 7 (10.94%) Data Architect
5 6 (9.38%) Data Analyst
6 5 (7.81%) Administrator
6 5 (7.81%) Data Engineer
6 5 (7.81%) Senior
7 4 (6.25%) Consultant
7 4 (6.25%) Lead
7 4 (6.25%) Salesforce Administrator
7 4 (6.25%) Salesforce Developer
8 3 (4.69%) Business Data Analyst
8 3 (4.69%) Business Intelligence Analyst
8 3 (4.69%) Data Scientist
8 3 (4.69%) ETL Analyst
8 3 (4.69%) Re-Platforming Analyst
8 3 (4.69%) Report Analyst
8 3 (4.69%) Technical Analyst
9 2 (3.13%) Splunk Engineer
Libraries, Frameworks & Software Standards
1 10 (15.63%) Jinja
2 2 (3.13%) Oracle Fusion
3 1 (1.56%) JSON
3 1 (1.56%) OAuth
3 1 (1.56%) OAuth2
3 1 (1.56%) OpenTelemetry
3 1 (1.56%) PySpark
3 1 (1.56%) PyTorch
3 1 (1.56%) SAML
3 1 (1.56%) TensorFlow
Miscellaneous
1 3 (4.69%) Legacy Systems
1 3 (4.69%) Onboarding
1 3 (4.69%) Product Ownership
2 2 (3.13%) Clustering
2 2 (3.13%) Mainframe
3 1 (1.56%) Algorithms
3 1 (1.56%) Analytical Mindset
3 1 (1.56%) Data Protection Act
3 1 (1.56%) Data Structures
3 1 (1.56%) Fixed Income
3 1 (1.56%) Foreign Exchange (FX)
3 1 (1.56%) IoT
3 1 (1.56%) Low-Code
3 1 (1.56%) Management Information System
3 1 (1.56%) PMI
3 1 (1.56%) Reference Data
3 1 (1.56%) Security Posture
3 1 (1.56%) Social Media
3 1 (1.56%) Virtual Team
Operating Systems
1 2 (3.13%) Unix
1 2 (3.13%) Windows
Processes & Methodologies
1 38 (59.38%) Analytics
2 30 (46.88%) Business Intelligence
3 25 (39.06%) Data Modelling
4 17 (26.56%) Data Analysis
5 16 (25.00%) Visualisation
6 15 (23.44%) Decision-Making
7 13 (20.31%) Requirements Gathering
8 11 (17.19%) Stakeholder Management
9 10 (15.63%) Agile
9 10 (15.63%) CI/CD
10 8 (12.50%) Data Analytics
10 8 (12.50%) Data Visualisation
10 8 (12.50%) Problem-Solving
11 7 (10.94%) Business Analysis
11 7 (10.94%) Data Architecture
11 7 (10.94%) Data Cleansing
11 7 (10.94%) ETL
11 7 (10.94%) Translating Business Requirements
12 6 (9.38%) Data Management
12 6 (9.38%) Validation
Programming Languages
1 36 (56.25%) SQL
2 22 (34.38%) Python
3 2 (3.13%) JavaScript
3 2 (3.13%) R
3 2 (3.13%) VB
4 1 (1.56%) Data Analysis Expressions
Qualifications
1 15 (23.44%) Security Cleared
2 14 (21.88%) SC Cleared
3 5 (7.81%) Degree
4 2 (3.13%) BPSS Clearance
5 1 (1.56%) Numerate Degree
5 1 (1.56%) PMI Certification
5 1 (1.56%) Tableau Certification
Quality Assurance & Compliance
1 7 (10.94%) Data Quality
2 3 (4.69%) GDPR
2 3 (4.69%) QA
3 2 (3.13%) PMO
4 1 (1.56%) GRC
System Software
1 1 (1.56%) Virtual Machines
Systems Management
1 1 (1.56%) Kubernetes
1 1 (1.56%) Prometheus
Vendors
1 9 (14.06%) Microsoft
2 6 (9.38%) Google
2 6 (9.38%) Salesforce
3 5 (7.81%) SAP
4 4 (6.25%) ServiceNow
5 3 (4.69%) Databricks
6 2 (3.13%) Oracle
6 2 (3.13%) Splunk
6 2 (3.13%) Workday
7 1 (1.56%) Adobe
7 1 (1.56%) Alteryx
7 1 (1.56%) Dynatrace
7 1 (1.56%) Mercator
7 1 (1.56%) OneTrust
7 1 (1.56%) Qualys