SDLC Contracts with Hybrid/Remote/WFH Options

Systems or Software Development Life Cycle (SDLC)
UK > Work from Home

The table below provides summary statistics for remote or hybrid contract work requiring SDLC skills. It includes a benchmarking guide to the contractor rates offered in vacancies that cited SDLC over the 6 months leading up to 1 May 2025, comparing them to the same period in the previous two years.

6 months to
1 May 2025
Same period 2024 Same period 2023
Rank 98 87 76
Rank change year-on-year -11 -11 +14
Contract jobs citing SDLC 253 363 762
As % of all contract jobs with a WFH option 2.55% 2.37% 2.95%
As % of the Processes & Methodologies category 2.80% 2.69% 3.28%
Number of daily rates quoted 165 286 522
10th Percentile £358 £375 £413
25th Percentile £450 £456 £495
Median daily rate (50th Percentile) £537 £588 £600
Median % change year-on-year -8.60% -2.08% +9.09%
75th Percentile £775 £700 £738
90th Percentile £881 £813 £800
UK median daily rate £540 £575 £600
% change year-on-year -6.09% -4.17% +5.17%
Number of hourly rates quoted 3 2 17
10th Percentile £66.50 - £42.76
25th Percentile £66.88 - £46.25
Median hourly rate £70.00 £50.00 £52.21
Median % change year-on-year +40.00% -4.23% -5.07%
75th Percentile £78.88 - £63.75
90th Percentile £82.70 - £64.25
UK median hourly rate £61.25 £48.00 £60.00
% change year-on-year +27.60% -20.00% +9.09%

All Process and Methodology Skills
Work from Home

SDLC falls under the Processes and Methodologies category. For comparison with the information above, the following table provides summary statistics for all contract job vacancies with remote or hybrid options requiring process or methodology skills.

Contract vacancies with a requirement for process or methodology skills 9,021 13,483 23,229
As % of all contract jobs with a WFH option 91.08% 87.87% 89.84%
Number of daily rates quoted 6,191 8,996 16,418
10th Percentile £340 £325 £363
25th Percentile £419 £425 £450
Median daily rate (50th Percentile) £525 £525 £540
Median % change year-on-year - -2.78% +2.86%
75th Percentile £638 £638 £650
90th Percentile £763 £750 £750
UK median daily rate £520 £525 £550
% change year-on-year -0.95% -4.55% +4.76%
Number of hourly rates quoted 224 579 532
10th Percentile £14.20 £15.17 £19.00
25th Percentile £19.56 £25.25 £30.54
Median hourly rate £39.52 £43.00 £55.00
Median % change year-on-year -8.09% -21.82% +57.14%
75th Percentile £66.13 £60.00 £68.75
90th Percentile £75.00 £75.25 £80.23
UK median hourly rate £29.00 £35.65 £37.30
% change year-on-year -18.65% -4.42% +49.20%

SDLC
Trend for Jobs with a WFH Option

Job vacancies with remote working options citing SDLC as a proportion of all IT jobs advertised.
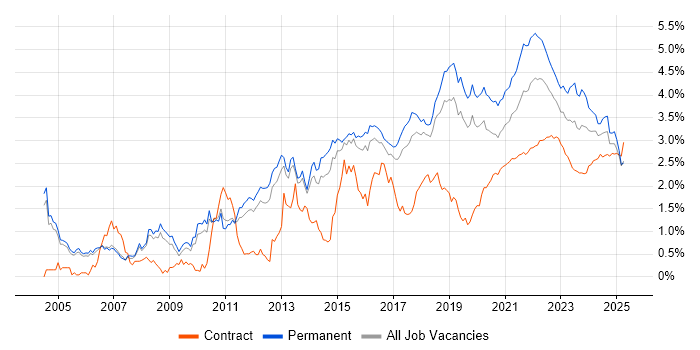
SDLC trend for jobs with Hybrid/Remote/WFH options

SDLC
Daily Rate Trend for Jobs with a WFH Option

3-month moving average daily rate quoted in job vacancies with remote working options citing SDLC.

SDLC daily rate for jobs with a WFH option

SDLC
Daily Rate Histogram for Jobs with a WFH Option

Daily rate distribution for jobs with remote working options citing SDLC over the 6 months to 1 May 2025.

SDLC daily rate histogram for jobs with a WFH option

SDLC
Hourly Rate Trend for Jobs with a WFH Option

3-month moving average hourly rate quoted in job vacancies with remote working options citing SDLC.

SDLC hourly rate for jobs with a WFH option

SDLC
Hourly Rate Histogram for Jobs with a WFH Option

Hourly rate distribution for jobs with remote working options citing SDLC over the 6 months to 1 May 2025.

SDLC hourly rate histogram for jobs with a WFH option

SDLC
Co-occurring Skills and Capabilities with WFH Options by Category

The follow tables expand on the table above by listing co-occurrences grouped by category. The same employment type, locality and period is covered with up to 20 co-occurrences shown in each of the following categories:

Application Platforms
1 10 (3.95%) Confluence
2 5 (1.98%) NetWeaver
2 5 (1.98%) SharePoint
3 4 (1.58%) Apache
3 4 (1.58%) nginx
3 4 (1.58%) OpenStack
4 3 (1.19%) Jupyter
4 3 (1.19%) Oracle SOA Suite
5 2 (0.79%) CMS
6 1 (0.40%) Apache Spark
6 1 (0.40%) Appian
6 1 (0.40%) BizTalk Server
6 1 (0.40%) CICS
6 1 (0.40%) FactoryTalk
6 1 (0.40%) Headless CMS
Applications
1 5 (1.98%) Microsoft Excel
2 3 (1.19%) MS Visio
3 2 (0.79%) Microsoft PowerPoint
3 2 (0.79%) Microsoft Project
4 1 (0.40%) Microsoft Office
4 1 (0.40%) Spreadsheet
4 1 (0.40%) Trello
Business Applications
1 6 (2.37%) Endur
2 3 (1.19%) SAP S/4HANA
3 2 (0.79%) Dynamics CRM
3 2 (0.79%) Oracle EBS
4 1 (0.40%) BASE24
4 1 (0.40%) IntelliMatch
4 1 (0.40%) SAP GTS
4 1 (0.40%) SAP MM
4 1 (0.40%) SAP SD
4 1 (0.40%) Sparx Enterprise Architect
Cloud Services
1 52 (20.55%) Azure
2 44 (17.39%) AWS
3 17 (6.72%) Azure DevOps
3 17 (6.72%) GitHub
4 14 (5.53%) GCP
5 11 (4.35%) GitHub Actions
6 10 (3.95%) Cloud Computing
7 8 (3.16%) Power Platform
7 8 (3.16%) Serverless
8 7 (2.77%) AWS Lambda
8 7 (2.77%) npm
8 7 (2.77%) SaaS
9 4 (1.58%) Amazon CloudWatch
9 4 (1.58%) Amazon Glacier
9 4 (1.58%) Amazon Kinesis
9 4 (1.58%) Amazon S3
9 4 (1.58%) AWS CloudFormation
10 3 (1.19%) Alation
10 3 (1.19%) Azure Data Factory
10 3 (1.19%) Dynamics 365
Communications & Networking
1 15 (5.93%) HTTP
2 2 (0.79%) ATM
2 2 (0.79%) Network Security
3 1 (0.40%) 2G
3 1 (0.40%) 5G
3 1 (0.40%) Ethernet
3 1 (0.40%) Firewall
3 1 (0.40%) GSM
3 1 (0.40%) Intrusion Detection
3 1 (0.40%) Packet Switching
3 1 (0.40%) SSL
3 1 (0.40%) Wireless
Database & Business Intelligence
1 39 (15.42%) Relational Database
2 35 (13.83%) MongoDB
3 33 (13.04%) DB2
4 13 (5.14%) KDB
4 13 (5.14%) Kdb+
5 12 (4.74%) SQL Server
6 8 (3.16%) PostgreSQL
6 8 (3.16%) Power BI
7 4 (1.58%) Crystal Reports
7 4 (1.58%) Data Mining
7 4 (1.58%) DynamoDB
7 4 (1.58%) MySQL
7 4 (1.58%) RDBMS
7 4 (1.58%) Redis
8 3 (1.19%) IBM InfoSphere
8 3 (1.19%) NoSQL
8 3 (1.19%) Tableau
9 2 (0.79%) Amazon RDS
9 2 (0.79%) Oracle BI Publisher
9 2 (0.79%) Oracle Database
Development Applications
1 52 (20.55%) Jenkins
2 39 (15.42%) JIRA
3 34 (13.44%) JUnit
4 25 (9.88%) Git
5 13 (5.14%) GitLab
6 8 (3.16%) Subversion
7 7 (2.77%) Maven
7 7 (2.77%) webpack
8 6 (2.37%) Visual Studio
9 5 (1.98%) Ant
9 5 (1.98%) REST Assured
9 5 (1.98%) Team Foundation Server
10 4 (1.58%) Bitbucket
10 4 (1.58%) Selenium
10 4 (1.58%) SoapUI
10 4 (1.58%) SonarQube
11 3 (1.19%) Cypress.io
11 3 (1.19%) Mockito
11 3 (1.19%) MSTest
11 3 (1.19%) Zephyr
General
1 99 (39.13%) Social Skills
2 93 (36.76%) Banking
3 84 (33.20%) Finance
4 78 (30.83%) Analytical Skills
5 71 (28.06%) Investment Banking
6 23 (9.09%) Front Office
7 20 (7.91%) Organisational Skills
8 9 (3.56%) Public Sector
9 7 (2.77%) Presentation Skills
10 5 (1.98%) Inclusion and Diversity
10 5 (1.98%) Wholesale Banking
11 4 (1.58%) Back Office
12 3 (1.19%) Financial Institution
13 2 (0.79%) Billing
13 2 (0.79%) French Language
13 2 (0.79%) Influencing Skills
13 2 (0.79%) Manufacturing
13 2 (0.79%) Military
14 1 (0.40%) Documentation Skills
14 1 (0.40%) Welsh Language
Job Titles
1 117 (46.25%) Developer
2 45 (17.79%) Python Developer
2 45 (17.79%) Senior
3 38 (15.02%) Java Developer
4 25 (9.88%) Senior Developer
5 22 (8.70%) Linux Developer
6 21 (8.30%) Architect
7 20 (7.91%) Artificial Intelligence Developer
7 20 (7.91%) Gen AI Developer
8 19 (7.51%) Analyst
9 18 (7.11%) Investment Banking Java Developer
9 18 (7.11%) SQL Developer
10 15 (5.93%) Lead
11 14 (5.53%) Solutions Architect
12 12 (4.74%) Project Manager
12 12 (4.74%) Senior Java Developer
13 11 (4.35%) C++ Developer
13 11 (4.35%) Senior C++ Developer
13 11 (4.35%) Senior Python Developer
13 11 (4.35%) Software Engineer
Libraries, Frameworks & Software Standards
1 39 (15.42%) Kafka
2 37 (14.62%) Spring
3 36 (14.23%) .NET
4 29 (11.46%) JMS
5 27 (10.67%) React
6 24 (9.49%) REST
7 22 (8.70%) Django
7 22 (8.70%) FastAPI
8 17 (6.72%) RESTful
9 14 (5.53%) AngularJS
10 11 (4.35%) Web Services
11 10 (3.95%) Play Framework
11 10 (3.95%) SOAP
12 9 (3.56%) CSS
12 9 (3.56%) HTML
12 9 (3.56%) Middleware
13 7 (2.77%) Spring Boot
14 6 (2.37%) IDoc
14 6 (2.37%) XML
15 5 (1.98%) XSLT
Miscellaneous
1 36 (14.23%) Data Structures
2 33 (13.04%) Equities
3 18 (7.11%) Enterprise Software
4 16 (6.32%) Product Ownership
5 13 (5.14%) Algorithms
6 10 (3.95%) Derivative
6 10 (3.95%) Distributed Systems
7 9 (3.56%) Equity Derivative
8 8 (3.16%) Data Protection Act
9 6 (2.37%) Cloud Native
9 6 (2.37%) Greenfield Project
9 6 (2.37%) Legacy Applications
9 6 (2.37%) Legacy Systems
9 6 (2.37%) Public Cloud
9 6 (2.37%) Self-Motivation
9 6 (2.37%) Virtual Team
10 5 (1.98%) Device Driver
10 5 (1.98%) Embedded Systems
10 5 (1.98%) IoT
11 4 (1.58%) Market Risk
Operating Systems
1 72 (28.46%) Linux
2 27 (10.67%) Windows
3 17 (6.72%) Unix
4 2 (0.79%) Red Hat Enterprise Linux
4 2 (0.79%) Windows Server
5 1 (0.40%) AIX
5 1 (0.40%) Solaris
5 1 (0.40%) zOS
Processes & Methodologies
1 171 (67.59%) Agile
2 79 (31.23%) CI/CD
3 72 (28.46%) Problem-Solving
4 65 (25.69%) DevOps
5 39 (15.42%) Continuous Improvement
5 39 (15.42%) Scrum
6 38 (15.02%) Artificial Intelligence
7 35 (13.83%) Multithreading
8 33 (13.04%) Machine Learning
9 32 (12.65%) Containerisation
10 31 (12.25%) Software Engineering
11 30 (11.86%) Generative AI
12 29 (11.46%) Performance Tuning
13 27 (10.67%) Database Tuning
13 27 (10.67%) LLM
14 26 (10.28%) Open Source
14 26 (10.28%) Use Case
15 24 (9.49%) Technical Analysis
16 23 (9.09%) Data Science
17 22 (8.70%) Microservices
Programming Languages
1 113 (44.66%) Python
2 94 (37.15%) SQL
3 93 (36.76%) Java
4 40 (15.81%) C#
5 37 (14.62%) Shell Script
6 33 (13.04%) TypeScript
7 26 (10.28%) JavaScript
8 15 (5.93%) C++
9 12 (4.74%) Bash
10 9 (3.56%) Scala
11 8 (3.16%) PL/SQL
11 8 (3.16%) PowerShell
12 7 (2.77%) Groovy
13 6 (2.37%) ABAP
14 5 (1.98%) C
14 5 (1.98%) Embedded C
15 3 (1.19%) COBOL
15 3 (1.19%) DAML
15 3 (1.19%) Perl
15 3 (1.19%) R
Qualifications
1 12 (4.74%) Degree
2 10 (3.95%) Security Cleared
3 7 (2.77%) SC Cleared
4 4 (1.58%) Computer Science Degree
5 3 (1.19%) AWS Certification
5 3 (1.19%) BPSS Clearance
5 3 (1.19%) CISSP
5 3 (1.19%) ISTQB
5 3 (1.19%) Oracle Certification
5 3 (1.19%) PMI Certification
5 3 (1.19%) PMP
6 2 (0.79%) Azure Certification
6 2 (0.79%) Master's Degree
6 2 (0.79%) Microsoft Certification
7 1 (0.40%) APMP
7 1 (0.40%) CEH
7 1 (0.40%) CISM
7 1 (0.40%) DV Cleared
7 1 (0.40%) PhD
7 1 (0.40%) PRINCE2 Practitioner
Quality Assurance & Compliance
1 21 (8.30%) QA
2 9 (3.56%) Disclosure Scotland
3 4 (1.58%) Data Quality
3 4 (1.58%) PMO
4 3 (1.19%) Basel II
4 3 (1.19%) GDPR
4 3 (1.19%) PCI DSS
5 2 (0.79%) Accessibility
6 1 (0.40%) Basel III
6 1 (0.40%) COREP
6 1 (0.40%) GRC
6 1 (0.40%) HIPAA
6 1 (0.40%) ISO 20022
6 1 (0.40%) ISO 8583
6 1 (0.40%) NIST
6 1 (0.40%) SEPA
6 1 (0.40%) Software Quality Assurance
System Software
1 66 (26.09%) Docker
2 5 (1.98%) Firmware
3 3 (1.19%) Active Directory
4 1 (0.40%) Oracle RAC
Systems Management
1 69 (27.27%) Kubernetes
2 34 (13.44%) Ansible
3 18 (7.11%) Terraform
4 3 (1.19%) Prometheus
5 2 (0.79%) Grafana
6 1 (0.40%) Data Guard
6 1 (0.40%) Failover Clustering
6 1 (0.40%) HP ALM
6 1 (0.40%) HP Fortify
6 1 (0.40%) Microsoft Clustering
6 1 (0.40%) MIIS
6 1 (0.40%) Nessus
6 1 (0.40%) Opsgenie
6 1 (0.40%) Oracle Enterprise Manager
6 1 (0.40%) Oracle Flashback
6 1 (0.40%) Progress Chef
6 1 (0.40%) PTC Integrity
6 1 (0.40%) Puppet
Vendors
1 34 (13.44%) Sybase
2 27 (10.67%) Microsoft
3 23 (9.09%) Oracle
4 10 (3.95%) Databricks
4 10 (3.95%) SAP
5 8 (3.16%) ServiceNow
6 7 (2.77%) Dynatrace
6 7 (2.77%) IBM
6 7 (2.77%) Splunk
7 6 (2.37%) OpenLink
8 4 (1.58%) AppDynamics
9 3 (1.19%) Informatica
9 3 (1.19%) New Relic
9 3 (1.19%) Red Hat
10 2 (0.79%) Atlassian
10 2 (0.79%) CA Agile Central
10 2 (0.79%) HP
10 2 (0.79%) Qualys
10 2 (0.79%) Salesforce
10 2 (0.79%) TIBCO