DHCP Contracts with Hybrid/Remote/WFH Options

Dynamic Host Configuration Protocol (DHCP)
UK > Work from Home

The table below provides summary statistics for remote or hybrid contract work requiring DHCP skills. It includes a benchmarking guide to the contractor rates offered in vacancies that cited DHCP over the 6 months leading up to 7 May 2025, comparing them to the same period in the previous two years.

6 months to
7 May 2025
Same period 2024 Same period 2023
Rank 186 239 223
Rank change year-on-year +53 -16 +83
Contract jobs citing DHCP 122 105 284
As % of all contract jobs with a WFH option 1.24% 0.69% 1.11%
As % of the Communications & Networking category 11.64% 6.68% 9.63%
Number of daily rates quoted 100 82 204
10th Percentile £350 £300 £318
25th Percentile £406 £331 £413
Median daily rate (50th Percentile) £535 £465 £520
Median % change year-on-year +15.06% -10.58% +22.35%
75th Percentile £611 £599 £603
90th Percentile £838 £608 £700
UK median daily rate £525 £475 £488
% change year-on-year +10.53% -2.56% +14.71%
Number of hourly rates quoted 0 4 0
Median hourly rate - £20.25 -
UK median hourly rate £23.59 £40.00 £38.50
% change year-on-year -41.03% +3.90% +75.00%

All Communications and Computer Networking Skills
Work from Home

DHCP falls under the Communications and Computer Networking category. For comparison with the information above, the following table provides summary statistics for all contract job vacancies with remote or hybrid options requiring communications or computer networking skills.

Contract vacancies with a requirement for communications or computer networking skills 1,048 1,573 2,949
As % of all contract jobs with a WFH option 10.63% 10.33% 11.55%
Number of daily rates quoted 676 1,022 1,962
10th Percentile £325 £300 £350
25th Percentile £400 £410 £425
Median daily rate (50th Percentile) £500 £511 £525
Median % change year-on-year -2.20% -2.62% +5.00%
75th Percentile £600 £619 £650
90th Percentile £700 £700 £725
UK median daily rate £488 £500 £520
% change year-on-year -2.50% -3.85% +4.00%
Number of hourly rates quoted 30 77 95
10th Percentile £13.78 £12.75 £23.30
25th Percentile £14.20 £14.27 £42.50
Median hourly rate £41.00 £24.50 £60.00
Median % change year-on-year +67.35% -59.17% +20.00%
75th Percentile £64.69 £65.00 £72.63
90th Percentile £73.88 £87.46 £80.25
UK median hourly rate £30.70 £40.00 £18.88
% change year-on-year -23.25% +111.92% -31.36%

DHCP
Trend for Jobs with a WFH Option

Job vacancies with remote working options citing DHCP as a proportion of all IT jobs advertised.
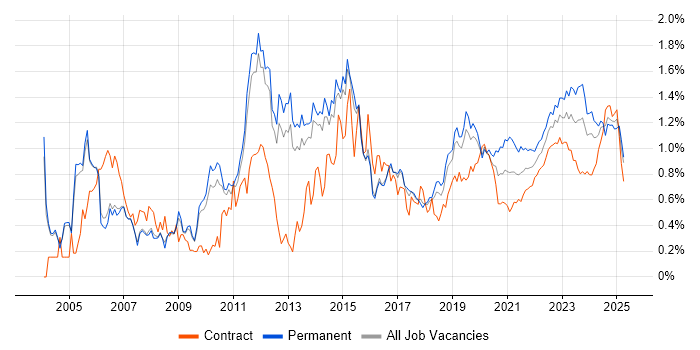
DHCP trend for jobs with Hybrid/Remote/WFH options

DHCP
Daily Rate Trend for Jobs with a WFH Option

3-month moving average daily rate quoted in job vacancies with remote working options citing DHCP.

DHCP daily rate for jobs with a WFH option

DHCP
Daily Rate Histogram for Jobs with a WFH Option

Daily rate distribution for jobs with remote working options citing DHCP over the 6 months to 7 May 2025.

DHCP daily rate histogram for jobs with a WFH option

DHCP
Hourly Rate Trend for Jobs with a WFH Option

3-month moving average hourly rate quoted in job vacancies with remote working options citing DHCP.

DHCP hourly rate for jobs with a WFH option

DHCP
Co-occurring Skills and Capabilities with WFH Options by Category

The follow tables expand on the table above by listing co-occurrences grouped by category. The same employment type, locality and period is covered with up to 20 co-occurrences shown in each of the following categories:

Application Platforms
1 13 (10.66%) Microsoft Exchange
2 11 (9.02%) SharePoint
3 5 (4.10%) Confluence
3 5 (4.10%) IIS
4 4 (3.28%) Skype for Business
5 3 (2.46%) Apache
Applications
1 6 (4.92%) Microsoft Office
2 1 (0.82%) Microsoft Excel
2 1 (0.82%) Microsoft PowerPoint
Cloud Services
1 63 (51.64%) Azure
2 36 (29.51%) AWS
3 24 (19.67%) IaaS
4 22 (18.03%) AWS CloudFormation
4 22 (18.03%) Entra ID
4 22 (18.03%) GCP
4 22 (18.03%) PaaS
4 22 (18.03%) SaaS
5 11 (9.02%) Microsoft 365
6 7 (5.74%) GitHub
7 6 (4.92%) Amazon EC2
8 5 (4.10%) Route 53
9 3 (2.46%) Datadog
9 3 (2.46%) Nutanix
10 2 (1.64%) Akamai
10 2 (1.64%) Amazon CloudWatch
10 2 (1.64%) Azure Monitor
11 1 (0.82%) Amazon S3
11 1 (0.82%) Cloud Computing
11 1 (0.82%) Rubrik
Communications & Networking
1 116 (95.08%) DNS
2 50 (40.98%) TCP/IP
3 39 (31.97%) Firewall
4 27 (22.13%) BGP
5 25 (20.49%) OSPF
6 24 (19.67%) HTTP
7 20 (16.39%) HTTPS
8 19 (15.57%) VPN
8 19 (15.57%) WAN
9 18 (14.75%) LAN
10 14 (11.48%) Wireless
11 13 (10.66%) Network Security
12 9 (7.38%) SMTP
12 9 (7.38%) VLAN
12 9 (7.38%) Wi-Fi
13 6 (4.92%) FTP
14 5 (4.10%) SSL
14 5 (4.10%) Telnet
15 4 (3.28%) DOCSIS
15 4 (3.28%) SNMP
Database & Business Intelligence
1 7 (5.74%) SQL Server
2 4 (3.28%) PostgreSQL
3 2 (1.64%) InfluxDB
3 2 (1.64%) Looker
3 2 (1.64%) MariaDB
4 1 (0.82%) Amazon RDS
4 1 (0.82%) DynamoDB
4 1 (0.82%) MongoDB
4 1 (0.82%) Power BI
4 1 (0.82%) Sybase ASE
Development Applications
1 5 (4.10%) Jenkins
1 5 (4.10%) JIRA
2 3 (2.46%) Git
3 2 (1.64%) GitLab
4 1 (0.82%) Bitbucket
4 1 (0.82%) TeamCity
General
1 22 (18.03%) Social Skills
2 17 (13.93%) Finance
3 6 (4.92%) Public Sector
4 4 (3.28%) Analytical Skills
5 3 (2.46%) Retail
6 2 (1.64%) Banking
6 2 (1.64%) Inclusion and Diversity
6 2 (1.64%) Military
6 2 (1.64%) Organisational Skills
7 1 (0.82%) Back Office
7 1 (0.82%) Documentation Skills
7 1 (0.82%) Financial Institution
Job Titles
1 28 (22.95%) Architect
2 24 (19.67%) Infrastructure Engineer
3 19 (15.57%) Cloud Architect
3 19 (15.57%) Technical Architect
4 18 (14.75%) Cloud Native Architect
5 17 (13.93%) Network Engineer
6 10 (8.20%) AWS Architect
6 10 (8.20%) Network Security Architect
6 10 (8.20%) Security Architect
7 9 (7.38%) Security Technical Architect
7 9 (7.38%) Senior
7 9 (7.38%) Windows Engineer
8 7 (5.74%) Administrator
9 6 (4.92%) Network Security Engineer
9 6 (4.92%) Security Engineer
9 6 (4.92%) Support Engineer
10 5 (4.10%) Azure Engineer
10 5 (4.10%) Linux Engineer
10 5 (4.10%) Senior Infrastructure Engineer
10 5 (4.10%) Wintel Architect
Libraries, Frameworks & Software Standards
1 3 (2.46%) Elastic Stack
1 3 (2.46%) LDAP
2 2 (1.64%) 802.1X
2 2 (1.64%) NETCONF
3 1 (0.82%) ARM Templates
3 1 (0.82%) HTML
3 1 (0.82%) Node.js
3 1 (0.82%) Web Services
3 1 (0.82%) XML
3 1 (0.82%) Yocto
Miscellaneous
1 19 (15.57%) Data Centre
2 18 (14.75%) Cloud Native
3 13 (10.66%) PKI
4 6 (4.92%) Security Operations Centre
4 6 (4.92%) Self-Motivation
5 4 (3.28%) Enterprise Storage
5 4 (3.28%) Hybrid Cloud
5 4 (3.28%) Security Posture
6 3 (2.46%) Clustering
6 3 (2.46%) Cyberattack
6 3 (2.46%) Fibre Optics
7 2 (1.64%) Embedded Systems
7 2 (1.64%) IoT
7 2 (1.64%) Public Cloud
7 2 (1.64%) Video Conferencing
7 2 (1.64%) Video\Live Streaming
8 1 (0.82%) Algorithms
8 1 (0.82%) Cyber Threat
8 1 (0.82%) Enterprise Software
8 1 (0.82%) Linux Command Line
Operating Systems
1 63 (51.64%) Windows
2 41 (33.61%) Windows Server
3 29 (23.77%) Linux
4 15 (12.30%) Windows Server 2019
5 13 (10.66%) Windows Server 2016
6 11 (9.02%) Red Hat Enterprise Linux
7 10 (8.20%) Windows Server 2012
8 5 (4.10%) Windows 10
9 4 (3.28%) CentOS
9 4 (3.28%) VMS
10 3 (2.46%) Mac OS X
10 3 (2.46%) Ubuntu
11 2 (1.64%) Apple iOS
11 2 (1.64%) SUSE
11 2 (1.64%) Unix
12 1 (0.82%) Android
12 1 (0.82%) Embedded Linux
12 1 (0.82%) OpenWrt
12 1 (0.82%) Oracle Linux
12 1 (0.82%) Solaris
Processes & Methodologies
1 36 (29.51%) Infrastructure Engineering
2 26 (21.31%) Infrastructure as Code
3 21 (17.21%) Test Automation
4 20 (16.39%) Sprint Planning
5 18 (14.75%) ITIL
5 18 (14.75%) Migration
6 16 (13.11%) Problem-Solving
7 13 (10.66%) DevOps
8 12 (9.84%) High Availability
9 11 (9.02%) Patch Management
10 10 (8.20%) Agile
11 9 (7.38%) Incident Management
11 9 (7.38%) Root Cause Analysis
12 7 (5.74%) Business Strategy
12 7 (5.74%) CI/CD
12 7 (5.74%) Mentoring
13 6 (4.92%) Load Balancing
13 6 (4.92%) RBAC
13 6 (4.92%) Security Operations
13 6 (4.92%) Stakeholder Engagement
Programming Languages
1 20 (16.39%) Bicep
2 18 (14.75%) PowerShell
3 15 (12.30%) Python
4 5 (4.10%) VBScript
5 4 (3.28%) Bash
5 4 (3.28%) Java
5 4 (3.28%) Perl
5 4 (3.28%) Shell Script
6 3 (2.46%) C
7 2 (1.64%) C#
7 2 (1.64%) C++
7 2 (1.64%) Go
7 2 (1.64%) SQL
8 1 (0.82%) JavaScript
8 1 (0.82%) VB
Qualifications
1 26 (21.31%) Security Cleared
2 23 (18.85%) SC Cleared
3 11 (9.02%) Cisco Certification
4 8 (6.56%) CCNP
5 7 (5.74%) AWS Certification
6 6 (4.92%) Azure Certification
7 5 (4.10%) Degree
7 5 (4.10%) DV Cleared
8 4 (3.28%) CCNA
8 4 (3.28%) MCSE
8 4 (3.28%) Microsoft Certification
9 3 (2.46%) CISSP
9 3 (2.46%) MCSA
10 1 (0.82%) CCDP
10 1 (0.82%) CTC Cleared
10 1 (0.82%) ITIL Certification
10 1 (0.82%) ITIL Foundation Certificate
10 1 (0.82%) JNCIP
Quality Assurance & Compliance
1 4 (3.28%) QA
2 3 (2.46%) SLA
3 2 (1.64%) GDPR
3 2 (1.64%) PCI DSS
4 1 (0.82%) Sarbanes-Oxley
System Software
1 59 (48.36%) Active Directory
2 18 (14.75%) VMware Infrastructure
3 17 (13.93%) VMware ESXi
4 14 (11.48%) Hyper-V
5 7 (5.74%) vSphere
6 5 (4.10%) NFS
7 4 (3.28%) Docker
7 4 (3.28%) Virtual Machines
7 4 (3.28%) Virtual Servers
8 3 (2.46%) DFS Replication
9 2 (1.64%) Microsoft Virtual Server
9 2 (1.64%) Samba
9 2 (1.64%) Virtual Desktop
10 1 (0.82%) BitLocker
10 1 (0.82%) Firmware
10 1 (0.82%) VMware NSX
10 1 (0.82%) VMware Server
Systems Management
1 26 (21.31%) Terraform
2 12 (9.84%) Ansible
2 12 (9.84%) Microsoft Intune
2 12 (9.84%) vCenter Server
3 10 (8.20%) SCCM
3 10 (8.20%) WSUS
4 6 (4.92%) FortiGate
5 5 (4.10%) Kubernetes
6 4 (3.28%) NetBackup
7 3 (2.46%) Progress Chef
7 3 (2.46%) Puppet
8 2 (1.64%) Active Directory Federation Services
8 2 (1.64%) Cisco Prime
8 2 (1.64%) Failover Clustering
8 2 (1.64%) Grafana
8 2 (1.64%) OPNET
8 2 (1.64%) Packer
8 2 (1.64%) Red Hat Satellite
8 2 (1.64%) SCOM
8 2 (1.64%) yum
Vendors
1 43 (35.25%) VMware
2 38 (31.15%) Microsoft
3 35 (28.69%) Cisco
4 25 (20.49%) CheckPoint
4 25 (20.49%) Palo Alto
5 22 (18.03%) Fortinet
6 12 (9.84%) Red Hat
7 7 (5.74%) Aruba
7 7 (5.74%) HP
8 6 (4.92%) F5
8 6 (4.92%) Splunk
9 5 (4.10%) Citrix
9 5 (4.10%) Dell
9 5 (4.10%) Infoblox
9 5 (4.10%) SolarWinds
9 5 (4.10%) Veeam
9 5 (4.10%) Zscaler
10 4 (3.28%) 3PAR
10 4 (3.28%) Juniper
10 4 (3.28%) Veritas