Technical Architect Contracts with Hybrid/Remote/WFH Options

Technical Architect
UK > Work from Home

The median Technical Architect daily rate for remote or hybrid work is £634, according to job vacancies posted in the 6 months leading up to 1 May 2025.

The table below provides contractor rate benchmarking and summary statistics, comparing them to the same period in the previous two years.

6 months to
1 May 2025
Same period 2024 Same period 2023
Rank 159 175 198
Rank change year-on-year +16 +23 +93
Contract jobs requiring a Technical Architect 150 178 326
As % of all contract jobs with a WFH option 1.51% 1.16% 1.26%
As % of the Job Titles category 1.61% 1.24% 1.32%
Number of daily rates quoted 102 138 212
10th Percentile £463 £500 £480
25th Percentile £550 £550 £550
Median daily rate (50th Percentile) £634 £675 £675
Median % change year-on-year -6.11% - +7.14%
75th Percentile £795 £753 £743
90th Percentile £838 £825 £774
UK median daily rate £630 £650 £670
% change year-on-year -3.08% -2.99% +6.35%

All Contract IT Job Vacancies
Work from Home

For comparison with the information above, the following table provides summary statistics for all contract IT job vacancies with WFH or hybrid options. Most job vacancies include a discernible job title that can be normalized. As such, the figures in the second row provide an indication of the number of contract jobs in our overall sample.

Contract vacancies in Work from Home with a recognized job title 9,288 14,354 24,650
% of contract IT jobs with a recognized job title 93.77% 93.54% 95.33%
Number of daily rates quoted 6,350 9,595 17,415
10th Percentile £337 £325 £360
25th Percentile £414 £425 £444
Median daily rate (50th Percentile) £525 £525 £540
Median % change year-on-year - -2.69% +2.76%
75th Percentile £638 £638 £650
90th Percentile £763 £750 £750
UK median daily rate £515 £525 £540
% change year-on-year -1.90% -2.78% +2.86%
Number of hourly rates quoted 228 579 565
10th Percentile £14.00 £14.38 £18.50
25th Percentile £18.19 £23.39 £26.00
Median hourly rate £38.00 £44.74 £55.00
Median % change year-on-year -15.06% -18.65% +57.14%
75th Percentile £66.00 £63.00 £68.75
90th Percentile £75.00 £75.25 £80.25
UK median hourly rate £29.00 £36.42 £45.00
% change year-on-year -20.37% -19.07% +91.49%

Technical Architect
Trend for Jobs with a WFH Option

Job vacancies with remote working options which featured Technical Architect in the job title as a proportion of all IT jobs advertised.
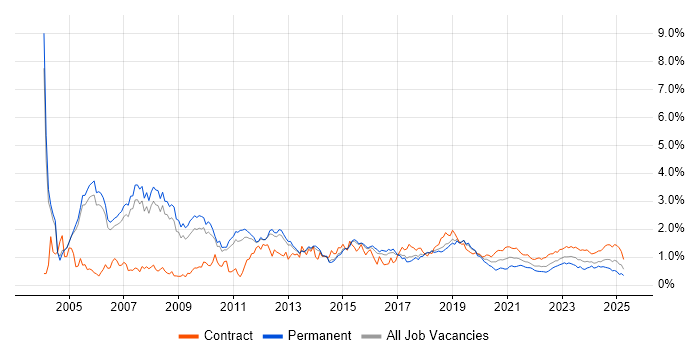
Technical Architect trend for jobs with Hybrid/Remote/WFH options

Technical Architect
Daily Rate Trend for Jobs with a WFH Option

3-month moving average daily rate quoted in job vacancies with remote working options citing Technical Architect.

Technical Architect daily rate for jobs with a WFH option

Technical Architect
Daily Rate Histogram for Jobs with a WFH Option

Daily rate distribution for jobs with remote working options citing Technical Architect over the 6 months to 1 May 2025.

Technical Architect daily rate histogram for jobs with a WFH option

Technical Architect
Hourly Rate Trend for Jobs with a WFH Option

3-month moving average hourly rate quoted in job vacancies with remote working options citing Technical Architect.

Technical Architect hourly rate for jobs with a WFH option

Technical Architect Skill Set
Top 30 Co-occurring Skills and Capabilities in Job Vacancies with WFH Options

For the 6 months to 1 May 2025, Technical Architect contract job roles required the following skills and capabilities in order of popularity. The figures indicate the absolute number co-occurrences and as a proportion of all contract jobs with a WFH option featuring Technical Architect in the job title.

1 64 (42.67%) Azure
2 62 (41.33%) AWS
3 50 (33.33%) Security Cleared
4 44 (29.33%) SC Cleared
5 37 (24.67%) Public Sector
6 34 (22.67%) GCP
7 33 (22.00%) Java
8 32 (21.33%) SaaS
8 32 (21.33%) Infrastructure as Code
9 31 (20.67%) PaaS
10 29 (19.33%) Microsoft
11 28 (18.67%) IaaS
11 28 (18.67%) Terraform
12 27 (18.00%) Palo Alto
12 27 (18.00%) Roadmaps
12 27 (18.00%) Cisco
12 27 (18.00%) TOGAF
13 24 (16.00%) Firewall
13 24 (16.00%) Fortinet
13 24 (16.00%) Cloud Native
14 23 (15.33%) Social Skills
14 23 (15.33%) Agile
15 22 (14.67%) Technical Architecture
15 22 (14.67%) AWS CloudFormation
15 22 (14.67%) Microservices
16 20 (13.33%) TCP/IP
16 20 (13.33%) DNS
16 20 (13.33%) OSPF
16 20 (13.33%) BGP
17 19 (12.67%) DHCP

Technical Architect Skill Set
Co-occurring Skills and Capabilities with WFH Options by Category

The follow tables expand on the table above by listing co-occurrences grouped by category. The same employment type, locality and period is covered with up to 20 co-occurrences shown in each of the following categories:

Application Platforms
1 3 (2.00%) Confluence
2 2 (1.33%) Camunda
2 2 (1.33%) NetWeaver
2 2 (1.33%) SAP EP
3 1 (0.67%) ArcGIS
3 1 (0.67%) Microsoft Exchange
3 1 (0.67%) SharePoint
3 1 (0.67%) Skype for Business
Applications
1 11 (7.33%) MS Visio
2 10 (6.67%) Microsoft PowerPoint
3 1 (0.67%) Chatbot
3 1 (0.67%) Microsoft Office
Business Applications
1 6 (4.00%) Oracle EBS
2 2 (1.33%) Dynamics CRM
2 2 (1.33%) SAP CRM
3 1 (0.67%) Payment Gateway
3 1 (0.67%) SAP S/4HANA
Cloud Services
1 64 (42.67%) Azure
2 62 (41.33%) AWS
3 34 (22.67%) GCP
4 32 (21.33%) SaaS
5 31 (20.67%) PaaS
6 28 (18.67%) IaaS
7 22 (14.67%) AWS CloudFormation
8 9 (6.00%) Amazon ECS
9 8 (5.33%) Serverless
10 6 (4.00%) Entra ID
10 6 (4.00%) GitHub
11 4 (2.67%) Amazon EKS
11 4 (2.67%) Amazon SQS
11 4 (2.67%) Azure DevOps
11 4 (2.67%) Dynamics 365
11 4 (2.67%) GitHub Actions
11 4 (2.67%) Microsoft 365
12 3 (2.00%) AWS CodeBuild
12 3 (2.00%) AWS CodePipeline
12 3 (2.00%) AWS KMS
Communications & Networking
1 24 (16.00%) Firewall
2 20 (13.33%) BGP
2 20 (13.33%) DNS
2 20 (13.33%) OSPF
2 20 (13.33%) TCP/IP
3 19 (12.67%) DHCP
4 18 (12.00%) HTTP
4 18 (12.00%) HTTPS
5 8 (5.33%) VPN
5 8 (5.33%) VSAN
6 5 (3.33%) Intrusion Detection
6 5 (3.33%) Network Security
7 4 (2.67%) WAN
8 3 (2.00%) IPsec
8 3 (2.00%) Kerberos
8 3 (2.00%) SSL
9 2 (1.33%) Cisco Nexus
9 2 (1.33%) LAN
9 2 (1.33%) MPLS
9 2 (1.33%) SD-WAN
Database & Business Intelligence
1 9 (6.00%) Amazon RDS
2 6 (4.00%) PostgreSQL
3 3 (2.00%) MongoDB
3 3 (2.00%) NoSQL
3 3 (2.00%) Relational Database
4 2 (1.33%) Metadata
4 2 (1.33%) Metadata Repository
4 2 (1.33%) Oracle Database
4 2 (1.33%) SQL Server
5 1 (0.67%) Amazon Aurora
5 1 (0.67%) Apache Hive
5 1 (0.67%) Azure SQL Database
5 1 (0.67%) BigQuery
5 1 (0.67%) Geospatial Data
5 1 (0.67%) GIS
5 1 (0.67%) Hadoop
5 1 (0.67%) MySQL
5 1 (0.67%) Tableau
Development Applications
1 6 (4.00%) Jenkins
2 3 (2.00%) GitLab
2 3 (2.00%) Maven
3 2 (1.33%) JIRA
3 2 (1.33%) Terragrunt
4 1 (0.67%) CircleCI
General
1 37 (24.67%) Public Sector
2 23 (15.33%) Social Skills
3 10 (6.67%) Presentation Skills
4 9 (6.00%) Finance
5 4 (2.67%) Influencing Skills
6 3 (2.00%) Inclusion and Diversity
7 2 (1.33%) Documentation Skills
7 2 (1.33%) Law
7 2 (1.33%) Retail
8 1 (0.67%) Analytical Skills
8 1 (0.67%) Back Office
8 1 (0.67%) Local Government
8 1 (0.67%) Manufacturing
8 1 (0.67%) Marketing
8 1 (0.67%) Military
8 1 (0.67%) Telecoms
Libraries, Frameworks & Software Standards
1 8 (5.33%) Node.js
2 7 (4.67%) Spring Boot
3 6 (4.00%) Spring
4 5 (3.33%) .NET
5 4 (2.67%) OAuth
5 4 (2.67%) OAuth2
5 4 (2.67%) Oracle Fusion
5 4 (2.67%) REST
5 4 (2.67%) SAML
5 4 (2.67%) Web Services
6 3 (2.00%) AngularJS
6 3 (2.00%) CSS
6 3 (2.00%) Kafka
6 3 (2.00%) OpenID
6 3 (2.00%) XACML
7 2 (1.33%) Express.js
7 2 (1.33%) HTML
7 2 (1.33%) Middleware
7 2 (1.33%) Ruby on Rails
7 2 (1.33%) SAP PI
Miscellaneous
1 24 (16.00%) Cloud Native
2 10 (6.67%) Management Information System
3 8 (5.33%) Hybrid Cloud
3 8 (5.33%) PKI
4 6 (4.00%) Operational Technology
4 6 (4.00%) Public Cloud
5 5 (3.33%) Cyber Threat
5 5 (3.33%) Data Centre
5 5 (3.33%) NHS
5 5 (3.33%) Private Cloud
6 3 (2.00%) Distributed Denial-of-Service
7 2 (1.33%) Mobile App
7 2 (1.33%) Product Ownership
7 2 (1.33%) Self-Motivation
8 1 (0.67%) BYOD
8 1 (0.67%) CMDB
8 1 (0.67%) Cyber Defence
8 1 (0.67%) EPoS
8 1 (0.67%) Greenfield Project
8 1 (0.67%) Video Conferencing
Operating Systems
1 6 (4.00%) Linux
1 6 (4.00%) Windows
2 2 (1.33%) Apple iOS
2 2 (1.33%) Red Hat Enterprise Linux
2 2 (1.33%) Windows Server
3 1 (0.67%) Unix
3 1 (0.67%) Windows 10
3 1 (0.67%) Windows Server 2012
3 1 (0.67%) Windows Server 2016
3 1 (0.67%) Windows Server 2019
Processes & Methodologies
1 32 (21.33%) Infrastructure as Code
2 27 (18.00%) Roadmaps
2 27 (18.00%) TOGAF
3 23 (15.33%) Agile
4 22 (14.67%) Microservices
4 22 (14.67%) Technical Architecture
5 19 (12.67%) CI/CD
5 19 (12.67%) DevOps
6 18 (12.00%) Sprint Planning
6 18 (12.00%) Stakeholder Management
6 18 (12.00%) Test Automation
7 15 (10.00%) Decision-Making
8 14 (9.33%) Architectural Patterns
8 14 (9.33%) Migration
9 12 (8.00%) DevSecOps
9 12 (8.00%) ITIL
9 12 (8.00%) Scaled Agile Framework
9 12 (8.00%) Technical Leadership
10 11 (7.33%) Continuous Delivery
10 11 (7.33%) MODAF
Programming Languages
1 33 (22.00%) Java
2 18 (12.00%) Bicep
3 10 (6.67%) JavaScript
4 9 (6.00%) SQL
5 6 (4.00%) C#
6 4 (2.67%) PL/SQL
6 4 (2.67%) PowerShell
7 3 (2.00%) Python
8 2 (1.33%) ABAP
8 2 (1.33%) Ruby
9 1 (0.67%) Apex Code
9 1 (0.67%) Kotlin
9 1 (0.67%) TypeScript
9 1 (0.67%) X++
Qualifications
1 50 (33.33%) Security Cleared
2 44 (29.33%) SC Cleared
3 12 (8.00%) Microsoft Certification
4 8 (5.33%) Degree
4 8 (5.33%) MCSE
5 7 (4.67%) AWS Certification
5 7 (4.67%) BPSS Clearance
5 7 (4.67%) VMware Certified Professional (VCP)
6 4 (2.67%) Azure Certification
6 4 (2.67%) Computer Science Degree
6 4 (2.67%) DV Cleared
6 4 (2.67%) Master's Degree
7 3 (2.00%) AWS Certified Solutions Architect
8 1 (0.67%) CCNP
8 1 (0.67%) Cisco Certification
8 1 (0.67%) DBS Check
8 1 (0.67%) MCSA
8 1 (0.67%) TOGAF Certification
Quality Assurance & Compliance
1 10 (6.67%) NCSC
2 8 (5.33%) Cyber Essentials
2 8 (5.33%) NIST
3 2 (1.33%) Actionable Recommendations
3 2 (1.33%) QA
4 1 (0.67%) Data Quality
4 1 (0.67%) Government Security Classifications
4 1 (0.67%) HL7
4 1 (0.67%) HMG Security Policy Framework
4 1 (0.67%) ISO/IEC 27001
4 1 (0.67%) PCI DSS
System Software
1 16 (10.67%) VMware Infrastructure
2 10 (6.67%) Docker
3 9 (6.00%) Virtual Machines
3 9 (6.00%) VMware NSX
4 6 (4.00%) Hyper-V
5 5 (3.33%) Active Directory
6 3 (2.00%) RACF
7 2 (1.33%) vSphere
Systems Management
1 28 (18.67%) Terraform
2 9 (6.00%) Kubernetes
3 6 (4.00%) Microsoft Intune
4 5 (3.33%) SCCM
5 3 (2.00%) Ansible
5 3 (2.00%) Packer
5 3 (2.00%) Single Sign-On
6 1 (0.67%) Data Guard
6 1 (0.67%) Grafana
6 1 (0.67%) Istio
6 1 (0.67%) OPNET
6 1 (0.67%) Prometheus
6 1 (0.67%) QRadar
6 1 (0.67%) SCOM
Vendors
1 29 (19.33%) Microsoft
2 27 (18.00%) Cisco
2 27 (18.00%) Palo Alto
3 24 (16.00%) Fortinet
4 18 (12.00%) CheckPoint
4 18 (12.00%) VMware
5 13 (8.67%) Oracle
6 9 (6.00%) ServiceNow
7 6 (4.00%) Databricks
7 6 (4.00%) Google
8 3 (2.00%) Ariba
8 3 (2.00%) Cloudera
8 3 (2.00%) SAP
9 2 (1.33%) Apple
9 2 (1.33%) IFS
9 2 (1.33%) Red Hat
9 2 (1.33%) Salesforce
9 2 (1.33%) Virgin Media
10 1 (0.67%) IBM
10 1 (0.67%) Veritas