Mentoring Contracts with Hybrid/Remote/WFH Options

Mentorship
UK > Work from Home

The table below provides summary statistics for remote or hybrid contract work requiring Mentoring skills. It includes a benchmarking guide to the contractor rates offered in vacancies that cited Mentoring over the 6 months leading up to 1 May 2025, comparing them to the same period in the previous two years.

6 months to
1 May 2025
Same period 2024 Same period 2023
Rank 86 76 93
Rank change year-on-year -10 +17 -1
Contract jobs citing Mentoring 286 402 643
As % of all contract jobs with a WFH option 2.89% 2.62% 2.49%
As % of the Processes & Methodologies category 3.17% 2.98% 2.77%
Number of daily rates quoted 176 280 425
10th Percentile £365 £415 £413
25th Percentile £443 £493 £475
Median daily rate (50th Percentile) £540 £550 £575
Median % change year-on-year -1.82% -4.35% +3.14%
75th Percentile £620 £663 £675
90th Percentile £748 £830 £763
UK median daily rate £525 £550 £575
% change year-on-year -4.55% -4.35% +2.82%
Number of hourly rates quoted 5 12 7
10th Percentile - - £26.07
25th Percentile £22.00 £15.17 £55.00
Median hourly rate £67.50 £25.00 £85.00
Median % change year-on-year +170.00% -70.59% +142.86%
75th Percentile £92.50 £29.00 -
90th Percentile - £35.00 £87.00
UK median hourly rate £47.50 £40.00 £75.00
% change year-on-year +18.75% -46.67% +114.29%

All Process and Methodology Skills
Work from Home

Mentoring falls under the Processes and Methodologies category. For comparison with the information above, the following table provides summary statistics for all contract job vacancies with remote or hybrid options requiring process or methodology skills.

Contract vacancies with a requirement for process or methodology skills 9,021 13,483 23,229
As % of all contract jobs with a WFH option 91.08% 87.87% 89.84%
Number of daily rates quoted 6,191 8,996 16,418
10th Percentile £340 £325 £363
25th Percentile £419 £425 £450
Median daily rate (50th Percentile) £525 £525 £540
Median % change year-on-year - -2.78% +2.86%
75th Percentile £638 £638 £650
90th Percentile £763 £750 £750
UK median daily rate £520 £525 £550
% change year-on-year -0.95% -4.55% +4.76%
Number of hourly rates quoted 224 579 532
10th Percentile £14.20 £15.17 £19.00
25th Percentile £19.56 £25.25 £30.54
Median hourly rate £39.52 £43.00 £55.00
Median % change year-on-year -8.09% -21.82% +57.14%
75th Percentile £66.13 £60.00 £68.75
90th Percentile £75.00 £75.25 £80.23
UK median hourly rate £29.00 £35.65 £37.30
% change year-on-year -18.65% -4.42% +49.20%

Mentoring
Trend for Jobs with a WFH Option

Job vacancies with remote working options citing Mentoring as a proportion of all IT jobs advertised.
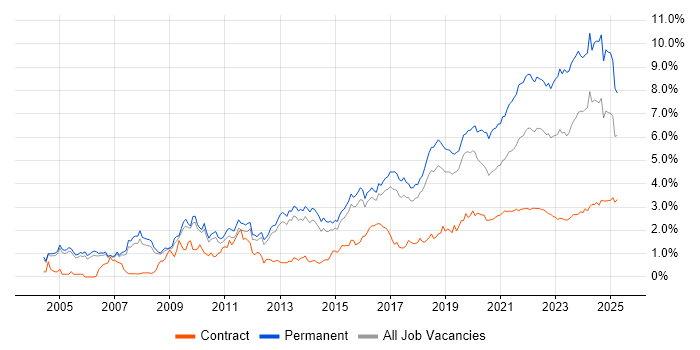
Mentoring trend for jobs with Hybrid/Remote/WFH options

Mentoring
Daily Rate Trend for Jobs with a WFH Option

3-month moving average daily rate quoted in job vacancies with remote working options citing Mentoring.

Mentoring daily rate for jobs with a WFH option

Mentoring
Daily Rate Histogram for Jobs with a WFH Option

Daily rate distribution for jobs with remote working options citing Mentoring over the 6 months to 1 May 2025.

Mentoring daily rate histogram for jobs with a WFH option

Mentoring
Hourly Rate Trend for Jobs with a WFH Option

3-month moving average hourly rate quoted in job vacancies with remote working options citing Mentoring.

Mentoring hourly rate for jobs with a WFH option

Mentoring
Hourly Rate Histogram for Jobs with a WFH Option

Hourly rate distribution for jobs with remote working options citing Mentoring over the 6 months to 1 May 2025.

Mentoring hourly rate histogram for jobs with a WFH option

Mentoring
Co-occurring Skills and Capabilities with WFH Options by Category

The follow tables expand on the table above by listing co-occurrences grouped by category. The same employment type, locality and period is covered with up to 20 co-occurrences shown in each of the following categories:

Application Platforms
1 10 (3.50%) Confluence
2 8 (2.80%) Apache
2 8 (2.80%) Apache Spark
3 6 (2.10%) SharePoint
4 2 (0.70%) Camunda
4 2 (0.70%) Oracle SOA Suite
5 1 (0.35%) Apache Airflow
5 1 (0.35%) GeoServer
5 1 (0.35%) Microsoft Exchange
5 1 (0.35%) SAS
5 1 (0.35%) ThingWorx
Applications
1 2 (0.70%) Microsoft Excel
1 2 (0.70%) Microsoft Office
1 2 (0.70%) MS Visio
2 1 (0.35%) Adobe Creative Suite
2 1 (0.35%) Microsoft PowerPoint
2 1 (0.35%) Microsoft Project
2 1 (0.35%) Trello
Business Applications
1 5 (1.75%) SAP S/4HANA
2 3 (1.05%) Payment Gateway
3 2 (0.70%) Oracle EBS
4 1 (0.35%) Loan IQ
4 1 (0.35%) NetSuite
4 1 (0.35%) SAP CO
4 1 (0.35%) SAP FI
4 1 (0.35%) SAP FI/CO
4 1 (0.35%) SAP MM
4 1 (0.35%) SAP PP
4 1 (0.35%) SAP SD
4 1 (0.35%) Sparx Enterprise Architect
4 1 (0.35%) Unit4 Business World
Cloud Services
1 92 (32.17%) AWS
2 78 (27.27%) Azure
3 35 (12.24%) GCP
4 32 (11.19%) Serverless
5 27 (9.44%) Azure DevOps
6 23 (8.04%) AWS Lambda
7 20 (6.99%) AWS CloudFormation
8 15 (5.24%) GitHub
9 11 (3.85%) Amazon S3
10 10 (3.50%) Power Platform
10 10 (3.50%) SaaS
11 9 (3.15%) Entra ID
11 9 (3.15%) GitHub Actions
11 9 (3.15%) Microsoft 365
12 7 (2.45%) Amazon SQS
13 6 (2.10%) Amazon ECS
13 6 (2.10%) Cloud Computing
13 6 (2.10%) Datadog
13 6 (2.10%) IaaS
13 6 (2.10%) Slack
Communications & Networking
1 17 (5.94%) HTTP
2 14 (4.90%) Network Security
3 13 (4.55%) DNS
3 13 (4.55%) TCP/IP
3 13 (4.55%) VPN
4 11 (3.85%) Firewall
5 9 (3.15%) LAN
6 7 (2.45%) DHCP
6 7 (2.45%) WAN
7 6 (2.10%) HTTPS
7 6 (2.10%) Wireless
8 4 (1.40%) SSL
9 3 (1.05%) 4G
9 3 (1.05%) BGP
9 3 (1.05%) Cisco Nexus
9 3 (1.05%) DWDM
9 3 (1.05%) SNMP
10 2 (0.70%) Cisco Firepower
10 2 (0.70%) Cisco ISE
10 2 (0.70%) Multicast
Database & Business Intelligence
1 33 (11.54%) PostgreSQL
2 28 (9.79%) MongoDB
3 22 (7.69%) MySQL
4 20 (6.99%) Relational Database
5 15 (5.24%) NoSQL
6 11 (3.85%) DynamoDB
7 10 (3.50%) Big Data
7 10 (3.50%) Redis
8 9 (3.15%) Data Warehouse
8 9 (3.15%) SQL Server
9 6 (2.10%) Amazon RDS
9 6 (2.10%) Apache Cassandra
9 6 (2.10%) Data Lake
9 6 (2.10%) Oracle Reports
9 6 (2.10%) Power BI
9 6 (2.10%) RDBMS
10 4 (1.40%) Amazon Aurora
10 4 (1.40%) Hadoop
11 3 (1.05%) GIS
11 3 (1.05%) Oracle Database
Development Applications
1 27 (9.44%) Git
2 24 (8.39%) Jenkins
3 20 (6.99%) JIRA
4 15 (5.24%) GitLab
5 14 (4.90%) JUnit
6 10 (3.50%) Cypress.io
7 7 (2.45%) Cucumber
8 6 (2.10%) Jasmine
8 6 (2.10%) Maven
8 6 (2.10%) Mockito
9 5 (1.75%) git-flow
9 5 (1.75%) Gradle
9 5 (1.75%) REST Assured
9 5 (1.75%) Selenium
10 4 (1.40%) CircleCI
11 3 (1.05%) Eclipse
11 3 (1.05%) MLflow
11 3 (1.05%) Postman
11 3 (1.05%) SonarQube
11 3 (1.05%) TestNG
General
1 93 (32.52%) Social Skills
2 61 (21.33%) Public Sector
3 43 (15.03%) Finance
4 42 (14.69%) Analytical Skills
5 23 (8.04%) Inclusion and Diversity
6 16 (5.59%) Banking
7 14 (4.90%) Manufacturing
8 11 (3.85%) Law
8 11 (3.85%) Presentation Skills
9 8 (2.80%) Marketing
10 7 (2.45%) Organisational Skills
11 6 (2.10%) Military
11 6 (2.10%) Telecoms
12 5 (1.75%) Automotive
12 5 (1.75%) Retail
12 5 (1.75%) Welsh Language
13 3 (1.05%) Electronics
14 2 (0.70%) Financial Institution
14 2 (0.70%) German Language
14 2 (0.70%) Pharmaceutical
Job Titles
1 61 (21.33%) Senior
2 60 (20.98%) Lead
3 57 (19.93%) Developer
4 34 (11.89%) Architect
5 24 (8.39%) Software Engineer
6 19 (6.64%) Senior Developer
7 18 (6.29%) DevOps Engineer
8 15 (5.24%) Java Developer
9 13 (4.55%) Lead Developer
10 12 (4.20%) AWS Engineer
11 11 (3.85%) Solutions Architect
12 10 (3.50%) Analyst
12 10 (3.50%) Consultant
12 10 (3.50%) Senior DevOps
12 10 (3.50%) Senior DevOps Engineer
13 8 (2.80%) Data Engineer
14 7 (2.45%) Backend Developer
14 7 (2.45%) C# Developer
14 7 (2.45%) Node.js Developer
14 7 (2.45%) Software Developer
Libraries, Frameworks & Software Standards
1 24 (8.39%) Kafka
2 23 (8.04%) Node.js
2 23 (8.04%) Spring
2 23 (8.04%) Spring Boot
3 20 (6.99%) RESTful
4 19 (6.64%) React
5 17 (5.94%) HTML
6 16 (5.59%) JSON
7 14 (4.90%) AngularJS
7 14 (4.90%) Swagger
8 13 (4.55%) Web Services
9 12 (4.20%) OAuth
10 11 (3.85%) CSS
10 11 (3.85%) Elastic Stack
10 11 (3.85%) OpenAPI
10 11 (3.85%) Redux
10 11 (3.85%) XML
11 10 (3.50%) .NET
11 10 (3.50%) Jest
12 9 (3.15%) SOAP
Miscellaneous
1 25 (8.74%) Product Ownership
2 9 (3.15%) Cloud Native
2 9 (3.15%) Distributed Systems
2 9 (3.15%) Legacy Systems
2 9 (3.15%) Security Posture
3 8 (2.80%) Operational Technology
3 8 (2.80%) PKI
4 6 (2.10%) Data Structures
4 6 (2.10%) Distributed Denial-of-Service
4 6 (2.10%) Management Information System
4 6 (2.10%) Public Cloud
4 6 (2.10%) Security Operations Centre
5 5 (1.75%) CMDB
5 5 (1.75%) Enterprise Software
5 5 (1.75%) Hybrid Cloud
5 5 (1.75%) Renewable Energy
5 5 (1.75%) Self-Motivation
6 4 (1.40%) Hedge funds
6 4 (1.40%) NHS
6 4 (1.40%) Taxonomies
Operating Systems
1 28 (9.79%) Linux
2 14 (4.90%) Windows
3 7 (2.45%) Red Hat Enterprise Linux
4 6 (2.10%) Unix
5 4 (1.40%) Amazon Linux
5 4 (1.40%) Windows Server
6 2 (0.70%) Mac OS
7 1 (0.35%) Android
7 1 (0.35%) Kali Linux
Processes & Methodologies
1 92 (32.17%) Agile
2 82 (28.67%) CI/CD
3 79 (27.62%) Problem-Solving
4 71 (24.83%) DevOps
5 68 (23.78%) Technical Leadership
6 61 (21.33%) Coaching
7 48 (16.78%) Software Engineering
8 43 (15.03%) Microservices
8 43 (15.03%) Test Automation
9 42 (14.69%) Containerisation
10 36 (12.59%) Infrastructure as Code
11 32 (11.19%) Computer Science
12 31 (10.84%) Scrum
13 30 (10.49%) Analytics
14 27 (9.44%) Continuous Integration
14 27 (9.44%) Migration
14 27 (9.44%) TDD
15 25 (8.74%) Continuous Improvement
16 24 (8.39%) Project Management
17 22 (7.69%) Roadmaps
Programming Languages
1 65 (22.73%) Python
2 57 (19.93%) Java
3 51 (17.83%) JavaScript
4 47 (16.43%) SQL
5 30 (10.49%) TypeScript
6 24 (8.39%) PowerShell
7 18 (6.29%) Bash
7 18 (6.29%) C#
8 8 (2.80%) T-SQL
9 7 (2.45%) C++
10 6 (2.10%) Go
11 4 (1.40%) Kotlin
11 4 (1.40%) Scala
11 4 (1.40%) Shell Script
12 3 (1.05%) Groovy
12 3 (1.05%) R
13 2 (0.70%) Bicep
13 2 (0.70%) Ruby
14 1 (0.35%) Data Analysis Expressions
14 1 (0.35%) X++
Qualifications
1 61 (21.33%) Security Cleared
2 55 (19.23%) SC Cleared
3 45 (15.73%) Degree
4 30 (10.49%) Computer Science Degree
5 15 (5.24%) Master's Degree
6 12 (4.20%) AWS Certification
6 12 (4.20%) Cisco Certification
7 9 (3.15%) CCNA
8 8 (2.80%) CCNP
9 6 (2.10%) BPSS Clearance
9 6 (2.10%) CISM
10 5 (1.75%) CISSP
10 5 (1.75%) PMI Certification
11 4 (1.40%) AWS Certified Solutions Architect
11 4 (1.40%) Azure Certification
11 4 (1.40%) CEH
11 4 (1.40%) PMP
12 2 (0.70%) AWS Certified DevOps Engineer
12 2 (0.70%) Microsoft Certification
12 2 (0.70%) OCP
Quality Assurance & Compliance
1 11 (3.85%) Accessibility
2 10 (3.50%) NIST
2 10 (3.50%) QA
3 9 (3.15%) Data Quality
3 9 (3.15%) GDPR
3 9 (3.15%) ISO/IEC 27001
4 6 (2.10%) PCI DSS
5 5 (1.75%) Sarbanes-Oxley
6 4 (1.40%) Disclosure Scotland
7 2 (0.70%) HIPAA
7 2 (0.70%) ISO/IEC 27002 (supersedes ISO/IEC 17799)
7 2 (0.70%) PMO
8 1 (0.35%) 21 CFR Part 11
8 1 (0.35%) California Consumer Privacy Act
8 1 (0.35%) GxP
8 1 (0.35%) IFRS
8 1 (0.35%) NCSC
8 1 (0.35%) WCAG
System Software
1 54 (18.88%) Docker
2 10 (3.50%) Active Directory
3 4 (1.40%) VMware Infrastructure
4 2 (0.70%) Apache ZooKeeper
4 2 (0.70%) HDFS
5 1 (0.35%) Hyper-V
5 1 (0.35%) OpenAM
5 1 (0.35%) OpenDJ
5 1 (0.35%) OpenIDM
5 1 (0.35%) Virtual Desktop
5 1 (0.35%) Virtual Servers
Systems Management
1 49 (17.13%) Kubernetes
2 41 (14.34%) Terraform
3 21 (7.34%) Ansible
4 15 (5.24%) Grafana
5 13 (4.55%) Prometheus
6 6 (2.10%) Puppet
7 5 (1.75%) Single Sign-On
8 4 (1.40%) Istio
8 4 (1.40%) MOM
9 3 (1.05%) FortiGate
9 3 (1.05%) Kubeflow
9 3 (1.05%) Progress Chef
9 3 (1.05%) SCCM
10 2 (0.70%) Consul
10 2 (0.70%) Kibana
10 2 (0.70%) Microsoft Intune
11 1 (0.35%) Argo
11 1 (0.35%) linkerd
11 1 (0.35%) Packer
11 1 (0.35%) PTC Integrity
Vendors
1 35 (12.24%) Microsoft
2 18 (6.29%) Oracle
3 13 (4.55%) Google
4 11 (3.85%) Cisco
4 11 (3.85%) SAP
5 8 (2.80%) Red Hat
5 8 (2.80%) ServiceNow
5 8 (2.80%) VMware
6 5 (1.75%) ForgeRock
7 4 (1.40%) Arista
7 4 (1.40%) Ping Identity
7 4 (1.40%) Rockwell
7 4 (1.40%) Salesforce
7 4 (1.40%) Siemens
8 3 (1.05%) CyberArk
8 3 (1.05%) Databricks
8 3 (1.05%) IBM
8 3 (1.05%) MuleSoft
8 3 (1.05%) Splunk
9 2 (0.70%) Dynatrace