Infrastructure Engineering Contracts with Hybrid/Remote/WFH Options

Infrastructure Engineering
UK > Work from Home

The table below provides summary statistics for remote or hybrid contract work requiring Infrastructure Engineering skills. It includes a benchmarking guide to the contractor rates offered in vacancies that cited Infrastructure Engineering over the 6 months leading up to 1 May 2025, comparing them to the same period in the previous two years.

6 months to
1 May 2025
Same period 2024 Same period 2023
Rank 167 143 129
Rank change year-on-year -24 -14 +59
Contract jobs citing Infrastructure Engineering 140 228 488
As % of all contract jobs with a WFH option 1.41% 1.49% 1.89%
As % of the Processes & Methodologies category 1.55% 1.69% 2.10%
Number of daily rates quoted 102 167 370
10th Percentile £363 £275 £315
25th Percentile £431 £350 £413
Median daily rate (50th Percentile) £536 £465 £525
Median % change year-on-year +15.28% -11.43% +13.51%
75th Percentile £600 £594 £638
90th Percentile £650 £670 £700
UK median daily rate £525 £500 £525
% change year-on-year +5.00% -4.76% +10.53%
Number of hourly rates quoted 2 9 7
10th Percentile £65.63 £37.47 £51.70
25th Percentile £66.56 £37.63 £54.13
Median hourly rate £68.75 £40.31 £57.50
Median % change year-on-year +70.55% -29.90% -1.29%
75th Percentile £71.56 £70.00 £72.38
90th Percentile £72.88 £71.50 £86.92
UK median hourly rate £62.50 £46.18 £61.62
% change year-on-year +35.34% -25.05% +23.23%

All Process and Methodology Skills
Work from Home

Infrastructure Engineering falls under the Processes and Methodologies category. For comparison with the information above, the following table provides summary statistics for all contract job vacancies with remote or hybrid options requiring process or methodology skills.

Contract vacancies with a requirement for process or methodology skills 9,021 13,483 23,229
As % of all contract jobs with a WFH option 91.08% 87.87% 89.84%
Number of daily rates quoted 6,191 8,996 16,418
10th Percentile £340 £325 £363
25th Percentile £419 £425 £450
Median daily rate (50th Percentile) £525 £525 £540
Median % change year-on-year - -2.78% +2.86%
75th Percentile £638 £638 £650
90th Percentile £763 £750 £750
UK median daily rate £520 £525 £550
% change year-on-year -0.95% -4.55% +4.76%
Number of hourly rates quoted 224 579 532
10th Percentile £14.20 £15.17 £19.00
25th Percentile £19.56 £25.25 £30.54
Median hourly rate £39.52 £43.00 £55.00
Median % change year-on-year -8.09% -21.82% +57.14%
75th Percentile £66.13 £60.00 £68.75
90th Percentile £75.00 £75.25 £80.23
UK median hourly rate £29.00 £35.65 £37.30
% change year-on-year -18.65% -4.42% +49.20%

Infrastructure Engineering
Trend for Jobs with a WFH Option

Job vacancies with remote working options citing Infrastructure Engineering as a proportion of all IT jobs advertised.
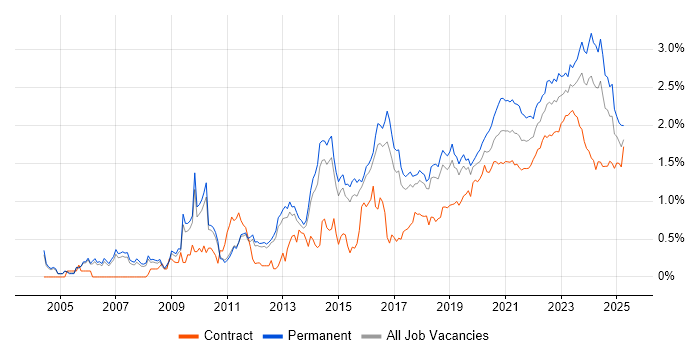
Infrastructure Engineering trend for jobs with Hybrid/Remote/WFH options

Infrastructure Engineering
Daily Rate Trend for Jobs with a WFH Option

3-month moving average daily rate quoted in job vacancies with remote working options citing Infrastructure Engineering.

Infrastructure Engineering daily rate for jobs with a WFH option

Infrastructure Engineering
Daily Rate Histogram for Jobs with a WFH Option

Daily rate distribution for jobs with remote working options citing Infrastructure Engineering over the 6 months to 1 May 2025.

Infrastructure Engineering daily rate histogram for jobs with a WFH option

Infrastructure Engineering
Hourly Rate Trend for Jobs with a WFH Option

3-month moving average hourly rate quoted in job vacancies with remote working options citing Infrastructure Engineering.

Infrastructure Engineering hourly rate for jobs with a WFH option

Infrastructure Engineering
Co-occurring Skills and Capabilities with WFH Options by Category

The follow tables expand on the table above by listing co-occurrences grouped by category. The same employment type, locality and period is covered with up to 20 co-occurrences shown in each of the following categories:

Application Platforms
1 14 (10.00%) Confluence
2 12 (8.57%) Microsoft Exchange
3 11 (7.86%) SharePoint
4 2 (1.43%) IIS
4 2 (1.43%) OpenStack
4 2 (1.43%) Skype for Business
5 1 (0.71%) Apache
5 1 (0.71%) Apache Spark
5 1 (0.71%) CMS
Applications
1 17 (12.14%) Microsoft Office
2 1 (0.71%) Microsoft Excel
2 1 (0.71%) Microsoft PowerPoint
2 1 (0.71%) Notion
2 1 (0.71%) Trello
Business Applications
1 1 (0.71%) Remedy ITSM
1 1 (0.71%) SAP HCM
1 1 (0.71%) SAP IBP
1 1 (0.71%) SAP S/4HANA
Cloud Services
1 56 (40.00%) Azure
2 28 (20.00%) Microsoft 365
3 24 (17.14%) AWS
4 18 (12.86%) Entra ID
5 7 (5.00%) IaaS
6 4 (2.86%) Azure Data Factory
6 4 (2.86%) SaaS
6 4 (2.86%) Serverless
7 3 (2.14%) Amazon S3
7 3 (2.14%) AWS Lambda
7 3 (2.14%) GitHub
7 3 (2.14%) Mimecast
7 3 (2.14%) Nutanix
7 3 (2.14%) OpenShift
8 2 (1.43%) AWS CloudFormation
8 2 (1.43%) Azure Key Vault
8 2 (1.43%) Dynamics 365
8 2 (1.43%) Power Platform
8 2 (1.43%) Rubrik
8 2 (1.43%) Snowflake
Communications & Networking
1 42 (30.00%) DNS
2 34 (24.29%) DHCP
3 24 (17.14%) Firewall
4 11 (7.86%) WAN
5 9 (6.43%) TCP/IP
6 8 (5.71%) LAN
7 7 (5.00%) Network Security
7 7 (5.00%) Wi-Fi
8 6 (4.29%) SAN
8 6 (4.29%) SD-WAN
8 6 (4.29%) VPN
8 6 (4.29%) Wireless
9 5 (3.57%) Unified Communications
10 4 (2.86%) Internet
11 3 (2.14%) 4G
11 3 (2.14%) Cisco ISE
11 3 (2.14%) HTTP
11 3 (2.14%) SNMP
11 3 (2.14%) VSAN
12 2 (1.43%) Skype
Database & Business Intelligence
1 8 (5.71%) SQL Server
2 4 (2.86%) Oracle Database
3 2 (1.43%) Amazon RDS
3 2 (1.43%) Azure SQL Data Warehouse
3 2 (1.43%) Data Warehouse
3 2 (1.43%) RDBMS
3 2 (1.43%) Relational Database
3 2 (1.43%) SQL Server Integration Services
3 2 (1.43%) SQL Server Reporting Services
4 1 (0.71%) Amazon Redshift
4 1 (0.71%) DynamoDB
4 1 (0.71%) Elasticsearch
4 1 (0.71%) MongoDB
4 1 (0.71%) NoSQL
4 1 (0.71%) SAP HANA
Development Applications
1 16 (11.43%) JIRA
2 5 (3.57%) Bitbucket
2 5 (3.57%) GitLab
3 4 (2.86%) Git
3 4 (2.86%) Jenkins
4 2 (1.43%) ScriptRunner
5 1 (0.71%) Subversion
General
1 41 (29.29%) Social Skills
2 19 (13.57%) Analytical Skills
3 16 (11.43%) Finance
4 15 (10.71%) Public Sector
5 6 (4.29%) Documentation Skills
6 4 (2.86%) Telecoms
7 3 (2.14%) Banking
7 3 (2.14%) Inclusion and Diversity
8 2 (1.43%) Local Government
8 2 (1.43%) Presentation Skills
8 2 (1.43%) Retail
9 1 (0.71%) Advertising
9 1 (0.71%) Aerospace
9 1 (0.71%) Financial Institution
9 1 (0.71%) Military
Job Titles
1 78 (55.71%) Infrastructure Engineer
2 24 (17.14%) Senior
3 13 (9.29%) Senior Infrastructure Engineer
4 12 (8.57%) Lead
5 11 (7.86%) DevOps Engineer
6 10 (7.14%) Virtualisation Engineer
7 9 (6.43%) Architect
8 8 (5.71%) Azure Engineer
9 7 (5.00%) Microsoft 365 Engineer
10 6 (4.29%) Azure Infrastructure Engineer
10 6 (4.29%) IT Engineer
10 6 (4.29%) IT Infrastructure Engineer
11 5 (3.57%) Senior DevOps
11 5 (3.57%) Senior DevOps Engineer
11 5 (3.57%) VMware Engineer
11 5 (3.57%) VMware Infrastructure Engineer
12 4 (2.86%) Active Directory Engineer
12 4 (2.86%) Network Engineer
12 4 (2.86%) Windows Engineer
12 4 (2.86%) Windows Infrastructure Engineer
Libraries, Frameworks & Software Standards
1 10 (7.14%) Flash
2 3 (2.14%) .NET
2 3 (2.14%) Middleware
3 2 (1.43%) REST
3 2 (1.43%) SOAP
4 1 (0.71%) 802.1X
4 1 (0.71%) ARM Templates
4 1 (0.71%) AWS CDK
4 1 (0.71%) Elastic Stack
4 1 (0.71%) HTML
4 1 (0.71%) Kafka
4 1 (0.71%) LDAP
4 1 (0.71%) Loki
4 1 (0.71%) NETCONF
4 1 (0.71%) Node.js
4 1 (0.71%) pytest
4 1 (0.71%) XML
4 1 (0.71%) YAML
Miscellaneous
1 15 (10.71%) Data Centre
2 10 (7.14%) Clustering
3 5 (3.57%) Data Protection Act
3 5 (3.57%) Enterprise Storage
3 5 (3.57%) Hybrid Cloud
3 5 (3.57%) Self-Motivation
4 4 (2.86%) Cloud Native
4 4 (2.86%) Onboarding
5 3 (2.14%) Security Operations Centre
5 3 (2.14%) Video Conferencing
5 3 (2.14%) Virtual Team
6 2 (1.43%) PKI
6 2 (1.43%) Public Cloud
6 2 (1.43%) Wiki
7 1 (0.71%) Analytical Mindset
7 1 (0.71%) Cyber Defence
7 1 (0.71%) Enterprise Cloud
7 1 (0.71%) Enterprise Software
7 1 (0.71%) Private Cloud
7 1 (0.71%) Reinsurance
Operating Systems
1 67 (47.86%) Windows
2 39 (27.86%) Linux
2 39 (27.86%) Windows Server
3 11 (7.86%) Unix
4 9 (6.43%) Windows Server 2019
5 7 (5.00%) Red Hat Enterprise Linux
6 6 (4.29%) Windows Server 2016
7 5 (3.57%) VMS
8 4 (2.86%) AIX
8 4 (2.86%) Windows 10
9 3 (2.14%) Windows Server 2012
10 1 (0.71%) Android
10 1 (0.71%) Solaris
10 1 (0.71%) SUSE
10 1 (0.71%) VyOS
Processes & Methodologies
1 24 (17.14%) DevOps
1 24 (17.14%) ITIL
2 23 (16.43%) Agile
2 23 (16.43%) Problem-Solving
3 20 (14.29%) Infrastructure as Code
4 19 (13.57%) Migration
5 18 (12.86%) High Availability
6 16 (11.43%) CI/CD
7 15 (10.71%) Infrastructure Automation
8 14 (10.00%) Computer Science
9 13 (9.29%) Validation
9 13 (9.29%) Waterfall
10 11 (7.86%) Containerisation
10 11 (7.86%) Network Virtualisation
10 11 (7.86%) NsoIT
10 11 (7.86%) Service Management
10 11 (7.86%) System Testing
11 10 (7.14%) Critical Thinking
11 10 (7.14%) Power Management
12 9 (6.43%) Configuration Management
Programming Languages
1 26 (18.57%) Python
2 22 (15.71%) PowerShell
3 15 (10.71%) Bash
4 12 (8.57%) SQL
5 4 (2.86%) Perl
6 3 (2.14%) Shell Script
7 2 (1.43%) C#
7 2 (1.43%) Groovy
7 2 (1.43%) PL/SQL
7 2 (1.43%) T-SQL
7 2 (1.43%) VB
8 1 (0.71%) Bicep
8 1 (0.71%) JavaScript
8 1 (0.71%) VBA
8 1 (0.71%) VBScript
Qualifications
1 38 (27.14%) Security Cleared
2 32 (22.86%) SC Cleared
3 20 (14.29%) Cisco Certification
4 19 (13.57%) Degree
5 14 (10.00%) CCNA
6 12 (8.57%) VMware Certified Professional (VCP)
7 10 (7.14%) Master's Degree
8 7 (5.00%) DV Cleared
9 6 (4.29%) CCNP
10 3 (2.14%) AWS Certification
10 3 (2.14%) Computer Science Degree
11 2 (1.43%) AWS Certified Solutions Architect
11 2 (1.43%) Azure Certification
11 2 (1.43%) ISTQB
12 1 (0.71%) AWS Certified Developer
12 1 (0.71%) CCDE
12 1 (0.71%) CCDP
12 1 (0.71%) CTC Cleared
12 1 (0.71%) Microsoft Certification
12 1 (0.71%) RHCA
Quality Assurance & Compliance
1 4 (2.86%) SLA
2 3 (2.14%) NIST
2 3 (2.14%) QA
3 1 (0.71%) Actionable Recommendations
3 1 (0.71%) Disclosure Scotland
3 1 (0.71%) Sarbanes-Oxley
3 1 (0.71%) SOC 2
System Software
1 49 (35.00%) Active Directory
2 36 (25.71%) VMware Infrastructure
3 13 (9.29%) Docker
4 12 (8.57%) Hyper-V
4 12 (8.57%) VMware ESXi
4 12 (8.57%) VMware NSX
5 6 (4.29%) Virtual Servers
6 4 (2.86%) vSphere
7 3 (2.14%) DFS Replication
7 3 (2.14%) Microsoft Virtual Server
7 3 (2.14%) Virtual Machines
8 1 (0.71%) Apache ZooKeeper
8 1 (0.71%) Firmware
8 1 (0.71%) NFS
8 1 (0.71%) Veritas Cluster Server
8 1 (0.71%) VMware Server
Systems Management
1 26 (18.57%) Ansible
1 26 (18.57%) Terraform
2 16 (11.43%) Kubernetes
3 13 (9.29%) vCenter Server
4 11 (7.86%) Microsoft Intune
5 9 (6.43%) Puppet
5 9 (6.43%) SCCM
6 8 (5.71%) Progress Chef
7 7 (5.00%) NetBackup
7 7 (5.00%) WSUS
8 5 (3.57%) FortiGate
9 1 (0.71%) Argo
9 1 (0.71%) Cloudify
9 1 (0.71%) Grafana
9 1 (0.71%) OfficeScan
9 1 (0.71%) PowerCLI
9 1 (0.71%) Prometheus
9 1 (0.71%) Red Hat Satellite
9 1 (0.71%) Trend Micro Deep Security
9 1 (0.71%) VxRail
Vendors
1 62 (44.29%) VMware
2 38 (27.14%) Microsoft
3 33 (23.57%) Cisco
4 12 (8.57%) Atlassian
5 8 (5.71%) Oracle
5 8 (5.71%) Veritas
6 7 (5.00%) NetApp
7 6 (4.29%) Dell
7 6 (4.29%) HP
7 6 (4.29%) Palo Alto
7 6 (4.29%) Red Hat
8 5 (3.57%) SAP
9 4 (2.86%) 3PAR
9 4 (2.86%) Citrix
9 4 (2.86%) F5
9 4 (2.86%) Veeam
10 3 (2.14%) CyberArk
10 3 (2.14%) Meraki
10 3 (2.14%) SolarWinds
10 3 (2.14%) Zscaler