Video\Live Streaming Jobs in England

Video\Live Streaming
UK > England

The table below looks at the prevalence of the term Video\Live Streaming in permanent job vacancies in England. Included is a benchmarking guide to the salaries offered in vacancies that cited Video\Live Streaming over the 6 months leading up to 20 June 2024, comparing them to the same period in the previous two years.

6 months to
20 Jun 2024
Same period 2023 Same period 2022
Rank 705 767 647
Rank change year-on-year +62 -120 +31
Permanent jobs citing Video\Live Streaming 159 127 648
As % of all permanent jobs advertised in England 0.17% 0.15% 0.45%
As % of the Miscellaneous category 0.50% 0.35% 0.94%
Number of salaries quoted 149 107 192
10th Percentile - £42,000 £41,250
25th Percentile £24,500 £55,000 £56,250
Median annual salary (50th Percentile) £25,000 £75,000 £63,750
Median % change year-on-year -66.67% +17.65% -8.93%
75th Percentile £47,500 £82,500 £81,250
90th Percentile £67,500 £92,500 £95,000
UK median annual salary £25,000 £73,500 £62,500
% change year-on-year -65.99% +17.60% -10.71%

All Generic Skills
England

Video\Live Streaming falls under the General and Transferable Skills category. For comparison with the information above, the following table provides summary statistics for all permanent job vacancies requiring generic IT skills in England.

Permanent vacancies with a requirement for generic IT skills 31,616 35,808 68,983
As % of all permanent jobs advertised in England 33.08% 43.63% 47.75%
Number of salaries quoted 21,236 20,076 30,814
10th Percentile £28,000 £36,125 £34,750
25th Percentile £38,500 £46,872 £46,000
Median annual salary (50th Percentile) £55,000 £65,000 £62,500
Median % change year-on-year -15.38% +4.00% +4.17%
75th Percentile £75,000 £87,419 £85,000
90th Percentile £100,000 £110,000 £105,000
UK median annual salary £55,000 £65,000 £62,500
% change year-on-year -15.38% +4.00% +4.17%

Video\Live Streaming
Job Vacancy Trend in England

Job postings citing Video\Live Streaming as a proportion of all IT jobs advertised in England.
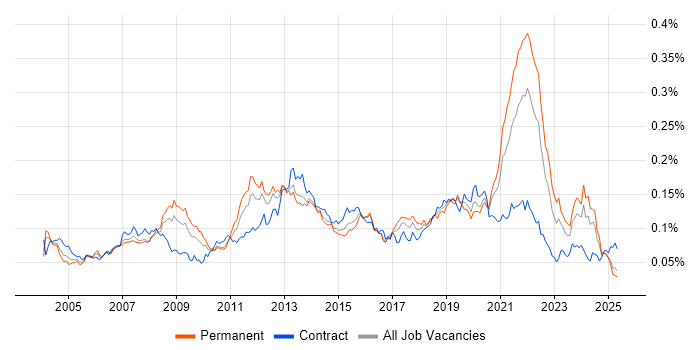
Job vacancy trend for Video\Live Streaming in England

Video\Live Streaming
Salary Trend in England

3-month moving average salary quoted in jobs citing Video\Live Streaming in England.

Salary trend for Video\Live Streaming in England

Video\Live Streaming
Salary Histogram in England

Salary distribution for jobs citing Video\Live Streaming in England over the 6 months to 20 June 2024.

Salary histogram for Video\Live Streaming in England

Video\Live Streaming
Job Locations in England

The table below looks at the demand and provides a guide to the median salaries quoted in IT jobs citing Video\Live Streaming within the England region over the 6 months to 20 June 2024. The 'Rank Change' column provides an indication of the change in demand within each location based on the same 6 month period last year.

Location Rank Change
on Same Period
Last Year
Matching
Permanent
IT Job Ads
Median Salary
Past 6 Months
Median Salary
% Change
on Same Period
Last Year
Live
Jobs
South East +34 89 £25,000 -61.54% 3
London +45 32 £35,595 -55.51% 40
North of England +31 22 £60,000 -12.41% 7
North West -3 21 £60,000 -12.41% 5
Midlands -26 13 £60,000 +81.82%
East Midlands - 7 £77,500 -
West Midlands -6 6 £60,000 +81.82%
East of England -18 3 £28,000 -
Yorkshire - 1 £32,500 - 2
Video\Live Streaming
UK

Video\Live Streaming
Co-occurring Skills and Capabilities in England by Category

The follow tables expand on the table above by listing co-occurrences grouped by category. The same employment type, locality and period is covered with up to 20 co-occurrences shown in each of the following categories:

Application Platforms
1 2 (1.26%) CMS
Applications
1 3 (1.89%) Final Cut Pro
1 3 (1.89%) Microsoft Office
1 3 (1.89%) Pro Tools
2 1 (0.63%) Microsoft Excel
Cloud Services
1 16 (10.06%) AWS
2 8 (5.03%) Azure
3 7 (4.40%) GCP
4 3 (1.89%) Google Workspace
5 1 (0.63%) Power Platform
Communications & Networking
1 6 (3.77%) Wi-Fi
2 2 (1.26%) Bluetooth
2 2 (1.26%) Ethernet
2 2 (1.26%) Internet
Database & Business Intelligence
1 9 (5.66%) MySQL
2 7 (4.40%) NoSQL
3 1 (0.63%) Data Warehouse
3 1 (0.63%) Power BI
Development Applications
1 3 (1.89%) Git
2 1 (0.63%) GDB
2 1 (0.63%) Jenkins
2 1 (0.63%) Valgrind
General
1 106 (66.67%) Social Skills
2 89 (55.97%) Billing
3 12 (7.55%) Games
4 11 (6.92%) Analytical Skills
5 9 (5.66%) Finance
6 6 (3.77%) Manufacturing
7 5 (3.14%) Electronics
7 5 (3.14%) Marketing
8 4 (2.52%) Public Sector
8 4 (2.52%) Telecoms
9 2 (1.26%) Automotive
9 2 (1.26%) Inclusion and Diversity
10 1 (0.63%) Advertising
10 1 (0.63%) iGaming
Job Titles
1 25 (15.72%) Senior
2 23 (14.47%) Developer
3 17 (10.69%) .NET Developer
4 12 (7.55%) Audio Visual Technician
5 11 (6.92%) Lead
6 10 (6.29%) Analyst
7 9 (5.66%) Lead Developer
7 9 (5.66%) Senior Analyst
7 9 (5.66%) Senior Developer
8 7 (4.40%) Lead .NET Developer
8 7 (4.40%) Senior .NET Developer
9 3 (1.89%) Architect
9 3 (1.89%) IT Support
9 3 (1.89%) JavaScript Developer
9 3 (1.89%) Mobile Engineer
9 3 (1.89%) Software Engineer
9 3 (1.89%) Support Officer
9 3 (1.89%) UX Strategist
10 2 (1.26%) Backend Developer
10 2 (1.26%) Senior Backend Developer
Libraries, Frameworks & Software Standards
1 19 (11.95%) .NET
2 10 (6.29%) Web Services
3 8 (5.03%) Kafka
3 8 (5.03%) MSMQ
3 8 (5.03%) RabbitMQ
4 7 (4.40%) .NET Framework
5 4 (2.52%) ASP.NET Web API
5 4 (2.52%) HTML
5 4 (2.52%) WCF
6 3 (1.89%) CSS
6 3 (1.89%) Pixi.js
6 3 (1.89%) React
6 3 (1.89%) React Native
7 2 (1.26%) Alpine.js
7 2 (1.26%) GStreamer
7 2 (1.26%) Laravel
7 2 (1.26%) Node.js
7 2 (1.26%) Qt
7 2 (1.26%) RESTful
7 2 (1.26%) Tailwind CSS
Miscellaneous
1 93 (58.49%) Video Conferencing
2 89 (55.97%) Digital Signage
2 89 (55.97%) Self-Motivation
3 9 (5.66%) Virtual Reality
4 4 (2.52%) Mobile App
5 3 (1.89%) Acoustics
5 3 (1.89%) Embedded Systems
5 3 (1.89%) IoT
5 3 (1.89%) Over-the-Top Content
6 2 (1.26%) Device Driver
6 2 (1.26%) Driving Licence
6 2 (1.26%) Online Games
6 2 (1.26%) Virtual Team
7 1 (0.63%) Augmented Reality
7 1 (0.63%) Social Media
7 1 (0.63%) STB
Operating Systems
1 5 (3.14%) Android
1 5 (3.14%) Linux
2 4 (2.52%) Apple iOS
3 3 (1.89%) Embedded Linux
3 3 (1.89%) Windows
3 3 (1.89%) Windows Server
4 1 (0.63%) tvOS
4 1 (0.63%) Unix
Processes & Methodologies
1 89 (55.97%) Customer Service
1 89 (55.97%) Logistics
1 89 (55.97%) Presales
1 89 (55.97%) Preventative Maintenance
2 26 (16.35%) Agile
3 20 (12.58%) OOP
3 20 (12.58%) Software Testing
4 19 (11.95%) Design Patterns
5 17 (10.69%) Scrum
5 17 (10.69%) TDD
6 14 (8.81%) Performance Optimisation
7 13 (8.18%) Mentoring
8 11 (6.92%) Software Engineering
9 10 (6.29%) Analytics
9 10 (6.29%) Clean Code
9 10 (6.29%) Computer Science
9 10 (6.29%) Functional Testing
9 10 (6.29%) Kanban
10 9 (5.66%) Statistical Modelling
10 9 (5.66%) Visualisation
Programming Languages
1 20 (12.58%) C#
1 20 (12.58%) SQL
2 13 (8.18%) JavaScript
3 7 (4.40%) TypeScript
4 5 (3.14%) Python
5 4 (2.52%) C
6 3 (1.89%) C++
7 2 (1.26%) Java
7 2 (1.26%) PHP
8 1 (0.63%) Shell Script
Qualifications
1 12 (7.55%) Degree
2 9 (5.66%) Computer Science Degree
3 8 (5.03%) AWS Certification
3 8 (5.03%) DBS Check
4 7 (4.40%) Azure Certification
5 1 (0.63%) AWS Certified Solutions Architect
Quality Assurance & Compliance
1 90 (56.60%) SLA
2 4 (2.52%) QA
System Software
1 3 (1.89%) Docker
2 2 (1.26%) Firmware
Systems Management
1 2 (1.26%) Kubernetes
2 1 (0.63%) Grafana
2 1 (0.63%) Progress Chef
2 1 (0.63%) Terraform
Vendors
1 4 (2.52%) Microsoft
1 4 (2.52%) SAP
2 3 (1.89%) Apple
2 3 (1.89%) Google
3 1 (0.63%) Facebook
3 1 (0.63%) Instagram
3 1 (0.63%) Roku
3 1 (0.63%) Samsung