Support Analyst Jobs in England

Support Analyst
UK > England

The median Support Analyst salary in England is £35,000 per year according to job vacancies posted during the 6 months to 27 April 2024.

The first table below provides salary benchmarking and summary statistics including a comparison to same period in the previous 2 years.

6 months to
27 Apr 2024
Same period 2023 Same period 2022
Rank 184 260 251
Rank change year-on-year +76 -9 -6
Permanent jobs requiring a Support Analyst 1,353 1,331 2,106
As % of all permanent jobs advertised in England 1.60% 1.43% 1.61%
As % of the Job Titles category 1.69% 1.56% 1.68%
Number of salaries quoted 1,099 1,092 1,774
10th Percentile £24,000 £24,000 £23,478
25th Percentile £27,487 £27,000 £26,250
Median annual salary (50th Percentile) £35,000 £34,000 £32,500
Median % change year-on-year +2.94% +4.62% -
75th Percentile £47,500 £43,750 £43,750
90th Percentile £57,500 £60,000 £57,500
UK median annual salary £35,640 £33,500 £32,500
% change year-on-year +6.39% +3.08% -

All Permanent IT Job Vacancies
England

The following table is for comparison with the above and includes summary statistics for all permanent IT job vacancies advertised in England. Most job vacancies include a discernible job title that can be normalized. As such, the figures in the second row provide an indication of the number of permanent jobs in our overall sample.

Permanent vacancies in England with a recognized job title 80,117 85,349 125,598
% of permanent jobs with a recognized job title 94.47% 91.55% 96.08%
Number of salaries quoted 59,992 53,990 75,607
10th Percentile £28,500 £32,500 £32,500
25th Percentile £38,000 £45,000 £43,000
Median annual salary (50th Percentile) £53,500 £60,732 £60,000
Median % change year-on-year -11.91% +1.22% +9.09%
75th Percentile £71,991 £82,500 £80,000
90th Percentile £90,000 £100,000 £97,500
UK median annual salary £52,550 £60,000 £60,000
% change year-on-year -12.42% - +9.09%

Support Analyst
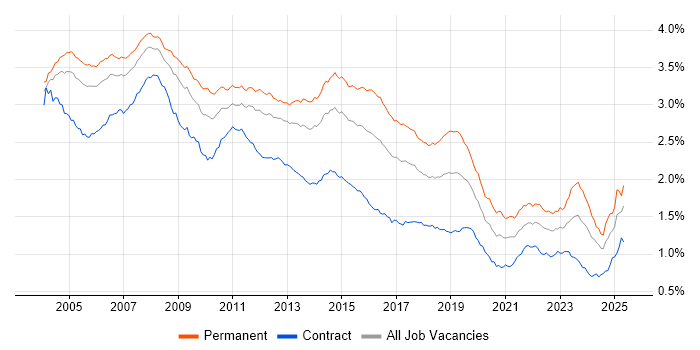
Job Vacancy Trend in England

Job postings that featured Support Analyst in the job title as a proportion of all IT jobs advertised in England.

Job vacancy trend for Support Analyst in England

Support Analyst
Salary Trend in England

3-month moving average salary quoted in jobs citing Support Analyst in England.

Salary trend for Support Analyst in England

Support Analyst
Salary Histogram in England

Salary distribution for jobs citing Support Analyst in England over the 6 months to 27 April 2024.

Salary histogram for Support Analyst in England

Support Analyst
Job Locations in England

The table below looks at the demand and provides a guide to the median salaries quoted in IT jobs citing Support Analyst within the England region over the 6 months to 27 April 2024. The 'Rank Change' column provides an indication of the change in demand within each location based on the same 6 month period last year.

Location Rank Change
on Same Period
Last Year
Matching
Permanent
IT Job Ads
Median Salary
Past 6 Months
Median Salary
% Change
on Same Period
Last Year
Live
Jobs
London +87 444 £45,000 +8.76% 70
South East +75 325 £32,500 +4.84% 28
North of England +54 243 £32,500 - 27
Midlands -3 158 £30,000 0.00% 22
North West +28 139 £32,500 -2.99% 16
Yorkshire +85 98 £31,500 -1.50% 9
East of England +35 98 £30,000 +4.35% 19
West Midlands +6 91 £33,000 +1.84% 6
South West -17 85 £33,250 +10.83% 24
East Midlands -6 67 £27,000 -1.82% 16
North East -5 6 £30,500 -18.67% 4
Support Analyst
UK

Support Analyst Skill Set
Top 30 Co-occurring Skills and Capabilities in England

For the 6 months to 27 April 2024, Support Analyst job roles required the following skills and capabilities in order of popularity. The figures indicate the absolute number co-occurrences and as a proportion of all permanent job ads across the England region featuring Support Analyst in the job title.

1 480 (35.48%) Social Skills
2 450 (33.26%) Windows
3 439 (32.45%) Microsoft
4 365 (26.98%) Microsoft 365
5 339 (25.06%) SQL
6 334 (24.69%) Active Directory
7 305 (22.54%) ITIL
8 302 (22.32%) Customer Service
9 292 (21.58%) Problem-Solving
10 284 (20.99%) Finance
11 234 (17.29%) Azure
12 219 (16.19%) Microsoft Office
13 197 (14.56%) Windows 10
14 183 (13.53%) Degree
15 160 (11.83%) Microsoft Exchange
16 157 (11.60%) Analytical Skills
17 154 (11.38%) SLA
18 138 (10.20%) SQL Server
19 131 (9.68%) Service Management
20 125 (9.24%) ITSM
20 125 (9.24%) Windows Server
21 118 (8.72%) SharePoint
22 117 (8.65%) ERP
23 108 (7.98%) Linux
24 104 (7.69%) Incident Management
25 98 (7.24%) Oracle
26 90 (6.65%) Change Management
27 88 (6.50%) DNS
28 82 (6.06%) VMware
28 82 (6.06%) Law

Support Analyst Skill Set
Co-occurring Skills and Capabilities in England by Category

The follow tables expand on the table above by listing co-occurrences grouped by category. The same employment type, locality and period is covered with up to 20 co-occurrences shown in each of the following categories:

Application Platforms
1 160 (11.83%) Microsoft Exchange
2 118 (8.72%) SharePoint
3 37 (2.73%) WebLogic
4 15 (1.11%) Oracle Service Bus
5 9 (0.67%) CMS
5 9 (0.67%) Confluence
5 9 (0.67%) IIS
6 5 (0.37%) Oracle Workflow
6 5 (0.37%) Skype for Business
7 4 (0.30%) Exchange Server 2010
7 4 (0.30%) Exchange Server 2013
8 3 (0.22%) Apache
8 3 (0.22%) EPiServer
8 3 (0.22%) GlassFish
8 3 (0.22%) JBoss
8 3 (0.22%) Moodle
8 3 (0.22%) Tomcat
Applications
1 219 (16.19%) Microsoft Office
2 55 (4.07%) Microsoft Excel
3 21 (1.55%) MS Visio
4 9 (0.67%) Microsoft PowerPoint
5 6 (0.44%) LightWave 3D
6 2 (0.15%) S-PLUS
6 2 (0.15%) Spreadsheet
7 1 (0.074%) Microsoft Project
7 1 (0.074%) Trello
Business Applications
1 52 (3.84%) Dynamics CRM
2 18 (1.33%) Dynamics NAV
3 16 (1.18%) NEC Housing
4 15 (1.11%) Remedy ITSM
5 14 (1.03%) Dynamics GP
6 12 (0.89%) PlanetPress Connect
7 11 (0.81%) Elite 3E
7 11 (0.81%) Fidessa
8 10 (0.74%) SAP S/4HANA
9 8 (0.59%) Epicor Tropos
9 8 (0.59%) Oracle ERP
10 7 (0.52%) Endur
11 6 (0.44%) Carpe Diem
11 6 (0.44%) Infor SunSystems
11 6 (0.44%) ION MarketView
11 6 (0.44%) Oracle EBS R12
12 5 (0.37%) ION Anvil
12 5 (0.37%) NetSuite
12 5 (0.37%) Oracle Applications
12 5 (0.37%) Oracle Payroll
Cloud Services
1 365 (26.98%) Microsoft 365
2 234 (17.29%) Azure
3 67 (4.95%) Entra ID
4 64 (4.73%) Dynamics 365
5 48 (3.55%) AWS
5 48 (3.55%) Power Platform
6 35 (2.59%) SaaS
7 17 (1.26%) WhatsApp
8 13 (0.96%) Power Automate
9 12 (0.89%) Google Workspace
10 11 (0.81%) PowerApps
11 10 (0.74%) Mimecast
12 9 (0.67%) OneDrive
13 7 (0.52%) Amazon CloudWatch
14 6 (0.44%) Azure Data Factory
14 6 (0.44%) GCP
15 5 (0.37%) Google Sheets
16 4 (0.30%) Amazon S3
17 3 (0.22%) Azure Sentinel
17 3 (0.22%) PaaS
Communications & Networking
1 88 (6.50%) DNS
2 80 (5.91%) DHCP
3 68 (5.03%) Firewall
4 62 (4.58%) VPN
5 59 (4.36%) WAN
6 56 (4.14%) LAN
6 56 (4.14%) TCP/IP
7 32 (2.37%) Wi-Fi
8 30 (2.22%) Internet
9 27 (2.00%) VoIP
10 21 (1.55%) Wireless
11 13 (0.96%) Broadband
12 11 (0.81%) FIX Connectivity
12 11 (0.81%) WLAN
13 10 (0.74%) Remote Desktop
14 9 (0.67%) Intranet
14 9 (0.67%) VLAN
15 8 (0.59%) Cisco IOS
15 8 (0.59%) Skype
16 7 (0.52%) SAN
Database & Business Intelligence
1 138 (10.20%) SQL Server
2 33 (2.44%) Power BI
3 32 (2.37%) SQL Server Integration Services
4 31 (2.29%) Oracle Database
5 23 (1.70%) SQL Server Reporting Services
6 22 (1.63%) Elasticsearch
7 15 (1.11%) Oracle Database 10g
7 15 (1.11%) Oracle Database 11g
7 15 (1.11%) VLDB
8 14 (1.03%) Data Warehouse
9 13 (0.96%) MySQL
10 11 (0.81%) Oracle Reports
11 10 (0.74%) Relational Database
12 6 (0.44%) BusinessObjects
13 4 (0.30%) Crystal Reports
14 3 (0.22%) Oracle Database 12c
14 3 (0.22%) SAP HANA
14 3 (0.22%) Tableau
15 2 (0.15%) MongoDB
15 2 (0.15%) NoSQL
Development Applications
1 45 (3.33%) JIRA
2 12 (0.89%) SQL Server Management Studio (SSMS)
3 11 (0.81%) Eclipse
4 5 (0.37%) Toad
4 5 (0.37%) Visual Studio
5 4 (0.30%) Jenkins
5 4 (0.30%) Postman
6 3 (0.22%) Octopus Deploy
6 3 (0.22%) TeamCity
General
1 480 (35.48%) Social Skills
2 284 (20.99%) Finance
3 157 (11.60%) Analytical Skills
4 82 (6.06%) Law
5 73 (5.40%) Legal
6 57 (4.21%) Banking
6 57 (4.21%) Manufacturing
7 56 (4.14%) Front Office
8 52 (3.84%) Retail
9 32 (2.37%) Telecoms
10 29 (2.14%) Marketing
11 28 (2.07%) Inclusion and Diversity
12 23 (1.70%) Public Sector
13 22 (1.63%) Police
14 17 (1.26%) Back Office
15 13 (0.96%) Organisational Skills
16 12 (0.89%) Documentation Skills
16 12 (0.89%) Presentation Skills
17 10 (0.74%) Investment Banking
18 9 (0.67%) Billing
Libraries, Frameworks & Software Standards
1 29 (2.14%) .NET
2 27 (2.00%) FIX Protocol
3 22 (1.63%) J2EE
3 22 (1.63%) Java EE
3 22 (1.63%) Spring
4 10 (0.74%) HTML
4 10 (0.74%) REST
5 9 (0.67%) Oracle Fusion
6 8 (0.59%) JSON
6 8 (0.59%) Middleware
6 8 (0.59%) Web Services
6 8 (0.59%) XML
7 6 (0.44%) OLE
8 4 (0.30%) .NET Framework
8 4 (0.30%) ASP.NET
8 4 (0.30%) SAML
9 3 (0.22%) CSS
9 3 (0.22%) SOAP
9 3 (0.22%) Software Packaging
9 3 (0.22%) XSLT
Miscellaneous
1 45 (3.33%) Management Information System
2 41 (3.03%) Driving Licence
3 35 (2.59%) Self-Motivation
4 26 (1.92%) Onboarding
5 23 (1.70%) Video Conferencing
6 21 (1.55%) Enterprise Software
7 19 (1.40%) Product Ownership
8 17 (1.26%) Replication
9 15 (1.11%) Foreign Exchange (FX)
9 15 (1.11%) iPad
10 11 (0.81%) Analytical Mindset
10 11 (0.81%) e-Learning
10 11 (0.81%) Eurex
10 11 (0.81%) Life Science
10 11 (0.81%) Mobile App
11 10 (0.74%) CCTV
11 10 (0.74%) Housing Association
12 8 (0.59%) iPhone
13 7 (0.52%) Smartphone
13 7 (0.52%) Social Media
Operating Systems
1 450 (33.26%) Windows
2 197 (14.56%) Windows 10
3 125 (9.24%) Windows Server
4 108 (7.98%) Linux
5 79 (5.84%) Unix
6 39 (2.88%) Apple iOS
7 29 (2.14%) Mac OS
7 29 (2.14%) Solaris
8 27 (2.00%) Android
9 21 (1.55%) Windows Server 2016
9 21 (1.55%) Windows Server 2019
10 19 (1.40%) Windows 7
11 11 (0.81%) CentOS
11 11 (0.81%) Ubuntu
11 11 (0.81%) Windows Server 2008
11 11 (0.81%) Windows Server 2012
12 9 (0.67%) Mac OS X
13 6 (0.44%) Red Hat Enterprise Linux
14 3 (0.22%) AIX
15 2 (0.15%) Windows Vista
Processes & Methodologies
1 305 (22.54%) ITIL
2 302 (22.32%) Customer Service
3 292 (21.58%) Problem-Solving
4 131 (9.68%) Service Management
5 125 (9.24%) ITSM
6 117 (8.65%) ERP
7 104 (7.69%) Incident Management
8 90 (6.65%) Change Management
9 81 (5.99%) CRM
10 68 (5.03%) Service Delivery
11 62 (4.58%) Agile
12 55 (4.07%) Continuous Improvement
13 53 (3.92%) Problem Management
14 48 (3.55%) Project Management
15 47 (3.47%) Actionable Insight
16 40 (2.96%) Business Intelligence
17 38 (2.81%) Asset Management
18 35 (2.59%) Release Management
19 34 (2.51%) Root Cause Analysis
20 32 (2.37%) Document Management
Programming Languages
1 339 (25.06%) SQL
2 66 (4.88%) T-SQL
3 62 (4.58%) PowerShell
4 36 (2.66%) PL/SQL
5 34 (2.51%) Java
6 32 (2.37%) C#
7 30 (2.22%) Python
8 25 (1.85%) Shell Script
9 22 (1.63%) JavaScript
10 19 (1.40%) Bash
11 14 (1.03%) Perl
12 11 (0.81%) Ruby
13 8 (0.59%) C
14 6 (0.44%) VBA
15 3 (0.22%) COBOL
15 3 (0.22%) XPath
16 2 (0.15%) VB
17 1 (0.074%) MATLAB
17 1 (0.074%) PHP
17 1 (0.074%) VB.NET
Qualifications
1 183 (13.53%) Degree
2 68 (5.03%) Security Cleared
3 44 (3.25%) SC Cleared
4 43 (3.18%) Microsoft Certification
5 22 (1.63%) A+ Certification
6 18 (1.33%) Computer Science Degree
7 13 (0.96%) CCNA
7 13 (0.96%) Cisco Certification
8 12 (0.89%) Network+ Certification
9 11 (0.81%) DV Cleared
9 11 (0.81%) MCP
9 11 (0.81%) MCSA
10 10 (0.74%) ITIL Certification
10 10 (0.74%) PRINCE2 Practitioner
11 8 (0.59%) CREST Certified
11 8 (0.59%) MCITP
12 7 (0.52%) MCDST
12 7 (0.52%) NVQ Level 3
13 5 (0.37%) MCSE
13 5 (0.37%) PhD
Quality Assurance & Compliance
1 154 (11.38%) SLA
2 13 (0.96%) ISO/IEC 27001
3 11 (0.81%) Cyber Essentials
3 11 (0.81%) PMO
4 9 (0.67%) Data Quality
5 7 (0.52%) GDPR
5 7 (0.52%) QA
6 2 (0.15%) Accessibility
6 2 (0.15%) ISO 9001
6 2 (0.15%) PCI DSS
6 2 (0.15%) Sarbanes-Oxley
7 1 (0.074%) Cyber Essentials PLUS
7 1 (0.074%) HMG Security Policy Framework
System Software
1 334 (24.69%) Active Directory
2 60 (4.43%) VMware Infrastructure
3 26 (1.92%) Hyper-V
4 15 (1.11%) Oracle RAC
4 15 (1.11%) Virtual Desktop
5 8 (0.59%) vSphere
6 6 (0.44%) XenApp
6 6 (0.44%) XenDesktop
7 4 (0.30%) Microsoft Virtual Server
7 4 (0.30%) Virtual Servers
7 4 (0.30%) VMware Workstation
8 3 (0.22%) VMware ESXi
9 2 (0.15%) Virtual Machines
Systems Management
1 81 (5.99%) Microsoft Intune
2 70 (5.17%) SCCM
3 27 (2.00%) Single Sign-On
4 23 (1.70%) Jamf Pro
5 22 (1.63%) OpenSSO
6 15 (1.11%) Data Guard
6 15 (1.11%) Oracle RMAN
7 7 (0.52%) WSUS
8 5 (0.37%) Systems Management Server (SMS)
9 4 (0.30%) AirWatch
9 4 (0.30%) Backup Exec
9 4 (0.30%) McAfee ePO
9 4 (0.30%) WhatsUp Gold
10 3 (0.22%) FortiGate
10 3 (0.22%) Grafana
10 3 (0.22%) Nessus
10 3 (0.22%) Oracle Statspack
10 3 (0.22%) PaperCut
10 3 (0.22%) Progress Chef
10 3 (0.22%) ZENworks
Vendors
1 439 (32.45%) Microsoft
2 98 (7.24%) Oracle
3 82 (6.06%) VMware
4 64 (4.73%) Cisco
5 49 (3.62%) Bloomberg
6 45 (3.33%) ServiceNow
7 43 (3.18%) Remedy
8 40 (2.96%) Apple
9 38 (2.81%) Citrix
10 30 (2.22%) SAP
11 26 (1.92%) ION Trading
12 24 (1.77%) HP
13 23 (1.70%) Veeam
14 21 (1.55%) Dell
15 19 (1.40%) Google
15 19 (1.40%) Meraki
16 18 (1.33%) Sun
17 17 (1.26%) iManage
17 17 (1.26%) Red Hat
17 17 (1.26%) Salesforce