Algorithms Job Trends in England

Algorithms
UK > England

The table below looks at the prevalence of the term Algorithms in permanent job vacancies in England. Included is a benchmarking guide to the salaries offered in vacancies that cited Algorithms over the 6 months leading up to 10 November 2025, comparing them to the same period in the previous two years.

6 months to
10 Nov 2025
Same period 2024 Same period 2023
Rank 240 229 272
Rank change year-on-year -11 +43 -132
Permanent jobs citing Algorithms 491 695 547
As % of all permanent jobs in England 1.10% 1.15% 1.14%
As % of the Miscellaneous category 2.89% 3.47% 2.95%
Number of salaries quoted 227 343 371
10th Percentile £37,470 £46,250 £42,000
25th Percentile £47,500 £55,000 £52,500
Median annual salary (50th Percentile) £70,600 £67,500 £75,000
Median % change year-on-year +4.59% -10.00% +3.45%
75th Percentile £113,125 £85,000 £100,000
90th Percentile £145,000 £107,000 £140,000
UK median annual salary £70,600 £67,500 £72,500
% change year-on-year +4.59% -6.90% -

All Generic Skills
England

Algorithms falls under the General and Transferable Skills category. For comparison with the information above, the following table provides summary statistics for all permanent job vacancies requiring generic IT skills in England.

Permanent vacancies with a requirement for generic IT skills 16,999 20,021 18,566
As % of all permanent jobs advertised in England 38.25% 33.16% 38.77%
Number of salaries quoted 9,533 9,563 13,834
10th Percentile £27,707 £33,750 £34,000
25th Percentile £36,000 £46,250 £46,250
Median annual salary (50th Percentile) £53,750 £60,000 £62,500
Median % change year-on-year -10.42% -4.00% -0.79%
75th Percentile £77,500 £85,000 £85,000
90th Percentile £105,000 £112,500 £110,000
UK median annual salary £53,459 £60,000 £62,500
% change year-on-year -10.90% -4.00% -

Algorithms
Job Vacancy Trend in England

Historical trend showing the proportion of permanent IT job postings citing Algorithms relative to all permanent IT jobs advertised in England.
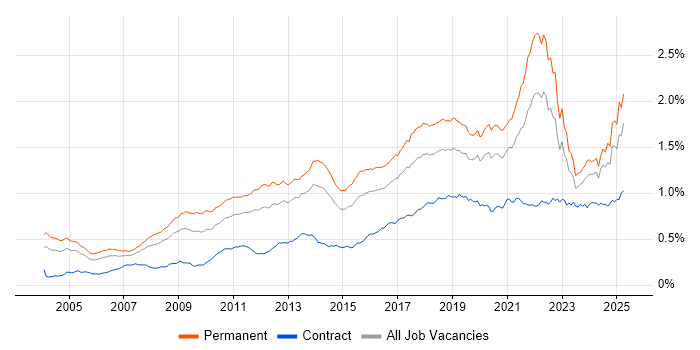
Algorithms job vacancy trend in England

Algorithms
Salary Trend in England

Salary distribution trend for jobs in England citing Algorithms.

Salary distribution trend for jobs in England citing Algorithms

Algorithms
Salary Histogram in England

Salary distribution for jobs citing Algorithms in England over the 6 months to 10 November 2025.

Salary histogram for Algorithms in England

Algorithms
Job Locations in England

The table below looks at the demand and provides a guide to the median salaries quoted in IT jobs citing Algorithms within the England region over the 6 months to 10 November 2025. The 'Rank Change' column provides an indication of the change in demand within each location based on the same 6 month period last year.

Location Rank Change
on Same Period
Last Year
Matching
Permanent
IT Job Ads
Median Salary
Past 6 Months
Median Salary
% Change
on Same Period
Last Year
Live
Jobs
London +49 258 £110,000 +37.50% 659
South East -59 88 £65,000 -3.70% 556
East of England +38 57 £55,000 -12.00% 94
South West -15 42 £40,792 -37.24% 51
North of England +6 18 £35,000 -41.18% 110
Midlands +26 17 £68,750 +19.57% 44
North West +6 11 £41,750 -26.12% 70
West Midlands +18 10 £60,000 +14.29% 22
Yorkshire +19 7 £35,000 -47.37% 15
East Midlands +16 5 £75,900 +12.44% 22
Algorithms
UK

Algorithms
Co-Occurring Skills & Capabilities in England by Category

The following tables expand on the one above by listing co-occurrences grouped by category. They cover the same employment type, locality and period, with up to 20 co-occurrences shown in each category:

Application Platforms
1 22 (4.48%) Kinematics
2 14 (2.85%) Apache Spark
3 10 (2.04%) Apache Airflow
4 7 (1.43%) CMS
5 4 (0.81%) WordPress
6 3 (0.61%) Kentico
6 3 (0.61%) Microsoft Exchange
6 3 (0.61%) Umbraco
7 2 (0.41%) Luigi
8 1 (0.20%) Apache
8 1 (0.20%) Jupyter
8 1 (0.20%) SharePoint
Applications
1 8 (1.63%) Microsoft Excel
2 7 (1.43%) Simulink
3 6 (1.22%) Microsoft Office
4 4 (0.81%) Microsoft PowerPoint
5 3 (0.61%) Adobe Creative Suite
5 3 (0.61%) Adobe Premiere
5 3 (0.61%) Final Cut Pro
6 2 (0.41%) MS Visio
6 2 (0.41%) Spreadsheet
7 1 (0.20%) GNU Octave
7 1 (0.20%) Mathcad
7 1 (0.20%) OrCAD
Business Applications
1 2 (0.41%) Dynamics CRM
1 2 (0.41%) Shopify
Cloud Services
1 61 (12.42%) AWS
2 55 (11.20%) Azure
3 31 (6.31%) GCP
4 22 (4.48%) Google Analytics
5 16 (3.26%) Power Platform
6 15 (3.05%) Vertex AI
7 9 (1.83%) Amazon EKS
7 9 (1.83%) Azure Machine Learning
8 8 (1.63%) GitHub
9 7 (1.43%) Google Sheets
9 7 (1.43%) Google Workspace
10 6 (1.22%) Azure Data Factory
10 6 (1.22%) Google Docs
11 5 (1.02%) Amazon SageMaker
11 5 (1.02%) Azure DevOps
11 5 (1.02%) Snowflake
12 4 (0.81%) Amazon S3
12 4 (0.81%) Google Tag Manager
12 4 (0.81%) Microsoft Purview
13 3 (0.61%) Cloud Computing
Communications & Networking
1 9 (1.83%) Software-Defined Radio
2 8 (1.63%) Multicast
3 3 (0.61%) Internet
4 2 (0.41%) Broadband
4 2 (0.41%) S/MIME
4 2 (0.41%) SSL
4 2 (0.41%) TCP/IP
4 2 (0.41%) X.509
5 1 (0.20%) Bluetooth
5 1 (0.20%) Wireless
Database & Business Intelligence
1 32 (6.52%) NoSQL
2 22 (4.48%) Big Data
3 20 (4.07%) PostgreSQL
4 19 (3.87%) Metadata
5 16 (3.26%) Power BI
6 15 (3.05%) Data Mining
6 15 (3.05%) MongoDB
7 14 (2.85%) Data Lake
7 14 (2.85%) Relational Database
8 10 (2.04%) Looker
8 10 (2.04%) MySQL
9 8 (1.63%) Tableau
10 6 (1.22%) DB2
10 6 (1.22%) KDB
11 5 (1.02%) Redis
12 4 (0.81%) Elasticsearch
12 4 (0.81%) Oracle Database
13 3 (0.61%) BigQuery
13 3 (0.61%) GIS
13 3 (0.61%) Hadoop
Development Applications
1 36 (7.33%) Rational DOORS
2 20 (4.07%) Git
3 15 (3.05%) JIRA
4 9 (1.83%) MLflow
5 7 (1.43%) Vite
6 5 (1.02%) GitLab
7 4 (0.81%) Jenkins
8 3 (0.61%) TestRail
9 2 (0.41%) Cypress.io
9 2 (0.41%) JConsole
9 2 (0.41%) Selenium
9 2 (0.41%) Visual Studio
9 2 (0.41%) VisualVM
10 1 (0.20%) Bazaar
10 1 (0.20%) Cucumber
General
1 177 (36.05%) Finance
2 128 (26.07%) Social Skills
3 114 (23.22%) Law
4 78 (15.89%) Inclusion and Diversity
5 77 (15.68%) Analytical Skills
5 77 (15.68%) Electronics
6 71 (14.46%) Marketing
7 68 (13.85%) Banking
8 49 (9.98%) Front Office
9 41 (8.35%) Games
10 28 (5.70%) Presentation Skills
11 21 (4.28%) Investment Banking
11 21 (4.28%) Retail
12 16 (3.26%) Public Sector
13 15 (3.05%) Advertising
14 12 (2.44%) Financial Institution
15 11 (2.24%) Legal
15 11 (2.24%) Manufacturing
16 8 (1.63%) Aerospace
17 7 (1.43%) Organisational Skills
Job Titles
1 98 (19.96%) Software Engineer
2 97 (19.76%) Senior
3 79 (16.09%) Developer
4 74 (15.07%) Lead
5 39 (7.94%) Quantitative Developer
6 38 (7.74%) Systems Engineer
7 34 (6.92%) Principal Engineer
8 31 (6.31%) Artificial Intelligence Engineer
9 29 (5.91%) Principal Systems Engineer
10 28 (5.70%) Java Engineer
10 28 (5.70%) Python Engineer
11 26 (5.30%) Java Software Engineer
11 26 (5.30%) Python Software Engineer
11 26 (5.30%) Senior Software Engineer
12 24 (4.89%) C++ Developer
12 24 (4.89%) Data Scientist
13 23 (4.68%) Python Developer
14 22 (4.48%) Robotics Engineer
14 22 (4.48%) Senior Developer
15 21 (4.28%) C++ Quantitative Developer
Libraries, Frameworks & Software Standards
1 36 (7.33%) Kafka
2 35 (7.13%) React
3 28 (5.70%) Boost C++ Libraries
4 22 (4.48%) Middleware
5 21 (4.28%) REST
5 21 (4.28%) TensorFlow
6 18 (3.67%) PyTorch
6 18 (3.67%) Spring
7 17 (3.46%) HTML
8 16 (3.26%) CSS
8 16 (3.26%) FIX Protocol
9 14 (2.85%) scikit-learn
10 11 (2.24%) Django
11 10 (2.04%) AngularJS
11 10 (2.04%) FHIR
11 10 (2.04%) OAuth
11 10 (2.04%) OpenID
12 9 (1.83%) Flask
13 8 (1.63%) pytest
13 8 (1.63%) Spring Boot
Miscellaneous
1 77 (15.68%) Data Structures
2 51 (10.39%) Equities
3 45 (9.16%) Distributed Systems
4 29 (5.91%) Robotics
5 27 (5.50%) Hedge funds
6 26 (5.30%) Management Information System
7 23 (4.68%) Derivative
8 22 (4.48%) Cloud Native
9 17 (3.46%) Product Ownership
9 17 (3.46%) Public Cloud
10 16 (3.26%) Foreign Exchange (FX)
10 16 (3.26%) Self-Motivation
11 14 (2.85%) Greenfield Project
11 14 (2.85%) Social Media
12 13 (2.65%) Fixed Income
13 11 (2.24%) Life Science
14 10 (2.04%) Analytical Mindset
14 10 (2.04%) Omics
15 8 (1.63%) Equity Derivative
15 8 (1.63%) Private Cloud
Operating Systems
1 52 (10.59%) Linux
2 12 (2.44%) Unix
3 9 (1.83%) Windows
4 7 (1.43%) Android
4 7 (1.43%) Apple iOS
5 1 (0.20%) FreeRTOS
5 1 (0.20%) Robot Operating System
5 1 (0.20%) Windows Server
Processes & Methodologies
1 193 (39.31%) AI
2 174 (35.44%) Software Engineering
3 156 (31.77%) Machine Learning
4 154 (31.36%) Analytics
5 125 (25.46%) Agile
6 113 (23.01%) Computer Science
6 113 (23.01%) Problem-Solving
7 93 (18.94%) SDLC
8 91 (18.53%) Data Science
9 83 (16.90%) Mathematics
10 79 (16.09%) Visualisation
11 75 (15.27%) Statistics
12 70 (14.26%) Low Latency
13 66 (13.44%) CI/CD
14 61 (12.42%) OO
15 58 (11.81%) Continuous Improvement
16 57 (11.61%) Data Analytics
16 57 (11.61%) Signal Processing
17 54 (11.00%) DevOps
18 51 (10.39%) Business Strategy
Programming Languages
1 232 (47.25%) Python
2 108 (22.00%) C++
3 91 (18.53%) Java
4 81 (16.50%) SQL
5 51 (10.39%) C
6 36 (7.33%) C#
7 22 (4.48%) TypeScript
8 20 (4.07%) JavaScript
9 15 (3.05%) MATLAB
10 13 (2.65%) R
11 8 (1.63%) Shell Script
12 7 (1.43%) Bash
12 7 (1.43%) Kotlin
12 7 (1.43%) Scala
13 6 (1.22%) Rust
14 4 (0.81%) Fortran
14 4 (0.81%) Go
15 3 (0.61%) Assembly Language
15 3 (0.61%) Tcl
15 3 (0.61%) VC++
Qualifications
1 165 (33.60%) Degree
2 95 (19.35%) Master's Degree
3 90 (18.33%) PhD
4 51 (10.39%) BPSS Clearance
5 33 (6.72%) Security Cleared
6 27 (5.50%) Computer Science Degree
7 26 (5.30%) SC Cleared
8 9 (1.83%) CISM
8 9 (1.83%) CISSP
9 8 (1.63%) DV Cleared
10 7 (1.43%) CISA
10 7 (1.43%) CRISC
11 4 (0.81%) ISTQB
12 2 (0.41%) AWS Certification
12 2 (0.41%) AWS Certified Developer
12 2 (0.41%) CompTIA Security+
12 2 (0.41%) DBS Check
12 2 (0.41%) Numerate Degree
13 1 (0.20%) A+ Certification
13 1 (0.20%) MCP
Quality Assurance & Compliance
1 38 (7.74%) ISO/IEC 15288
2 22 (4.48%) Data Quality
3 14 (2.85%) Accessibility
3 14 (2.85%) QA
4 10 (2.04%) CDISC
4 10 (2.04%) GxP
4 10 (2.04%) HL7
5 7 (1.43%) Cyber Essentials
5 7 (1.43%) ISO/IEC 27001
6 4 (0.81%) GDPR
7 3 (0.61%) Actionable Recommendations
7 3 (0.61%) NIST
8 2 (0.41%) AUTOSAR
8 2 (0.41%) ISO 26262
9 1 (0.20%) California Consumer Privacy Act
9 1 (0.20%) EMIR
9 1 (0.20%) EU AI Act
9 1 (0.20%) GMP
System Software
1 43 (8.76%) Docker
2 5 (1.02%) Firmware
3 2 (0.41%) Active Directory
Systems Management
1 40 (8.15%) Kubernetes
2 15 (3.05%) Terraform
3 10 (2.04%) Ansible
4 5 (1.02%) Kubeflow
5 3 (0.61%) Progress Chef
6 2 (0.41%) Computer Emergency Response Teams
6 2 (0.41%) Functional Safety
6 2 (0.41%) logstash
6 2 (0.41%) Mesos
6 2 (0.41%) Prometheus
6 2 (0.41%) Puppet
7 1 (0.20%) Grafana
Vendors
1 73 (14.87%) Google
2 42 (8.55%) IBM
3 26 (5.30%) Microsoft
4 22 (4.48%) Screaming Frog
5 17 (3.46%) OpenAI
5 17 (3.46%) Oracle
6 16 (3.26%) Ahrefs
7 9 (1.83%) YouTube
8 7 (1.43%) Databricks
9 6 (1.22%) Red Hat
10 5 (1.02%) Adobe
11 4 (0.81%) Salesforce
12 3 (0.61%) Alteryx
12 3 (0.61%) Facebook
12 3 (0.61%) Instagram
12 3 (0.61%) SAP
12 3 (0.61%) TikTok
13 2 (0.41%) Criteo
13 2 (0.41%) Hotjar
13 2 (0.41%) Thales