Data Protection Job Trends in England

Data Protection
UK > England

The table below provides summary statistics and salary benchmarking for jobs advertised in England requiring Data Protection skills. It covers vacancies from the 6 months leading up to 18 September 2025, with comparisons to the same periods in the previous two years.

6 months to
18 Sep 2025
Same period 2024 Same period 2023
Rank 225 256 262
Rank change year-on-year +31 +6 -40
Permanent jobs citing Data Protection 636 755 684
As % of all permanent jobs advertised in England 1.47% 1.09% 1.27%
As % of the Processes & Methodologies category 1.66% 1.34% 1.35%
Number of salaries quoted 423 460 543
10th Percentile £31,250 £32,407 £35,000
25th Percentile £36,650 £42,188 £45,000
Median annual salary (50th Percentile) £55,000 £55,000 £58,000
Median % change year-on-year - -5.17% +5.19%
75th Percentile £82,500 £75,000 £75,897
90th Percentile £105,000 £96,375 £95,000
UK median annual salary £55,000 £55,000 £59,000
% change year-on-year - -6.78% +7.00%

All Process and Methodology Skills
England

Data Protection falls under the Processes and Methodologies category. For comparison with the information above, the following table provides summary statistics for all permanent job vacancies requiring process or methodology skills in England.

Permanent vacancies with a requirement for process or methodology skills 38,364 56,336 50,848
As % of all permanent jobs advertised in England 88.77% 81.63% 94.28%
Number of salaries quoted 22,058 32,210 38,175
10th Percentile £28,500 £32,000 £33,500
25th Percentile £37,500 £42,500 £45,000
Median annual salary (50th Percentile) £55,000 £57,500 £62,400
Median % change year-on-year -4.35% -7.85% +4.00%
75th Percentile £76,250 £77,500 £81,250
90th Percentile £97,500 £96,250 £100,000
UK median annual salary £55,000 £57,500 £60,000
% change year-on-year -4.35% -4.17% -

Data Protection
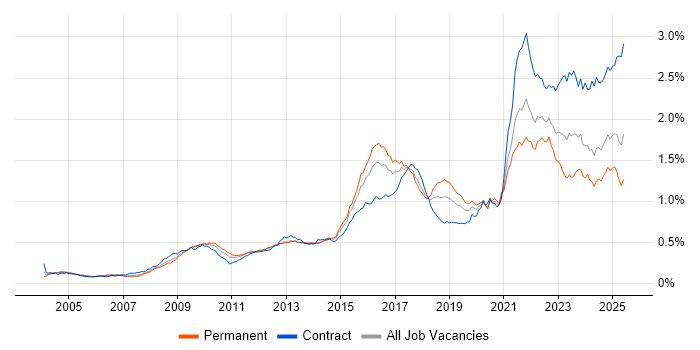
Job Vacancy Trend in England

Job postings citing Data Protection as a proportion of all IT jobs advertised in England.

Job vacancy trend for Data Protection in England

Data Protection
Salary Trend in England

Salary distribution trend for jobs in England citing Data Protection.

Salary distribution trend for jobs in England citing Data Protection

Data Protection
Salary Histogram in England

Salary distribution for jobs citing Data Protection in England over the 6 months to 18 September 2025.

Salary histogram for Data Protection in England

Data Protection
Job Locations in England

The table below looks at the demand and provides a guide to the median salaries quoted in IT jobs citing Data Protection within the England region over the 6 months to 18 September 2025. The 'Rank Change' column provides an indication of the change in demand within each location based on the same 6 month period last year.

Location Rank Change
on Same Period
Last Year
Matching
Permanent
IT Job Ads
Median Salary
Past 6 Months
Median Salary
% Change
on Same Period
Last Year
Live
Jobs
London +82 284 £67,500 +1.50% 216
North of England -21 116 £50,000 -4.76% 79
South East +37 110 £46,000 -8.00% 171
North West -23 77 £50,000 - 50
Midlands -13 55 £51,693 -10.10% 73
East of England -7 40 £32,500 -54.39% 40
Yorkshire +10 33 £60,000 - 20
West Midlands -7 32 £60,000 - 43
South West +58 31 £43,091 -13.82% 65
East Midlands +22 23 £40,000 -11.11% 29
North East +21 6 £57,500 +53.43% 9
Data Protection
UK

Data Protection
Co-occurring Skills and Capabilities in England by Category

The follow tables expand on the table above by listing co-occurrences grouped by category. The same employment type, locality and period is covered with up to 20 co-occurrences shown in each of the following categories:

Application Platforms
1 56 (8.81%) SharePoint
2 14 (2.20%) Microsoft Exchange
3 9 (1.42%) CMS
4 7 (1.10%) Confluence
5 6 (0.94%) IIS
6 5 (0.79%) Apache Spark
7 4 (0.63%) Umbraco
8 3 (0.47%) Apache
8 3 (0.47%) OpenStack
8 3 (0.47%) Oracle Workflow
9 2 (0.31%) HCL Notes
9 2 (0.31%) nginx
9 2 (0.31%) Oracle SOA Suite
10 1 (0.16%) GemFire
10 1 (0.16%) Headless CMS
10 1 (0.16%) SAS
10 1 (0.16%) WebSphere
Applications
1 48 (7.55%) Microsoft Office
2 42 (6.60%) Microsoft Excel
3 11 (1.73%) MS Visio
4 9 (1.42%) Microsoft Project
5 8 (1.26%) Trello
6 3 (0.47%) Microsoft PowerPoint
7 1 (0.16%) Adobe Creative Suite
7 1 (0.16%) Adobe Illustrator
7 1 (0.16%) Adobe Premiere
7 1 (0.16%) InDesign
7 1 (0.16%) Photoshop
7 1 (0.16%) Spreadsheet
Business Applications
1 18 (2.83%) Dynamics CRM
2 5 (0.79%) SAP S/4HANA
3 4 (0.63%) NetSuite
4 3 (0.47%) Endur
5 2 (0.31%) Adobe Campaign
5 2 (0.31%) Oracle BPM
5 2 (0.31%) Payment Gateway
6 1 (0.16%) Dynamics AX
6 1 (0.16%) Dynamics GP
6 1 (0.16%) Lorenzo
6 1 (0.16%) Odoo
6 1 (0.16%) Oracle Applications
6 1 (0.16%) Oracle EBS
6 1 (0.16%) Pegasus Opera
6 1 (0.16%) Raiser’s Edge
6 1 (0.16%) Salesforce CRM
6 1 (0.16%) Shopify
6 1 (0.16%) SystmOne
Cloud Services
1 166 (26.10%) Azure
2 96 (15.09%) Microsoft 365
3 89 (13.99%) AWS
4 63 (9.91%) Power Platform
5 48 (7.55%) Entra ID
6 32 (5.03%) Azure DevOps
6 32 (5.03%) GCP
7 23 (3.62%) OneDrive
7 23 (3.62%) SaaS
8 19 (2.99%) GitHub
8 19 (2.99%) Serverless
9 17 (2.67%) Dynamics 365
9 17 (2.67%) Microsoft Purview
9 17 (2.67%) PowerApps
10 15 (2.36%) Power Automate
11 13 (2.04%) AWS Lambda
12 12 (1.89%) Azure Data Factory
12 12 (1.89%) Google Workspace
13 11 (1.73%) Amazon S3
13 11 (1.73%) AWS CloudFormation
Communications & Networking
1 25 (3.93%) WAN
2 24 (3.77%) Network Security
2 24 (3.77%) VPN
3 22 (3.46%) Firewall
4 20 (3.14%) LAN
5 18 (2.83%) DNS
6 17 (2.67%) Wireless
7 16 (2.52%) DHCP
7 16 (2.52%) VLAN
8 14 (2.20%) SD-WAN
8 14 (2.20%) TCP/IP
9 12 (1.89%) Unified Communications
10 11 (1.73%) SSL
10 11 (1.73%) VoIP
11 10 (1.57%) Wi-Fi
12 7 (1.10%) SAN
13 6 (0.94%) Intranet
14 5 (0.79%) Remote Desktop
14 5 (0.79%) RTP
14 5 (0.79%) Softphone
Database & Business Intelligence
1 49 (7.70%) Power BI
2 29 (4.56%) Tableau
3 17 (2.67%) SQL Server
4 16 (2.52%) Metadata
5 13 (2.04%) PostgreSQL
6 12 (1.89%) MySQL
7 10 (1.57%) Data Lake
7 10 (1.57%) Relational Database
7 10 (1.57%) SQL Server Integration Services
8 9 (1.42%) IBM InfoSphere
9 7 (1.10%) Data Warehouse
9 7 (1.10%) Oracle Reports
10 6 (0.94%) MongoDB
11 5 (0.79%) NoSQL
11 5 (0.79%) SQL Server Reporting Services
12 4 (0.63%) Amazon RDS
12 4 (0.63%) BigQuery
12 4 (0.63%) Electronic Patient Records
13 3 (0.47%) Azure SQL Database
13 3 (0.47%) Big Data
Development Applications
1 32 (5.03%) Git
2 25 (3.93%) JIRA
3 13 (2.04%) Jenkins
4 12 (1.89%) ERwin
5 9 (1.42%) GitLab
6 4 (0.63%) PHPUnit
7 3 (0.47%) Bitbucket
7 3 (0.47%) Octopus Deploy
7 3 (0.47%) Visual Studio
7 3 (0.47%) Visual Studio Code
7 3 (0.47%) Vite
8 2 (0.31%) Oracle Forms
8 2 (0.31%) TeamCity
9 1 (0.16%) ESLint
9 1 (0.16%) git-flow
9 1 (0.16%) Postman
9 1 (0.16%) Selenium
9 1 (0.16%) Storybook
9 1 (0.16%) Team Foundation Server
9 1 (0.16%) webpack
General
1 293 (46.07%) Social Skills
2 142 (22.33%) Finance
3 102 (16.04%) Analytical Skills
4 78 (12.26%) Legal
5 44 (6.92%) Marketing
6 42 (6.60%) Law
7 28 (4.40%) Inclusion and Diversity
8 24 (3.77%) Public Sector
9 22 (3.46%) Influencing Skills
10 21 (3.30%) Organisational Skills
11 20 (3.14%) Banking
12 17 (2.67%) Retail
13 15 (2.36%) Telecoms
14 12 (1.89%) Presentation Skills
15 11 (1.73%) Games
16 10 (1.57%) Documentation Skills
17 9 (1.42%) Back Office
18 7 (1.10%) Manufacturing
19 5 (0.79%) Local Government
19 5 (0.79%) Pharmaceutical
Job Titles
1 106 (16.67%) Analyst
2 75 (11.79%) Lead
3 66 (10.38%) Architect
4 61 (9.59%) Senior
5 54 (8.49%) Developer
6 30 (4.72%) Security Architect
7 29 (4.56%) Data Analyst
7 29 (4.56%) Enterprise Architect
7 29 (4.56%) IT Manager
8 28 (4.40%) Administrator
8 28 (4.40%) Enterprise Information Architect
8 28 (4.40%) Enterprise Security Architect
8 28 (4.40%) Information Architect
8 28 (4.40%) Information Security Architect
9 27 (4.25%) IT Support
10 22 (3.46%) Support Engineer
11 20 (3.14%) Junior
11 20 (3.14%) Risk Manager
12 19 (2.99%) Lead Architect
13 17 (2.67%) Project Manager
Libraries, Frameworks & Software Standards
1 29 (4.56%) HTML
2 25 (3.93%) CSS
3 24 (3.77%) .NET
4 21 (3.30%) RESTful
5 16 (2.52%) React
6 15 (2.36%) JSON
7 11 (1.73%) REST
8 10 (1.57%) Kafka
8 10 (1.57%) Node.js
8 10 (1.57%) Web Services
8 10 (1.57%) XML
9 9 (1.42%) .NET Framework
10 8 (1.26%) ASP.NET
10 8 (1.26%) OAuth
11 7 (1.10%) Laravel
12 6 (0.94%) Elastic Stack
12 6 (0.94%) jQuery
12 6 (0.94%) Oracle Fusion
12 6 (0.94%) React Native
12 6 (0.94%) WPF
Miscellaneous
1 129 (20.28%) Data Protection Act
2 64 (10.06%) Management Information System
3 35 (5.50%) Driving Licence
4 27 (4.25%) Onboarding
5 22 (3.46%) Cloud Native
5 22 (3.46%) Data Structures
6 20 (3.14%) Social Media
7 18 (2.83%) Analytical Mindset
7 18 (2.83%) Legacy Systems
8 16 (2.52%) Self-Motivation
9 13 (2.04%) Data Centre
9 13 (2.04%) NHS
9 13 (2.04%) Security Posture
10 11 (1.73%) Freedom of Information
11 10 (1.57%) Cyber Threat
11 10 (1.57%) Distributed Systems
12 8 (1.26%) Enterprise Software
13 7 (1.10%) CCTV
13 7 (1.10%) Virtual Team
14 6 (0.94%) Cyberattack
Operating Systems
1 85 (13.36%) Windows
2 35 (5.50%) Windows Server
3 31 (4.87%) Linux
4 11 (1.73%) Android
4 11 (1.73%) Apple iOS
4 11 (1.73%) Mac OS
4 11 (1.73%) Windows 10
5 10 (1.57%) Windows Server 2016
5 10 (1.57%) Windows Server 2019
6 3 (0.47%) Unix
6 3 (0.47%) VMS
7 2 (0.31%) Oracle Linux
7 2 (0.31%) Red Hat Enterprise Linux
8 1 (0.16%) Ubuntu
8 1 (0.16%) Windows Server 2012
Processes & Methodologies
1 147 (23.11%) Problem-Solving
2 126 (19.81%) Cybersecurity
3 117 (18.40%) Agile
4 113 (17.77%) Stakeholder Management
5 108 (16.98%) Information Security
6 105 (16.51%) Decision-Making
7 95 (14.94%) Continuous Improvement
8 80 (12.58%) Mentoring
9 75 (11.79%) Cloud Security
10 74 (11.64%) ITIL
11 73 (11.48%) Customer Service
11 73 (11.48%) Service Delivery
12 72 (11.32%) DevOps
13 70 (11.01%) CI/CD
14 63 (9.91%) Risk Management
15 61 (9.59%) Business Intelligence
16 59 (9.28%) Stakeholder Engagement
17 57 (8.96%) Analytics
17 57 (8.96%) Regulatory Compliance
18 56 (8.81%) Coaching
Programming Languages
1 64 (10.06%) SQL
2 55 (8.65%) Python
3 43 (6.76%) JavaScript
4 32 (5.03%) PowerShell
5 29 (4.56%) C#
6 23 (3.62%) Java
7 14 (2.20%) Go
7 14 (2.20%) R
8 13 (2.04%) Bash
9 12 (1.89%) TypeScript
10 7 (1.10%) PHP
11 6 (0.94%) T-SQL
12 4 (0.63%) Bicep
13 3 (0.47%) C++
14 2 (0.31%) Data Analysis Expressions
15 1 (0.16%) C
15 1 (0.16%) Kotlin
15 1 (0.16%) PL/SQL
15 1 (0.16%) Scala
15 1 (0.16%) VBScript
Qualifications
1 127 (19.97%) Degree
2 60 (9.43%) DBS Check
3 53 (8.33%) CISSP
4 50 (7.86%) CISM
5 32 (5.03%) Microsoft Certification
6 30 (4.72%) TOGAF Certification
7 26 (4.09%) Computer Science Degree
8 20 (3.14%) PMI Certification
8 20 (3.14%) PMP
9 19 (2.99%) CISA
9 19 (2.99%) Cisco Certification
10 15 (2.36%) AWS Certification
10 15 (2.36%) Master's Degree
11 13 (2.04%) AWS Certified Solutions Architect
12 12 (1.89%) ITIL Certification
13 11 (1.73%) Azure Certification
14 10 (1.57%) CRISC
15 9 (1.42%) Security Cleared
16 8 (1.26%) (ISC)2 CCSP
16 8 (1.26%) CCSP
Quality Assurance & Compliance
1 172 (27.04%) GDPR
2 50 (7.86%) ISO/IEC 27001
3 37 (5.82%) GRC
4 36 (5.66%) QA
5 32 (5.03%) Cyber Essentials
5 32 (5.03%) Data Quality
5 32 (5.03%) NIST
6 24 (3.77%) Accessibility
7 19 (2.99%) SLA
8 15 (2.36%) Cyber Essentials PLUS
9 13 (2.04%) HIPAA
10 10 (1.57%) ISO/IEC 27002 (supersedes ISO/IEC 17799)
11 7 (1.10%) SOC 2
12 5 (0.79%) California Consumer Privacy Act
12 5 (0.79%) GxP
13 4 (0.63%) EU AI Act
13 4 (0.63%) Sarbanes-Oxley
14 3 (0.47%) ISO 22301
14 3 (0.47%) NCSC
14 3 (0.47%) PERC
System Software
1 62 (9.75%) Active Directory
2 28 (4.40%) Docker
3 25 (3.93%) VMware Infrastructure
4 10 (1.57%) Hyper-V
5 8 (1.26%) BitLocker
6 7 (1.10%) Virtual Desktop
7 6 (0.94%) Firmware
8 5 (0.79%) Virtual Machines
9 2 (0.31%) IAG
9 2 (0.31%) KVM
9 2 (0.31%) QEMU
10 1 (0.16%) VMware ESXi
10 1 (0.16%) VMware Server
Systems Management
1 50 (7.86%) Microsoft Intune
2 31 (4.87%) Terraform
3 29 (4.56%) Kubernetes
4 19 (2.99%) SCCM
5 15 (2.36%) Ansible
5 15 (2.36%) Grafana
6 12 (1.89%) Single Sign-On
7 10 (1.57%) Jamf Pro
8 9 (1.42%) Prometheus
9 6 (0.94%) Nagios
10 5 (0.79%) HP Fortify
11 4 (0.63%) Rancher
11 4 (0.63%) vRealize
12 3 (0.47%) Autotask
12 3 (0.47%) Avamar
12 3 (0.47%) CASB
12 3 (0.47%) SCOM
13 2 (0.31%) Dell DRAC
13 2 (0.31%) Puppet
13 2 (0.31%) Systems Management Server (SMS)
Vendors
1 187 (29.40%) Microsoft
2 35 (5.50%) VMware
3 30 (4.72%) Cisco
4 29 (4.56%) Google
5 20 (3.14%) Oracle
6 16 (2.52%) Apple
7 15 (2.36%) Informatica
8 14 (2.20%) ServiceNow
9 13 (2.04%) Salesforce
10 12 (1.89%) Meraki
10 12 (1.89%) SAP
11 10 (1.57%) HP
11 10 (1.57%) IBM
11 10 (1.57%) Samsung
12 9 (1.42%) Databricks
12 9 (1.42%) Symantec
13 7 (1.10%) Citrix
13 7 (1.10%) Facebook
13 7 (1.10%) Sage
14 6 (0.94%) Dell