Developer Jobs in England

Developer
UK > England

The median Developer salary in England is £60,000 per year, according to job vacancies posted during the 6 months leading to 2 July 2025.

The table below provides salary benchmarking and summary statistics, comparing them to the same period in the previous two years.

6 months to
2 Jul 2025
Same period 2024 Same period 2023
Rank 18 7 9
Rank change year-on-year -11 +2 -4
Permanent jobs requiring a Developer 4,329 13,958 12,181
As % of all permanent jobs advertised in England 8.47% 14.83% 15.40%
As % of the Job Titles category 9.35% 15.66% 16.90%
Number of salaries quoted 3,052 11,747 9,648
10th Percentile £37,000 £35,000 £41,175
25th Percentile £47,500 £45,000 £50,000
Median annual salary (50th Percentile) £60,000 £57,500 £65,000
Median % change year-on-year +4.35% -11.54% +8.33%
75th Percentile £78,750 £72,500 £85,000
90th Percentile £110,000 £95,000 £112,500
UK median annual salary £60,000 £55,173 £65,000
% change year-on-year +8.75% -15.12% +8.33%

All Permanent IT Job Vacancies
England

For comparison with the information above, the following table provides summary statistics for all permanent IT job vacancies in England. Most job vacancies include a discernible job title that can be normalized. As such, the figures in the second row provide an indication of the number of permanent jobs in our overall sample.

Permanent vacancies in England with a recognized job title 46,299 89,129 72,093
% of permanent jobs with a recognized job title 90.56% 94.67% 91.16%
Number of salaries quoted 25,321 64,694 48,523
10th Percentile £28,000 £28,500 £32,500
25th Percentile £39,000 £38,572 £45,000
Median annual salary (50th Percentile) £55,000 £52,500 £60,000
Median % change year-on-year +4.76% -12.50% -
75th Percentile £73,750 £70,250 £81,250
90th Percentile £95,000 £90,000 £100,000
UK median annual salary £55,000 £52,500 £60,000
% change year-on-year +4.76% -12.50% -

Developer
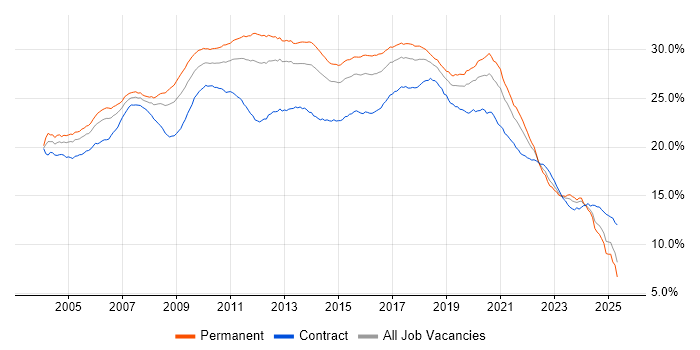
Job Vacancy Trend in England

Job postings that featured Developer in the job title as a proportion of all IT jobs advertised in England.

Job vacancy trend for Developer in England

Developer
Salary Trend in England

3-month moving average salary quoted in jobs citing Developer in England.

Salary trend for Developer in England

Developer
Salary Histogram in England

Salary distribution for jobs citing Developer in England over the 6 months to 2 July 2025.

Salary histogram for Developer in England

Developer
Job Locations in England

The table below looks at the demand and provides a guide to the median salaries quoted in IT jobs citing Developer within the England region over the 6 months to 2 July 2025. The 'Rank Change' column provides an indication of the change in demand within each location based on the same 6 month period last year.

Location Rank Change
on Same Period
Last Year
Matching
Permanent
IT Job Ads
Median Salary
Past 6 Months
Median Salary
% Change
on Same Period
Last Year
Live
Jobs
London -3 1,622 £80,000 +6.67% 3,946
North of England -25 991 £57,500 +9.52% 1,482
North West -18 744 £57,500 +9.52% 938
South East -20 684 £55,000 -4.35% 1,600
Midlands -17 451 £55,000 +10.00% 763
West Midlands -16 306 £56,000 +12.00% 440
South West -12 300 £55,000 +10.00% 628
East of England -42 233 £54,000 +8.00% 641
Yorkshire -35 197 £60,000 +20.00% 425
East Midlands -46 142 £52,500 +5.00% 323
North East -24 50 £55,000 +4.76% 129
Developer
UK

Developer Skill Set
Top 30 Co-occurring Skills and Capabilities in England

For the 6 months to 2 July 2025, Developer job roles required the following skills and capabilities in order of popularity. The figures indicate the absolute number co-occurrences and as a proportion of all permanent job ads across the England region featuring Developer in the job title.

1 1,753 (40.49%) Agile
2 1,393 (32.18%) JavaScript
3 1,288 (29.75%) Finance
4 1,249 (28.85%) Python
5 1,181 (27.28%) SQL
6 1,144 (26.43%) C#
7 1,076 (24.86%) Java
8 1,023 (23.63%) .NET
8 1,023 (23.63%) Azure
9 1,015 (23.45%) AWS
10 908 (20.97%) React
11 852 (19.68%) Docker
12 793 (18.32%) Problem-Solving
12 793 (18.32%) Social Skills
13 716 (16.54%) C++
14 709 (16.38%) HTML
15 707 (16.33%) CI/CD
16 687 (15.87%) Analytical Skills
17 686 (15.85%) TypeScript
18 682 (15.75%) Linux
19 669 (15.45%) OOP
20 666 (15.38%) OO
21 659 (15.22%) Security Cleared
22 644 (14.88%) Microsoft
23 630 (14.55%) Full-Stack Development
24 627 (14.48%) CSS
25 602 (13.91%) Design Patterns
26 592 (13.68%) SQL Server
27 581 (13.42%) Inclusion and Diversity
28 579 (13.37%) DevOps

Developer Skill Set
Co-occurring Skills and Capabilities in England by Category

The follow tables expand on the table above by listing co-occurrences grouped by category. The same employment type, locality and period is covered with up to 20 co-occurrences shown in each of the following categories:

Application Platforms
1 126 (2.91%) Apache Airflow
2 112 (2.59%) CMS
3 95 (2.19%) SharePoint
4 68 (1.57%) WordPress
5 64 (1.48%) Confluence
6 61 (1.41%) Apache
7 46 (1.06%) OpenEdge
8 33 (0.76%) Umbraco
9 28 (0.65%) IIS
10 21 (0.49%) Headless CMS
11 19 (0.44%) Drupal
11 19 (0.44%) Microsoft Exchange
11 19 (0.44%) nginx
12 18 (0.42%) JBoss
13 17 (0.39%) Appian
14 12 (0.28%) Red Hat Fuse
15 10 (0.23%) Oracle SOA Suite
16 6 (0.14%) OpenStack
17 5 (0.12%) Liferay
18 4 (0.092%) Oracle Workflow
Applications
1 60 (1.39%) Chatbot
2 44 (1.02%) Microsoft Excel
3 30 (0.69%) Microsoft Office
4 20 (0.46%) Adobe XD
5 16 (0.37%) Microsoft PowerPoint
6 13 (0.30%) Sketch
7 10 (0.23%) Photoshop
7 10 (0.23%) Trello
8 7 (0.16%) Adobe Illustrator
9 6 (0.14%) Adobe Creative Suite
9 6 (0.14%) InVision
9 6 (0.14%) Revit
10 5 (0.12%) InDesign
11 4 (0.092%) Spreadsheet
12 3 (0.069%) Elementor
13 2 (0.046%) Adobe Premiere
13 2 (0.046%) Final Cut Pro
13 2 (0.046%) MS Visio
13 2 (0.046%) S-PLUS
14 1 (0.023%) 3ds Max
Business Applications
1 124 (2.86%) Dynamics CRM
2 44 (1.02%) NetSuite
3 27 (0.62%) Shopify
4 23 (0.53%) Magento
5 21 (0.49%) Oracle EBS
6 17 (0.39%) Payment Gateway
7 13 (0.30%) SAP S/4HANA
8 11 (0.25%) Infor CloudSuite
8 11 (0.25%) Infor CloudSuite Industrial (formerly SyteLine)
8 11 (0.25%) JDE OneWorld
9 8 (0.18%) Orchestrade
10 7 (0.16%) SAP Business One
11 6 (0.14%) Endur
11 6 (0.14%) SimCorp Dimension
12 5 (0.12%) Dynamics NAV
12 5 (0.12%) Oracle BPM
13 4 (0.092%) Elite 3E
13 4 (0.092%) IBM Planning Analytics
13 4 (0.092%) Sage 1000
13 4 (0.092%) Salesforce CRM
Cloud Services
1 1,023 (23.63%) Azure
2 1,015 (23.45%) AWS
3 453 (10.46%) Power Platform
4 321 (7.42%) Serverless
5 261 (6.03%) GCP
6 231 (5.34%) Dynamics 365
7 195 (4.50%) AWS Lambda
8 191 (4.41%) PowerApps
9 184 (4.25%) SaaS
10 183 (4.23%) Power Automate
11 166 (3.83%) Azure DevOps
12 158 (3.65%) Amazon S3
13 143 (3.30%) GitHub
14 119 (2.75%) dbt
15 102 (2.36%) Amazon EKS
16 89 (2.06%) AWS Step Functions
17 87 (2.01%) Azure Logic Apps
18 82 (1.89%) Amazon EC2
19 68 (1.57%) AWS CloudFormation
20 60 (1.39%) Snowflake
Communications & Networking
1 401 (9.26%) VPN
2 398 (9.19%) DNS
3 80 (1.85%) Broadband
4 27 (0.62%) TCP/IP
5 19 (0.44%) Intranet
6 17 (0.39%) HTTP
7 15 (0.35%) Internet
8 7 (0.16%) SMS
8 7 (0.16%) WPA
9 5 (0.12%) Multicast
10 4 (0.092%) 5G
10 4 (0.092%) MQTT
11 3 (0.069%) FTP
11 3 (0.069%) Network Security
11 3 (0.069%) Wi-Fi
12 2 (0.046%) RTP
12 2 (0.046%) Wireless
12 2 (0.046%) Wireshark
13 1 (0.023%) RS-232
13 1 (0.023%) RS-485
Database & Business Intelligence
1 592 (13.68%) SQL Server
2 315 (7.28%) PostgreSQL
3 313 (7.23%) Power BI
4 278 (6.42%) MySQL
5 187 (4.32%) Elasticsearch
6 166 (3.83%) MongoDB
7 161 (3.72%) NoSQL
8 158 (3.65%) Relational Database
9 153 (3.53%) DynamoDB
10 122 (2.82%) Amazon Athena
11 118 (2.73%) Apache Iceberg
12 114 (2.63%) Apache Arrow
12 114 (2.63%) Dremio
13 106 (2.45%) SQL Server Reporting Services
14 99 (2.29%) Data Warehouse
15 80 (1.85%) Azure SQL Database
16 76 (1.76%) SQL Server Integration Services
17 68 (1.57%) Redis
18 53 (1.22%) RDBMS
19 49 (1.13%) Amazon RDS
Development Applications
1 505 (11.67%) Git
2 158 (3.65%) JIRA
3 115 (2.66%) Jenkins
4 87 (2.01%) JUnit
5 67 (1.55%) Visual Studio
6 58 (1.34%) Mockito
7 51 (1.18%) GitLab
8 44 (1.02%) Maven
9 41 (0.95%) webpack
10 37 (0.85%) Jasmine
11 34 (0.79%) NUnit
12 33 (0.76%) Cypress.io
13 27 (0.62%) Octopus Deploy
14 26 (0.60%) Bitbucket
15 25 (0.58%) JMeter
15 25 (0.58%) TeamCity
16 24 (0.55%) SonarQube
17 21 (0.49%) IntelliJ
17 21 (0.49%) Mocha
18 20 (0.46%) Selenium
General
1 1,288 (29.75%) Finance
2 793 (18.32%) Social Skills
3 687 (15.87%) Analytical Skills
4 581 (13.42%) Inclusion and Diversity
5 301 (6.95%) Front Office
6 230 (5.31%) Banking
7 169 (3.90%) Law
8 159 (3.67%) Marketing
9 146 (3.37%) Retail
10 135 (3.12%) Public Sector
11 106 (2.45%) Games
12 102 (2.36%) Investment Banking
13 70 (1.62%) Manufacturing
14 43 (0.99%) Back Office
14 43 (0.99%) Legal
15 39 (0.90%) Tech for Good
16 33 (0.76%) Advertising
16 33 (0.76%) Organisational Skills
16 33 (0.76%) Telecoms
17 31 (0.72%) Automotive
Libraries, Frameworks & Software Standards
1 1,023 (23.63%) .NET
2 908 (20.97%) React
3 709 (16.38%) HTML
4 627 (14.48%) CSS
5 475 (10.97%) Node.js
6 469 (10.83%) AngularJS
7 376 (8.69%) RESTful
8 329 (7.60%) REST
9 311 (7.18%) Vue
10 303 (7.00%) ASP.NET
11 287 (6.63%) .NET Core
12 226 (5.22%) .NET Framework
13 217 (5.01%) Web Services
14 194 (4.48%) GraphQL
15 181 (4.18%) HTML5
16 168 (3.88%) XML
17 165 (3.81%) Spring
18 163 (3.77%) Pandas
19 150 (3.47%) jQuery
19 150 (3.47%) JSON
Miscellaneous
1 446 (10.30%) Cyberattack
2 210 (4.85%) Fixed Income
3 193 (4.46%) Foreign Exchange (FX)
4 183 (4.23%) Equities
5 159 (3.67%) Mobile App
6 124 (2.86%) Hedge funds
7 113 (2.61%) Greenfield Project
8 109 (2.52%) Cloud Native
9 108 (2.49%) Product Ownership
10 86 (1.99%) Algorithms
10 86 (1.99%) Legacy Systems
11 77 (1.78%) Data Structures
12 76 (1.76%) Distributed Systems
13 72 (1.66%) Self-Motivation
14 66 (1.52%) Management Information System
15 61 (1.41%) Derivative
16 54 (1.25%) Onboarding
17 51 (1.18%) Enterprise Software
18 32 (0.74%) Virtual Team
19 30 (0.69%) e-Learning
Operating Systems
1 682 (15.75%) Linux
2 526 (12.15%) Android
3 74 (1.71%) Apple iOS
4 67 (1.55%) Windows
5 24 (0.55%) Unix
6 5 (0.12%) Rocky
6 5 (0.12%) Windows Server
7 4 (0.092%) Ubuntu
8 3 (0.069%) Embedded Linux
9 2 (0.046%) Mac OS
9 2 (0.046%) zOS
Processes & Methodologies
1 1,753 (40.49%) Agile
2 793 (18.32%) Problem-Solving
3 707 (16.33%) CI/CD
4 669 (15.45%) OOP
5 666 (15.38%) OO
6 630 (14.55%) Full-Stack Development
7 602 (13.91%) Design Patterns
8 579 (13.37%) DevOps
9 555 (12.82%) Software Engineering
10 511 (11.80%) Mathematics
11 492 (11.37%) Android Development
12 483 (11.16%) Line Management
13 457 (10.56%) Microservices
14 420 (9.70%) User Experience
15 400 (9.24%) Mentoring
16 360 (8.32%) Front End Development
17 346 (7.99%) TDD
18 333 (7.69%) Clean Code
19 324 (7.48%) Business Intelligence
20 297 (6.86%) Computer Science
Programming Languages
1 1,393 (32.18%) JavaScript
2 1,249 (28.85%) Python
3 1,181 (27.28%) SQL
4 1,144 (26.43%) C#
5 1,076 (24.86%) Java
6 716 (16.54%) C++
7 686 (15.85%) TypeScript
8 504 (11.64%) Go
9 304 (7.02%) PHP
10 156 (3.60%) T-SQL
11 68 (1.57%) C
12 67 (1.55%) PL/SQL
13 64 (1.48%) Rust
14 60 (1.39%) PowerShell
15 51 (1.18%) VB.NET
16 49 (1.13%) Apex Code
17 41 (0.95%) Data Analysis Expressions
18 40 (0.92%) Kotlin
18 40 (0.92%) Swift
19 29 (0.67%) VBA
Qualifications
1 659 (15.22%) Security Cleared
2 473 (10.93%) DV Cleared
3 463 (10.70%) Degree
4 208 (4.80%) Computer Science Degree
5 171 (3.95%) SC Cleared
6 84 (1.94%) AWS Certification
7 68 (1.57%) DBS Check
8 41 (0.95%) Master's Degree
9 31 (0.72%) Microsoft Certification
10 28 (0.65%) PhD
11 27 (0.62%) BPSS Clearance
12 17 (0.39%) Azure Certification
13 12 (0.28%) Numerate Degree
14 9 (0.21%) AWS Certified Solutions Architect
15 4 (0.092%) ACCA
15 4 (0.092%) AWS Certified Developer
15 4 (0.092%) CIMA
15 4 (0.092%) ITIL Certification
16 2 (0.046%) MOS
16 2 (0.046%) Postgraduate
Quality Assurance & Compliance
1 224 (5.17%) QA
2 115 (2.66%) Accessibility
3 34 (0.79%) Data Quality
4 29 (0.67%) GDPR
5 28 (0.65%) WCAG
6 25 (0.58%) SLA
7 6 (0.14%) ISO/IEC 27001
8 5 (0.12%) ISO 9001
8 5 (0.12%) Software Quality Assurance
9 3 (0.069%) MiFID
10 2 (0.046%) EMIR
10 2 (0.046%) GRC
10 2 (0.046%) HL7
11 1 (0.023%) California Consumer Privacy Act
11 1 (0.023%) CDISC
11 1 (0.023%) Sarbanes-Oxley
System Software
1 852 (19.68%) Docker
2 13 (0.30%) VMware Infrastructure
3 8 (0.18%) Active Directory
4 5 (0.12%) Firmware
5 4 (0.092%) Postfix
5 4 (0.092%) zsh
6 3 (0.069%) LXC
7 1 (0.023%) Apache ZooKeeper
7 1 (0.023%) Embedded Firmware
7 1 (0.023%) Virtual Machines
Systems Management
1 474 (10.95%) Ansible
2 322 (7.44%) Kubernetes
3 164 (3.79%) Terraform
4 23 (0.53%) Prometheus
5 21 (0.49%) Kibana
5 21 (0.49%) Single Sign-On
6 18 (0.42%) Grafana
7 13 (0.30%) Failover Clustering
8 7 (0.16%) Argo
9 4 (0.092%) HAProxy
10 2 (0.046%) Microsoft Intune
11 1 (0.023%) CEMLI
11 1 (0.023%) Istio
11 1 (0.023%) QRadar
11 1 (0.023%) RSA Archer
11 1 (0.023%) Rundeck
11 1 (0.023%) Systems Management Server (SMS)
Vendors
1 644 (14.88%) Microsoft
2 147 (3.40%) Oracle
3 94 (2.17%) Salesforce
4 75 (1.73%) Google
5 67 (1.55%) SAP
6 60 (1.39%) IBM
7 58 (1.34%) PayPal
8 57 (1.32%) Adobe
8 57 (1.32%) Databricks
9 47 (1.09%) Progress
10 44 (1.02%) ServiceNow
11 39 (0.90%) Splunk
12 26 (0.60%) MuleSoft
12 26 (0.60%) Red Hat
13 24 (0.55%) Facebook
14 23 (0.53%) Guidewire
15 19 (0.44%) Dynatrace
16 18 (0.42%) Atlassian
16 18 (0.42%) Dell
17 16 (0.37%) WooCommerce