Mobile App Jobs in England

Mobile Application
UK > England

The table below looks at the prevalence of the term Mobile App in permanent job vacancies in England. Included is a benchmarking guide to the salaries offered in vacancies that cited Mobile App over the 6 months leading up to 31 May 2025, comparing them to the same period in the previous two years.

6 months to
31 May 2025
Same period 2024 Same period 2023
Rank 322 280 201
Rank change year-on-year -42 -79 -79
Permanent jobs citing Mobile App 436 880 1,571
As % of all permanent jobs advertised in England 0.88% 0.98% 1.84%
As % of the Miscellaneous category 2.34% 2.90% 4.18%
Number of salaries quoted 319 710 969
10th Percentile £31,250 £31,250 £36,250
25th Percentile £42,500 £42,500 £47,500
Median annual salary (50th Percentile) £57,500 £55,000 £65,000
Median % change year-on-year +4.55% -15.38% +4.00%
75th Percentile £75,000 £76,188 £86,250
90th Percentile £87,500 £90,125 £105,000
UK median annual salary £59,900 £55,000 £62,500
% change year-on-year +8.91% -12.00% -

All Generic Skills
England

Mobile App falls under the General and Transferable Skills category. For comparison with the information above, the following table provides summary statistics for all permanent job vacancies requiring generic IT skills in England.

Permanent vacancies with a requirement for generic IT skills 18,639 30,336 37,575
As % of all permanent jobs advertised in England 37.80% 33.77% 44.12%
Number of salaries quoted 8,618 20,935 20,403
10th Percentile £30,940 £28,000 £36,000
25th Percentile £42,000 £38,000 £46,686
Median annual salary (50th Percentile) £60,000 £55,000 £65,000
Median % change year-on-year +9.09% -15.38% +4.00%
75th Percentile £80,000 £75,000 £87,500
90th Percentile £110,000 £100,000 £110,000
UK median annual salary £60,000 £55,000 £65,000
% change year-on-year +9.09% -15.38% +4.00%

Mobile App
Job Vacancy Trend in England

Job postings citing Mobile App as a proportion of all IT jobs advertised in England.
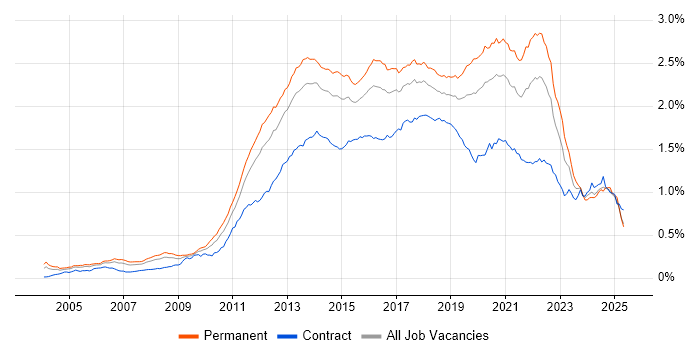
Job vacancy trend for Mobile App in England

Mobile App
Salary Trend in England

3-month moving average salary quoted in jobs citing Mobile App in England.

Salary trend for Mobile App in England

Mobile App
Salary Histogram in England

Salary distribution for jobs citing Mobile App in England over the 6 months to 31 May 2025.

Salary histogram for Mobile App in England

Mobile App
Job Locations in England

The table below looks at the demand and provides a guide to the median salaries quoted in IT jobs citing Mobile App within the England region over the 6 months to 31 May 2025. The 'Rank Change' column provides an indication of the change in demand within each location based on the same 6 month period last year.

Location Rank Change
on Same Period
Last Year
Matching
Permanent
IT Job Ads
Median Salary
Past 6 Months
Median Salary
% Change
on Same Period
Last Year
Live
Jobs
London +99 183 £65,000 -5.45% 350
North of England -60 76 £46,250 -7.50% 126
South East +6 66 £47,500 -5.00% 64
Midlands -18 57 £47,500 -5.00% 66
West Midlands +21 52 £47,500 -10.38% 47
Yorkshire +36 33 £26,500 -53.91% 24
North West -79 32 £60,000 +20.00% 90
South West +26 27 £61,250 -2.00% 30
East of England -23 19 £55,000 - 34
North East +38 11 £43,750 +2.94% 12
East Midlands -4 5 £51,250 +13.89% 19
Mobile App
UK

Mobile App
Co-occurring Skills and Capabilities in England by Category

The follow tables expand on the table above by listing co-occurrences grouped by category. The same employment type, locality and period is covered with up to 20 co-occurrences shown in each of the following categories:

Application Platforms
1 21 (4.82%) CMS
2 16 (3.67%) WordPress
3 12 (2.75%) Drupal
4 10 (2.29%) Confluence
5 9 (2.06%) IIS
6 8 (1.83%) Headless CMS
7 5 (1.15%) SharePoint
8 1 (0.23%) Apache
8 1 (0.23%) Apache Airflow
8 1 (0.23%) Appian
8 1 (0.23%) Microsoft Exchange
8 1 (0.23%) nginx
Applications
1 8 (1.83%) Sketch
2 5 (1.15%) Adobe Creative Suite
2 5 (1.15%) Adobe XD
3 4 (0.92%) Chatbot
3 4 (0.92%) Microsoft Excel
4 3 (0.69%) Microsoft Office
5 1 (0.23%) AutoCAD
5 1 (0.23%) InVision
5 1 (0.23%) Microsoft PowerPoint
5 1 (0.23%) Revit
5 1 (0.23%) UserZoom
Business Applications
1 4 (0.92%) Dynamics CRM
2 3 (0.69%) Payment Gateway
3 2 (0.46%) Shopify
4 1 (0.23%) Magento
4 1 (0.23%) Sage 200
4 1 (0.23%) SAP MM
Cloud Services
1 143 (32.80%) AWS
2 72 (16.51%) Azure
3 44 (10.09%) GCP
4 33 (7.57%) SaaS
5 31 (7.11%) Figma
6 24 (5.50%) Serverless
7 21 (4.82%) GitHub
8 20 (4.59%) Power Platform
9 18 (4.13%) Firebase
10 12 (2.75%) Cloud Computing
11 11 (2.52%) AWS Lambda
12 10 (2.29%) GitHub Actions
12 10 (2.29%) Google Analytics
13 8 (1.83%) Amazon S3
13 8 (1.83%) DigitalOcean
14 7 (1.61%) Azure DevOps
15 6 (1.38%) Contentful
16 5 (1.15%) BrowserStack
16 5 (1.15%) PowerApps
17 4 (0.92%) Dynamics 365
Communications & Networking
1 7 (1.61%) Internet
2 5 (1.15%) HTTP
3 4 (0.92%) Bluetooth
3 4 (0.92%) HTTPS
3 4 (0.92%) TCP/IP
4 3 (0.69%) Wi-Fi
5 2 (0.46%) Wireless
6 1 (0.23%) Network Security
6 1 (0.23%) Remote Desktop
6 1 (0.23%) X.21
Database & Business Intelligence
1 63 (14.45%) SQL Server
2 48 (11.01%) MySQL
3 32 (7.34%) NoSQL
4 17 (3.90%) PostgreSQL
4 17 (3.90%) SQL Server Reporting Services
5 11 (2.52%) Power BI
6 8 (1.83%) Elasticsearch
7 7 (1.61%) MongoDB
8 6 (1.38%) Relational Database
9 5 (1.15%) BigQuery
9 5 (1.15%) DynamoDB
10 4 (0.92%) Big Data
10 4 (0.92%) Cloud Spanner
11 3 (0.69%) Amazon RDS
11 3 (0.69%) Event Store
11 3 (0.69%) Redis
12 2 (0.46%) Data Warehouse
13 1 (0.23%) Hadoop
13 1 (0.23%) RDBMS
13 1 (0.23%) Tableau
Development Applications
1 82 (18.81%) Git
2 25 (5.73%) JIRA
3 21 (4.82%) Visual Studio
4 17 (3.90%) Appium
5 14 (3.21%) Jenkins
6 8 (1.83%) SonarQube
7 7 (1.61%) Android Studio
7 7 (1.61%) GitLab
7 7 (1.61%) Gradle
7 7 (1.61%) Xcode
8 6 (1.38%) Browser DevTools
9 5 (1.15%) Cucumber
9 5 (1.15%) JMeter
9 5 (1.15%) JUnit
9 5 (1.15%) Selenium
9 5 (1.15%) Storybook
10 4 (0.92%) Bitbucket
10 4 (0.92%) Jasmine
10 4 (0.92%) TeamCity
10 4 (0.92%) WebDriver
General
1 121 (27.75%) Social Skills
2 73 (16.74%) Finance
3 57 (13.07%) Analytical Skills
3 57 (13.07%) Games
4 38 (8.72%) Law
5 36 (8.26%) Banking
5 36 (8.26%) Inclusion and Diversity
6 34 (7.80%) Marketing
7 26 (5.96%) Retail
8 18 (4.13%) Organisational Skills
9 15 (3.44%) Automotive
9 15 (3.44%) Legal
10 12 (2.75%) Investment Banking
10 12 (2.75%) Presentation Skills
11 10 (2.29%) Aviation
12 6 (1.38%) Publishing
13 5 (1.15%) Digital Health
13 5 (1.15%) Police
13 5 (1.15%) Telecoms
14 4 (0.92%) Influencing Skills
Job Titles
1 189 (43.35%) Developer
2 97 (22.25%) Senior
3 59 (13.53%) Lead
4 58 (13.30%) Senior Developer
5 54 (12.39%) Software Engineer
6 31 (7.11%) Analyst
7 26 (5.96%) Full-Stack Developer
8 24 (5.50%) iOS Developer
9 19 (4.36%) IT Support
9 19 (4.36%) React Developer
10 18 (4.13%) .NET Developer
10 18 (4.13%) IT Engineer
10 18 (4.13%) IT Support Engineer
10 18 (4.13%) Lead Developer
10 18 (4.13%) Support Engineer
11 17 (3.90%) Portal Developer
12 16 (3.67%) Mobile Engineer
12 16 (3.67%) Software Support Engineer
13 14 (3.21%) Android Engineer
13 14 (3.21%) Python Engineer
Libraries, Frameworks & Software Standards
1 102 (23.39%) React
2 88 (20.18%) CSS
3 87 (19.95%) HTML
4 75 (17.20%) .NET
5 53 (12.16%) React Native
6 48 (11.01%) RESTful
7 40 (9.17%) .NET Core
8 36 (8.26%) .NET Framework
9 35 (8.03%) JSON
10 32 (7.34%) ASP.NET
11 31 (7.11%) Laravel
12 30 (6.88%) GraphQL
13 28 (6.42%) REST
14 27 (6.19%) Flutter
15 25 (5.73%) HTML5
16 24 (5.50%) CSS3
16 24 (5.50%) Node.js
17 23 (5.28%) XML
18 22 (5.05%) LAMP
19 20 (4.59%) Jest
Miscellaneous
1 34 (7.80%) Self-Motivation
2 27 (6.19%) Cloud Native
3 21 (4.82%) Greenfield Project
4 17 (3.90%) Product Ownership
5 16 (3.67%) Client/Server
6 13 (2.98%) IoT
6 13 (2.98%) Legacy Systems
7 12 (2.75%) Mobile Games
8 10 (2.29%) Foreign Exchange (FX)
9 7 (1.61%) Algorithms
10 6 (1.38%) Data Structures
10 6 (1.38%) Enterprise Software
10 6 (1.38%) EPoS
11 5 (1.15%) Data Centre
11 5 (1.15%) Educational Technology
12 4 (0.92%) Distributed Systems
12 4 (0.92%) e-Learning
12 4 (0.92%) Embedded Systems
12 4 (0.92%) Onboarding
13 3 (0.69%) Animation
Operating Systems
1 109 (25.00%) Android
2 105 (24.08%) Apple iOS
3 32 (7.34%) Windows
4 18 (4.13%) Linux
5 9 (2.06%) Windows Server
6 5 (1.15%) Rocky
7 4 (0.92%) Ubuntu
8 1 (0.23%) Unix
Processes & Methodologies
1 176 (40.37%) Agile
2 114 (26.15%) Problem-Solving
3 103 (23.62%) Software Engineering
4 94 (21.56%) User Experience
5 93 (21.33%) CI/CD
6 75 (17.20%) Mobile Application Development
7 62 (14.22%) E-Commerce
8 59 (13.53%) DevOps
9 52 (11.93%) Full-Stack Development
10 50 (11.47%) Analytics
11 48 (11.01%) Test Automation
12 47 (10.78%) Migration
13 46 (10.55%) OOP
14 45 (10.32%) iOS Development
14 45 (10.32%) Mobile Development
14 45 (10.32%) SDLC
15 44 (10.09%) MVC
16 42 (9.63%) Software Testing
17 40 (9.17%) Computer Science
18 38 (8.72%) Mentoring
Programming Languages
1 135 (30.96%) JavaScript
2 76 (17.43%) SQL
3 65 (14.91%) TypeScript
4 60 (13.76%) C#
5 47 (10.78%) Java
6 45 (10.32%) Python
7 42 (9.63%) Swift
8 36 (8.26%) PHP
9 33 (7.57%) Kotlin
10 18 (4.13%) Go
11 16 (3.67%) Objective-C
12 12 (2.75%) Dart
13 10 (2.29%) C
14 8 (1.83%) C++
15 3 (0.69%) Ladder Logic
16 2 (0.46%) PowerShell
16 2 (0.46%) Rust
17 1 (0.23%) Bash
17 1 (0.23%) Ruby
17 1 (0.23%) T-SQL
Qualifications
1 60 (13.76%) Degree
2 33 (7.57%) Computer Science Degree
3 14 (3.21%) Security Cleared
4 9 (2.06%) SC Cleared
5 7 (1.61%) AWS Certification
6 5 (1.15%) DV Cleared
6 5 (1.15%) Master's Degree
7 4 (0.92%) ACCA
7 4 (0.92%) CHECK Team Leader
7 4 (0.92%) CIMA
8 2 (0.46%) CREST Certified
9 1 (0.23%) Chartered Engineer
9 1 (0.23%) CITP
9 1 (0.23%) DBS Check
9 1 (0.23%) ISTQB
9 1 (0.23%) MBA
9 1 (0.23%) MCT
9 1 (0.23%) Microsoft Certification
9 1 (0.23%) PMI Certification
9 1 (0.23%) TOGAF Certification
Quality Assurance & Compliance
1 44 (10.09%) QA
2 20 (4.59%) Accessibility
3 4 (0.92%) Data Quality
3 4 (0.92%) WCAG
4 1 (0.23%) California Consumer Privacy Act
4 1 (0.23%) GDPR
4 1 (0.23%) Software Quality Assurance
System Software
1 16 (3.67%) Docker
2 13 (2.98%) Active Directory
3 3 (0.69%) Firmware
3 3 (0.69%) LXC
4 1 (0.23%) Embedded Firmware
Systems Management
1 15 (3.44%) Kubernetes
2 14 (3.21%) Terraform
3 8 (1.83%) AirWatch
4 6 (1.38%) Mesos
5 4 (0.92%) Grafana
5 4 (0.92%) Microsoft Intune
5 4 (0.92%) Prometheus
6 2 (0.46%) SCCM
7 1 (0.23%) Ansible
7 1 (0.23%) Rundeck
Vendors
1 67 (15.37%) Microsoft
2 29 (6.65%) Google
3 18 (4.13%) Zoho
4 13 (2.98%) ServiceNow
5 12 (2.75%) Apple
6 10 (2.29%) Adobe
6 10 (2.29%) New Relic
7 8 (1.83%) Samsung
8 7 (1.61%) Twitter
8 7 (1.61%) Xamarin
9 6 (1.38%) Oracle
10 5 (1.15%) Red Hat
11 4 (0.92%) Optimizely
11 4 (0.92%) Rollbar
12 3 (0.69%) Siemens
13 2 (0.46%) iManage
13 2 (0.46%) Salesforce
14 1 (0.23%) CA Agile Central
14 1 (0.23%) Hotjar
14 1 (0.23%) PayPal