Fintech Jobs in England

Financial Technology (FinTech)
UK > England

The table below provides summary statistics for permanent job vacancies advertised in England requiring Fintech skills. It includes a benchmarking guide to the annual salaries offered in vacancies that cited Fintech over the 6 months leading up to 13 June 2025, comparing them to the same period in the previous two years.

6 months to
13 Jun 2025
Same period 2024 Same period 2023
Rank 181 159 106
Rank change year-on-year -22 -53 -37
Permanent jobs citing Fintech 938 1,703 2,553
As % of all permanent jobs advertised in England 1.91% 1.78% 3.11%
As % of the Processes & Methodologies category 2.05% 2.16% 3.26%
Number of salaries quoted 663 1,391 2,274
10th Percentile £27,300 £43,750 £47,500
25th Percentile £55,000 £58,125 £60,000
Median annual salary (50th Percentile) £82,500 £77,500 £85,000
Median % change year-on-year +6.45% -8.82% +17.24%
75th Percentile £110,000 £97,500 £106,250
90th Percentile £137,500 £116,250 £120,000
UK median annual salary £82,500 £77,500 £83,000
% change year-on-year +6.45% -6.63% +15.28%

All Process and Methodology Skills
England

Fintech falls under the Processes and Methodologies category. For comparison with the information above, the following table provides summary statistics for all permanent job vacancies requiring process or methodology skills in England.

Permanent vacancies with a requirement for process or methodology skills 45,849 78,971 78,337
As % of all permanent jobs advertised in England 93.16% 82.62% 95.44%
Number of salaries quoted 23,109 56,258 48,147
10th Percentile £28,500 £29,383 £34,308
25th Percentile £40,000 £40,000 £45,775
Median annual salary (50th Percentile) £57,500 £55,000 £62,500
Median % change year-on-year +4.55% -12.00% +4.17%
75th Percentile £75,000 £72,500 £82,500
90th Percentile £97,500 £92,500 £102,500
UK median annual salary £56,000 £55,000 £60,899
% change year-on-year +1.82% -9.69% +1.50%

Fintech
Job Vacancy Trend in England

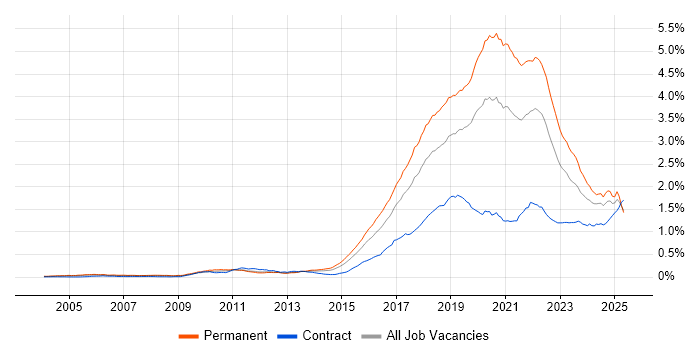
Job postings citing Fintech as a proportion of all IT jobs advertised in England.

Job vacancy trend for Fintech in England

Fintech
Salary Trend in England

3-month moving average salary quoted in jobs citing Fintech in England.

Salary trend for Fintech in England

Fintech
Salary Histogram in England

Salary distribution for jobs citing Fintech in England over the 6 months to 13 June 2025.

Salary histogram for Fintech in England

Fintech
Job Locations in England

The table below looks at the demand and provides a guide to the median salaries quoted in IT jobs citing Fintech within the England region over the 6 months to 13 June 2025. The 'Rank Change' column provides an indication of the change in demand within each location based on the same 6 month period last year.

Location Rank Change
on Same Period
Last Year
Matching
Permanent
IT Job Ads
Median Salary
Past 6 Months
Median Salary
% Change
on Same Period
Last Year
Live
Jobs
London +1 653 £95,000 +11.76% 2,129
North of England +16 130 £50,500 -10.22% 180
North West -38 64 £70,000 +16.67% 122
South East +20 57 £70,000 +3.70% 721
Yorkshire +73 50 £25,625 -48.75% 25
Midlands +47 50 £55,000 -6.38% 52
East Midlands +36 27 £45,000 -30.77% 29
South West +15 26 £25,625 -60.58% 57
West Midlands +41 21 £65,000 +40.54% 23
North East +48 16 £100,000 +135.29% 35
East of England +9 8 £41,250 -34.00% 39
Fintech
UK

Fintech
Co-occurring Skills and Capabilities in England by Category

The follow tables expand on the table above by listing co-occurrences grouped by category. The same employment type, locality and period is covered with up to 20 co-occurrences shown in each of the following categories:

Application Platforms
1 82 (8.74%) Apache Airflow
2 29 (3.09%) Microsoft Exchange
3 18 (1.92%) Apache
4 17 (1.81%) Confluence
5 13 (1.39%) nginx
6 11 (1.17%) IIS
7 8 (0.85%) Apache Spark
8 4 (0.43%) Apache Pulsar
8 4 (0.43%) CMS
8 4 (0.43%) Traefik
9 3 (0.32%) BizTalk Server
10 2 (0.21%) SharePoint
11 1 (0.11%) Luigi
11 1 (0.11%) Oracle Workflow
Applications
1 17 (1.81%) Microsoft Excel
2 13 (1.39%) Microsoft PowerPoint
3 7 (0.75%) Adobe Creative Suite
4 6 (0.64%) Adobe XD
5 4 (0.43%) Sketch
6 3 (0.32%) Microsoft Office
6 3 (0.32%) UserZoom
7 2 (0.21%) Adobe After Effects
7 2 (0.21%) Adobe Illustrator
7 2 (0.21%) InDesign
7 2 (0.21%) Microsoft Project
7 2 (0.21%) MS Visio
7 2 (0.21%) Photoshop
7 2 (0.21%) Spreadsheet
8 1 (0.11%) CINEMA 4D
Business Applications
1 4 (0.43%) Dynamics CRM
1 4 (0.43%) Salesforce CRM
2 3 (0.32%) Payment Gateway
3 2 (0.21%) Refinitiv Enterprise Platform
4 1 (0.11%) Distributed Ledger
4 1 (0.11%) Magento
4 1 (0.11%) Oracle EBS
4 1 (0.11%) Oracle Payables
4 1 (0.11%) Shopify
4 1 (0.11%) Workfront
Cloud Services
1 339 (36.14%) AWS
2 188 (20.04%) GCP
3 146 (15.57%) Azure
4 107 (11.41%) SaaS
5 83 (8.85%) dbt
6 41 (4.37%) GitHub
7 36 (3.84%) Power Platform
8 25 (2.67%) Serverless
9 24 (2.56%) Figma
10 17 (1.81%) GitHub Actions
11 16 (1.71%) AWS Lambda
12 11 (1.17%) Pulumi
13 10 (1.07%) Azure AKS
14 9 (0.96%) Amazon EKS
14 9 (0.96%) Dynamics 365
14 9 (0.96%) Microsoft 365
15 8 (0.85%) Amazon SQS
15 8 (0.85%) PowerApps
16 7 (0.75%) Amazon S3
16 7 (0.75%) Cloud Computing
Communications & Networking
1 14 (1.49%) Firewall
2 10 (1.07%) DNS
3 9 (0.96%) DHCP
4 8 (0.85%) TCP/IP
5 7 (0.75%) Network Security
6 5 (0.53%) HTTP
6 5 (0.53%) NAS
6 5 (0.53%) SAN
6 5 (0.53%) VPN
6 5 (0.53%) VSAN
7 4 (0.43%) ICMP
7 4 (0.43%) Reverse Proxy
8 3 (0.32%) Internet
9 2 (0.21%) Multicast
9 2 (0.21%) SMS
9 2 (0.21%) SSL
10 1 (0.11%) SWIFTNet
10 1 (0.11%) VLAN
Database & Business Intelligence
1 118 (12.58%) PostgreSQL
2 78 (8.32%) Amazon Athena
3 75 (8.00%) Apache Arrow
3 75 (8.00%) Apache Iceberg
3 75 (8.00%) Dremio
4 49 (5.22%) SQL Server
5 41 (4.37%) MySQL
6 39 (4.16%) Relational Database
7 38 (4.05%) NoSQL
8 32 (3.41%) Power BI
9 29 (3.09%) MongoDB
10 23 (2.45%) Data Hub
10 23 (2.45%) SQL CLR
11 19 (2.03%) SQL Server Reporting Services
12 17 (1.81%) SQL Server Analysis Services
13 15 (1.60%) DynamoDB
14 13 (1.39%) Azure SQL Database
14 13 (1.39%) Metadata
15 11 (1.17%) Elasticsearch
16 10 (1.07%) Redis
Development Applications
1 54 (5.76%) Git
2 46 (4.90%) JIRA
3 22 (2.35%) Selenium
4 16 (1.71%) Jenkins
5 15 (1.60%) Postman
6 14 (1.49%) Appium
7 10 (1.07%) Cucumber
8 9 (0.96%) SoapUI
8 9 (0.96%) Visual Studio
9 6 (0.64%) Cypress.io
9 6 (0.64%) git-flow
9 6 (0.64%) Vite
10 5 (0.53%) JMeter
10 5 (0.53%) Oracle Forms
11 4 (0.43%) Fiddler
11 4 (0.43%) LoadRunner
11 4 (0.43%) Maven
11 4 (0.43%) PHPUnit
12 3 (0.32%) JUnit
12 3 (0.32%) webpack
General
1 669 (71.32%) Finance
2 221 (23.56%) Banking
3 217 (23.13%) Social Skills
4 133 (14.18%) Law
5 129 (13.75%) Front Office
6 128 (13.65%) Marketing
7 126 (13.43%) Inclusion and Diversity
8 100 (10.66%) Analytical Skills
9 62 (6.61%) Financial Institution
9 62 (6.61%) Legal
10 28 (2.99%) Back Office
10 28 (2.99%) Presentation Skills
11 17 (1.81%) Mandarin Language
12 16 (1.71%) Influencing Skills
13 15 (1.60%) Advertising
13 15 (1.60%) Investment Banking
14 14 (1.49%) Retail
15 13 (1.39%) Cantonese Language
16 10 (1.07%) Organisational Skills
17 8 (0.85%) Publishing
Job Titles
1 309 (32.94%) Software Engineer
2 253 (26.97%) Developer
3 151 (16.10%) Senior
4 143 (15.25%) Lead
5 112 (11.94%) Developer/Software Engineer
6 78 (8.32%) AWS Engineer
6 78 (8.32%) Java Engineer
7 75 (8.00%) AWS Developer
7 75 (8.00%) AWS Software Engineer
7 75 (8.00%) Python Engineer
8 72 (7.68%) Java Software Engineer
8 72 (7.68%) Python Software Engineer
9 64 (6.82%) Lead Software Engineer
10 60 (6.40%) Python Developer
11 45 (4.80%) Senior Software Engineer
12 41 (4.37%) Java Developer
13 35 (3.73%) Full-Stack Developer
13 35 (3.73%) Senior Developer
14 32 (3.41%) Analyst
15 31 (3.30%) Consultant
Libraries, Frameworks & Software Standards
1 198 (21.11%) React
2 147 (15.67%) AngularJS
3 123 (13.11%) Node.js
4 106 (11.30%) Vue
5 89 (9.49%) Kafka
6 85 (9.06%) Pandas
7 78 (8.32%) NumPy
8 75 (8.00%) SciPy
9 70 (7.46%) .NET
10 69 (7.36%) Spring
11 58 (6.18%) Spring Boot
12 55 (5.86%) RESTful
13 53 (5.65%) HTML
14 52 (5.54%) CSS
15 48 (5.12%) Software Packaging
16 46 (4.90%) Redux
17 34 (3.62%) REST
18 33 (3.52%) .NET Framework
19 27 (2.88%) .NET Core
19 27 (2.88%) Akka
Miscellaneous
1 112 (11.94%) Fixed Income
2 92 (9.81%) Cloud Native
3 90 (9.59%) Foreign Exchange (FX)
4 80 (8.53%) Equities
5 37 (3.94%) Distributed Systems
6 34 (3.62%) Mobile App
7 30 (3.20%) Product Ownership
8 28 (2.99%) Greenfield Project
8 28 (2.99%) Management Information System
9 25 (2.67%) Algorithms
9 25 (2.67%) Hedge funds
10 24 (2.56%) Private Cloud
11 21 (2.24%) Public Cloud
12 20 (2.13%) Analytical Mindset
12 20 (2.13%) Onboarding
13 19 (2.03%) Client/Server
13 19 (2.03%) Team-Oriented Environment
14 17 (1.81%) Mobile Banking
15 15 (1.60%) Social Media
16 12 (1.28%) Derivative
Operating Systems
1 51 (5.44%) Windows
2 45 (4.80%) Linux
3 23 (2.45%) Windows Server
4 13 (1.39%) Apple iOS
5 11 (1.17%) Android
6 5 (0.53%) Unix
7 3 (0.32%) VMS
8 1 (0.11%) Mac OS X
8 1 (0.11%) Windows 10
Processes & Methodologies
1 403 (42.96%) Software Engineering
2 343 (36.57%) Agile
3 163 (17.38%) CI/CD
4 157 (16.74%) Problem-Solving
5 151 (16.10%) Microservices
6 132 (14.07%) Asset Management
7 127 (13.54%) Artificial Intelligence
8 120 (12.79%) Risk Management
9 111 (11.83%) Investment Management
10 104 (11.09%) User Experience
11 100 (10.66%) DevOps
12 89 (9.49%) Analytics
13 88 (9.38%) TDD
14 83 (8.85%) Cybersecurity
15 80 (8.53%) Full-Stack Development
16 79 (8.42%) SDLC
17 77 (8.21%) Test Automation
18 75 (8.00%) Performance Attribution
19 73 (7.78%) Mathematics
20 69 (7.36%) Line Management
Programming Languages
1 247 (26.33%) Python
2 221 (23.56%) Java
3 199 (21.22%) JavaScript
4 189 (20.15%) TypeScript
5 169 (18.02%) SQL
6 76 (8.10%) Go
7 68 (7.25%) C#
8 46 (4.90%) Kotlin
9 41 (4.37%) PHP
10 31 (3.30%) C++
11 22 (2.35%) T-SQL
12 18 (1.92%) C
13 17 (1.81%) PowerShell
14 10 (1.07%) Bash
14 10 (1.07%) Bicep
15 9 (0.96%) Scala
16 8 (0.85%) Ruby
16 8 (0.85%) Rust
17 6 (0.64%) R
18 4 (0.43%) Groovy
Qualifications
1 134 (14.29%) Degree
2 15 (1.60%) Computer Science Degree
3 13 (1.39%) AWS Certification
3 13 (1.39%) Master's Degree
4 8 (0.85%) ISTQB
5 6 (0.64%) AWS Certified Solutions Architect
5 6 (0.64%) Microsoft Certification
6 5 (0.53%) Azure Certification
6 5 (0.53%) PhD
6 5 (0.53%) VMware Certified Professional (VCP)
7 4 (0.43%) PMI Certification
8 3 (0.32%) CISSP
8 3 (0.32%) PMP
9 2 (0.21%) A+ Certification
9 2 (0.21%) CCSP
9 2 (0.21%) CEH
9 2 (0.21%) Cisco Certification
9 2 (0.21%) MBA
9 2 (0.21%) OSCP
9 2 (0.21%) Postgraduate
Quality Assurance & Compliance
1 40 (4.26%) QA
2 16 (1.71%) Accessibility
3 12 (1.28%) GDPR
4 7 (0.75%) SLA
5 6 (0.64%) ISO/IEC 27001
6 5 (0.53%) PCI DSS
7 4 (0.43%) Data Quality
7 4 (0.43%) NIST
8 3 (0.32%) GAAP
8 3 (0.32%) SOC 2
9 2 (0.21%) COBIT
9 2 (0.21%) Cyber Essentials
9 2 (0.21%) GRC
9 2 (0.21%) Sarbanes-Oxley
10 1 (0.11%) Cyber Essentials PLUS
10 1 (0.11%) ISO 20022
10 1 (0.11%) PMO
10 1 (0.11%) PSD2
10 1 (0.11%) WCAG
System Software
1 107 (11.41%) Docker
2 25 (2.67%) VMware Infrastructure
3 5 (0.53%) VMware NSX
4 3 (0.32%) Active Directory
4 3 (0.32%) HDFS
5 2 (0.21%) Virtual Machines
6 1 (0.11%) Hyper-V
6 1 (0.11%) VMware ESXi
6 1 (0.11%) vSphere
Systems Management
1 140 (14.93%) Kubernetes
2 64 (6.82%) Terraform
3 16 (1.71%) Ansible
3 16 (1.71%) Progress Chef
4 15 (1.60%) Microsoft Intune
5 13 (1.39%) Failover Clustering
6 12 (1.28%) Grafana
7 10 (1.07%) Argo
7 10 (1.07%) Podman
7 10 (1.07%) Puppet
8 9 (0.96%) Prometheus
8 9 (0.96%) SCCM
9 8 (0.85%) Mesos
10 4 (0.43%) HAProxy
11 3 (0.32%) Kibana
11 3 (0.32%) Kubeflow
11 3 (0.32%) logstash
12 2 (0.21%) Graylog
13 1 (0.11%) Check_MK
13 1 (0.11%) FortiGate
Vendors
1 55 (5.86%) Microsoft
2 37 (3.94%) Oracle
3 35 (3.73%) VMware
4 34 (3.62%) Google
5 19 (2.03%) Adobe
6 15 (1.60%) Salesforce
7 10 (1.07%) Palo Alto
8 7 (0.75%) Databricks
8 7 (0.75%) ServiceNow
9 5 (0.53%) CA Agile Central
9 5 (0.53%) Citrix
10 4 (0.43%) HubSpot
11 3 (0.32%) Alibaba
11 3 (0.32%) Revolut
12 2 (0.21%) Apple
12 2 (0.21%) Atlassian
12 2 (0.21%) Bloomberg
12 2 (0.21%) Refinitiv
12 2 (0.21%) Splunk
13 1 (0.11%) Avaloq