Virtual Team Jobs in England

Virtual Team (including Distributed Team, Remote Team, Dispersed Team)
UK > England

The table below looks at the prevalence of the term Virtual Team in permanent job vacancies in England. Included is a benchmarking guide to the salaries offered in vacancies that cited Virtual Team over the 6 months leading up to 31 May 2025, comparing them to the same period in the previous two years.

6 months to
31 May 2025
Same period 2024 Same period 2023
Rank 422 456 232
Rank change year-on-year +34 -224 +10
Permanent jobs citing Virtual Team 272 443 1,376
As % of all permanent jobs advertised in England 0.55% 0.49% 1.62%
As % of the Miscellaneous category 1.46% 1.46% 3.66%
Number of salaries quoted 150 276 473
10th Percentile £36,100 £43,750 £42,750
25th Percentile £46,563 £50,035 £57,500
Median annual salary (50th Percentile) £65,000 £62,500 £60,899
Median % change year-on-year +4.00% +2.63% -13.00%
75th Percentile £92,500 £87,500 £78,750
90th Percentile £110,500 £133,750 £102,237
UK median annual salary £65,000 £63,250 £60,899
% change year-on-year +2.77% +3.86% -13.00%

All Generic Skills
England

Virtual Team falls under the General and Transferable Skills category. For comparison with the information above, the following table provides summary statistics for all permanent job vacancies requiring generic IT skills in England.

Permanent vacancies with a requirement for generic IT skills 18,639 30,336 37,575
As % of all permanent jobs advertised in England 37.80% 33.77% 44.12%
Number of salaries quoted 8,618 20,935 20,403
10th Percentile £30,940 £28,000 £36,000
25th Percentile £42,000 £38,000 £46,686
Median annual salary (50th Percentile) £60,000 £55,000 £65,000
Median % change year-on-year +9.09% -15.38% +4.00%
75th Percentile £80,000 £75,000 £87,500
90th Percentile £110,000 £100,000 £110,000
UK median annual salary £60,000 £55,000 £65,000
% change year-on-year +9.09% -15.38% +4.00%

Virtual Team
Job Vacancy Trend in England

Job postings citing Virtual Team as a proportion of all IT jobs advertised in England.
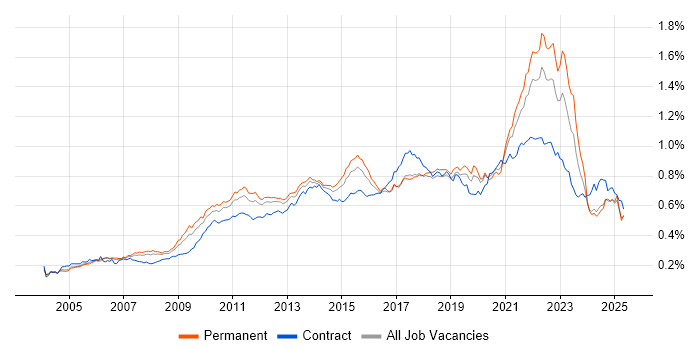
Job vacancy trend for Virtual Team in England

Virtual Team
Salary Trend in England

3-month moving average salary quoted in jobs citing Virtual Team in England.

Salary trend for Virtual Team in England

Virtual Team
Salary Histogram in England

Salary distribution for jobs citing Virtual Team in England over the 6 months to 31 May 2025.

Salary histogram for Virtual Team in England

Virtual Team
Job Locations in England

The table below looks at the demand and provides a guide to the median salaries quoted in IT jobs citing Virtual Team within the England region over the 6 months to 31 May 2025. The 'Rank Change' column provides an indication of the change in demand within each location based on the same 6 month period last year.

Location Rank Change
on Same Period
Last Year
Matching
Permanent
IT Job Ads
Median Salary
Past 6 Months
Median Salary
% Change
on Same Period
Last Year
Live
Jobs
London +28 104 £77,500 -3.13% 333
South East +89 66 £40,000 -33.33% 62
East of England +59 25 £55,000 +12.47% 16
North of England +10 25 £60,500 +10.00% 42
South West +84 19 £56,250 +12.50% 22
Yorkshire +62 18 £78,750 +43.18% 17
Midlands +12 18 £50,000 -13.04% 47
West Midlands +16 17 £50,000 -13.04% 31
North West -27 6 £56,250 - 24
North East +45 1 £25,000 -54.55% 1
East Midlands +32 1 - - 16
Virtual Team
UK

Virtual Team
Co-occurring Skills and Capabilities in England by Category

The follow tables expand on the table above by listing co-occurrences grouped by category. The same employment type, locality and period is covered with up to 20 co-occurrences shown in each of the following categories:

Application Platforms
1 22 (8.09%) Microsoft Exchange
2 11 (4.04%) Confluence
3 2 (0.74%) ArcGIS
4 1 (0.37%) Apache Airflow
4 1 (0.37%) OpenStack
4 1 (0.37%) SharePoint
Applications
1 7 (2.57%) Microsoft Office
2 5 (1.84%) Microsoft Excel
3 4 (1.47%) Microsoft PowerPoint
4 1 (0.37%) MS Visio
Business Applications
1 12 (4.41%) Dynamics AX
2 9 (3.31%) NetSuite
3 3 (1.10%) Dynamics CRM
4 2 (0.74%) Magento
5 1 (0.37%) Oracle ERP
5 1 (0.37%) Salesforce CRM
5 1 (0.37%) SAP ERP
5 1 (0.37%) SAP HCM
Cloud Services
1 38 (13.97%) Azure
2 31 (11.40%) AWS
3 17 (6.25%) SaaS
4 15 (5.51%) Dynamics 365
5 10 (3.68%) GCP
5 10 (3.68%) GitHub
6 9 (3.31%) Boomi
6 9 (3.31%) Power Platform
7 7 (2.57%) Serverless
8 5 (1.84%) Entra ID
8 5 (1.84%) IaaS
8 5 (1.84%) OpenShift
8 5 (1.84%) PaaS
9 4 (1.47%) Amazon S3
9 4 (1.47%) AWS Lambda
9 4 (1.47%) Azure DevOps
9 4 (1.47%) Cloud Computing
9 4 (1.47%) Microsoft 365
9 4 (1.47%) Microsoft Purview
10 3 (1.10%) Smartsheet
Communications & Networking
1 22 (8.09%) WAN
1 22 (8.09%) Wireless
2 18 (6.62%) LAN
3 17 (6.25%) Internet
4 11 (4.04%) Firewall
5 8 (2.94%) DNS
6 7 (2.57%) SSL
7 5 (1.84%) SD-WAN
8 4 (1.47%) VPN
9 3 (1.10%) Intranet
10 2 (0.74%) Cisco IOS
10 2 (0.74%) TCP/IP
11 1 (0.37%) DHCP
11 1 (0.37%) HTTPS
11 1 (0.37%) MPLS
11 1 (0.37%) Multicast
11 1 (0.37%) Network Security
11 1 (0.37%) OSPF
11 1 (0.37%) PuTTY
11 1 (0.37%) WLAN
Database & Business Intelligence
1 17 (6.25%) Relational Database
2 11 (4.04%) SQL Server
3 10 (3.68%) MySQL
4 7 (2.57%) DTS
5 6 (2.21%) Metadata
6 5 (1.84%) Power BI
7 4 (1.47%) Amazon RDS
7 4 (1.47%) Data Warehouse
7 4 (1.47%) Metadata Repository
8 3 (1.10%) MongoDB
8 3 (1.10%) NoSQL
9 2 (0.74%) Elasticsearch
9 2 (0.74%) GIS
9 2 (0.74%) PostgreSQL
9 2 (0.74%) QGIS
10 1 (0.37%) DynamoDB
10 1 (0.37%) Tableau
Development Applications
1 31 (11.40%) Git
2 25 (9.19%) JIRA
3 21 (7.72%) Jenkins
4 6 (2.21%) MSTest
5 5 (1.84%) GitLab
6 4 (1.47%) TeamCity
7 3 (1.10%) GDB
7 3 (1.10%) NUnit
7 3 (1.10%) SpecFlow
8 2 (0.74%) Cypress.io
8 2 (0.74%) Spinnaker
8 2 (0.74%) Team Foundation Server
8 2 (0.74%) webpack
9 1 (0.37%) Cucumber
9 1 (0.37%) FitNesse
9 1 (0.37%) Newman
9 1 (0.37%) Selenium
9 1 (0.37%) TestNG
9 1 (0.37%) Vite
9 1 (0.37%) WebDriver
General
1 112 (41.18%) Social Skills
2 102 (37.50%) Finance
3 36 (13.24%) Analytical Skills
4 35 (12.87%) Inclusion and Diversity
5 29 (10.66%) Law
6 22 (8.09%) Banking
7 21 (7.72%) German Language
8 16 (5.88%) Presentation Skills
9 15 (5.51%) Legal
10 13 (4.78%) Marketing
11 9 (3.31%) Organisational Skills
12 7 (2.57%) Retail
13 6 (2.21%) Advertising
13 6 (2.21%) Documentation Skills
13 6 (2.21%) Influencing Skills
14 5 (1.84%) Electronics
14 5 (1.84%) Front Office
15 4 (1.47%) Financial Institution
15 4 (1.47%) Police
16 3 (1.10%) Telecoms
Job Titles
1 45 (16.54%) Senior
2 31 (11.40%) Developer
3 23 (8.46%) Lead
4 21 (7.72%) Information Security Specialist
4 21 (7.72%) Information Specialist
4 21 (7.72%) Security Specialist
5 16 (5.88%) Infrastructure Support
5 16 (5.88%) Network Support
6 14 (5.15%) Analyst
7 13 (4.78%) Development Manager
7 13 (4.78%) Project Manager
7 13 (4.78%) Senior Developer
8 11 (4.04%) IT Manager
8 11 (4.04%) Senior Manager
9 10 (3.68%) Software Manager
10 9 (3.31%) NetSuite Developer
10 9 (3.31%) Software Engineer
10 9 (3.31%) Technical Developer
11 8 (2.94%) Engineering Manager
12 6 (2.21%) C# Developer
Libraries, Frameworks & Software Standards
1 23 (8.46%) CSS
2 21 (7.72%) SailPoint
3 19 (6.99%) PyTorch
4 18 (6.62%) HTML
5 17 (6.25%) .NET
5 17 (6.25%) NumPy
5 17 (6.25%) OpenCV
5 17 (6.25%) Pandas
5 17 (6.25%) SciPy
6 16 (5.88%) OAuth
7 11 (4.04%) Web Services
7 11 (4.04%) XML
8 9 (3.31%) Middleware
8 9 (3.31%) Restlet
8 9 (3.31%) SAML
9 8 (2.94%) ASP.NET
9 8 (2.94%) React
9 8 (2.94%) RESTful
10 7 (2.57%) Node.js
10 7 (2.57%) UIKit
Miscellaneous
1 40 (14.71%) Management Information System
2 20 (7.35%) Algorithms
3 17 (6.25%) Cloud Native
3 17 (6.25%) Robotics
4 14 (5.15%) Onboarding
5 13 (4.78%) Self-Motivation
6 9 (3.31%) Product Ownership
7 8 (2.94%) Distributed Systems
7 8 (2.94%) Fixed Income
8 5 (1.84%) Cyber Threat
8 5 (1.84%) Data Centre
8 5 (1.84%) Derivative
8 5 (1.84%) Foreign Exchange (FX)
8 5 (1.84%) Tandem
9 4 (1.47%) Enterprise Software
10 3 (1.10%) Credit Derivative
10 3 (1.10%) CSOC
10 3 (1.10%) Equities
10 3 (1.10%) PKI
10 3 (1.10%) Security Posture
Operating Systems
1 24 (8.82%) Windows
2 9 (3.31%) Linux
3 7 (2.57%) Android
3 7 (2.57%) Apple iOS
4 6 (2.21%) zOS
5 3 (1.10%) Embedded Linux
6 2 (0.74%) Unix
7 1 (0.37%) Windows Server
Processes & Methodologies
1 104 (38.24%) Agile
2 56 (20.59%) Virtual Team Management
3 51 (18.75%) Mentoring
3 51 (18.75%) Problem-Solving
4 47 (17.28%) Collaborative Working
5 42 (15.44%) Risk Management
6 39 (14.34%) CI/CD
7 35 (12.87%) Software Engineering
8 33 (12.13%) Project Management
9 30 (11.03%) Information Security
9 30 (11.03%) Roadmaps
10 29 (10.66%) DevOps
10 29 (10.66%) Stakeholder Management
11 28 (10.29%) Identity Access Management
12 27 (9.93%) Computer Science
13 25 (9.19%) Machine Learning
14 23 (8.46%) Analytics
14 23 (8.46%) Artificial Intelligence
14 23 (8.46%) Continuous Improvement
14 23 (8.46%) ITIL
Programming Languages
1 46 (16.91%) Python
2 33 (12.13%) Java
3 30 (11.03%) SQL
4 29 (10.66%) JavaScript
4 29 (10.66%) PowerShell
5 24 (8.82%) C#
6 10 (3.68%) Kotlin
7 9 (3.31%) PHP
8 8 (2.94%) C++
8 8 (2.94%) TypeScript
9 7 (2.57%) Swift
10 4 (1.47%) C
11 3 (1.10%) Bash
11 3 (1.10%) Groovy
12 2 (0.74%) Scala
12 2 (0.74%) VB.NET
12 2 (0.74%) XQuery
13 1 (0.37%) ActionScript
13 1 (0.37%) Shell Script
13 1 (0.37%) XPath
Qualifications
1 118 (43.38%) Degree
2 42 (15.44%) Master's Degree
3 20 (7.35%) PhD
4 16 (5.88%) Computer Science Degree
4 16 (5.88%) MBA
5 11 (4.04%) Security Cleared
6 8 (2.94%) Azure Certification
6 8 (2.94%) CISSP
7 7 (2.57%) SC Cleared
8 6 (2.21%) PMP
8 6 (2.21%) Six Sigma Black Belt
8 6 (2.21%) Six Sigma Green Belt
9 5 (1.84%) Cisco Certification
9 5 (1.84%) GCIA
9 5 (1.84%) GCIH
9 5 (1.84%) Numerate Degree
9 5 (1.84%) OSCE
9 5 (1.84%) OSCP
10 4 (1.47%) AWS Certification
11 3 (1.10%) DV Cleared
Quality Assurance & Compliance
1 18 (6.62%) QA
2 9 (3.31%) Accessibility
3 7 (2.57%) Sarbanes-Oxley
4 6 (2.21%) GDPR
5 4 (1.47%) California Consumer Privacy Act
5 4 (1.47%) Data Quality
6 3 (1.10%) JTAG
6 3 (1.10%) Software Quality Assurance
7 1 (0.37%) ISO 9001
7 1 (0.37%) MiFID
7 1 (0.37%) PMO
7 1 (0.37%) WCAG
System Software
1 28 (10.29%) Active Directory
2 7 (2.57%) Docker
3 3 (1.10%) Firmware
4 1 (0.37%) KVM
4 1 (0.37%) VMware Infrastructure
Systems Management
1 16 (5.88%) Ansible
2 15 (5.51%) Kubernetes
2 15 (5.51%) Terraform
3 9 (3.31%) Single Sign-On
4 5 (1.84%) CSIRT
5 3 (1.10%) CASB
5 3 (1.10%) Microsoft Intune
5 3 (1.10%) Puppet
5 3 (1.10%) QRadar
6 2 (0.74%) Argo
6 2 (0.74%) EMC NetWorker
6 2 (0.74%) Progress Chef
7 1 (0.37%) SCCM
Vendors
1 46 (16.91%) Microsoft
2 22 (8.09%) Salesforce
3 21 (7.72%) Okta
4 16 (5.88%) Unisys
5 10 (3.68%) Dell
6 9 (3.31%) IBM
6 9 (3.31%) MuleSoft
6 9 (3.31%) SAP
7 7 (2.57%) Google
8 6 (2.21%) Cisco
9 5 (1.84%) ServiceNow
10 4 (1.47%) Oracle
11 3 (1.10%) HP
11 3 (1.10%) Symantec
11 3 (1.10%) TikTok
11 3 (1.10%) VMware
11 3 (1.10%) Zscaler
12 2 (0.74%) BMC
12 2 (0.74%) Confluent
12 2 (0.74%) Red Hat