Stakeholder Engagement Jobs in England

Stakeholder Engagement
UK > England

The table below provides summary statistics for permanent job vacancies advertised in England requiring Stakeholder Engagement skills. It includes a benchmarking guide to the annual salaries offered in vacancies that cited Stakeholder Engagement over the 6 months leading up to 30 May 2025, comparing them to the same period in the previous two years.

6 months to
30 May 2025
Same period 2024 Same period 2023
Rank 122 277 368
Rank change year-on-year +155 +91 +23
Permanent jobs citing Stakeholder Engagement 1,319 891 761
As % of all permanent jobs advertised in England 2.69% 1.00% 0.88%
As % of the Processes & Methodologies category 2.86% 1.18% 0.92%
Number of salaries quoted 755 627 475
10th Percentile £39,500 £36,500 £41,250
25th Percentile £50,967 £42,500 £52,500
Median annual salary (50th Percentile) £62,000 £55,000 £66,000
Median % change year-on-year +12.73% -16.67% +10.00%
75th Percentile £75,375 £75,000 £82,500
90th Percentile £95,000 £95,000 £95,000
UK median annual salary £62,000 £55,000 £65,000
% change year-on-year +12.73% -15.38% +8.33%

All Process and Methodology Skills
England

Stakeholder Engagement falls under the Processes and Methodologies category. For comparison with the information above, the following table provides summary statistics for all permanent job vacancies requiring process or methodology skills in England.

Permanent vacancies with a requirement for process or methodology skills 46,039 75,199 82,570
As % of all permanent jobs advertised in England 94.03% 84.05% 95.58%
Number of salaries quoted 22,875 54,702 49,146
10th Percentile £29,500 £29,000 £34,452
25th Percentile £41,250 £40,000 £46,000
Median annual salary (50th Percentile) £57,500 £55,000 £62,500
Median % change year-on-year +4.55% -12.00% +4.17%
75th Percentile £75,000 £72,500 £82,500
90th Percentile £97,528 £93,750 £102,500
UK median annual salary £57,443 £55,000 £60,899
% change year-on-year +4.44% -9.69% +1.50%

Stakeholder Engagement
Job Vacancy Trend in England

Job postings citing Stakeholder Engagement as a proportion of all IT jobs advertised in England.
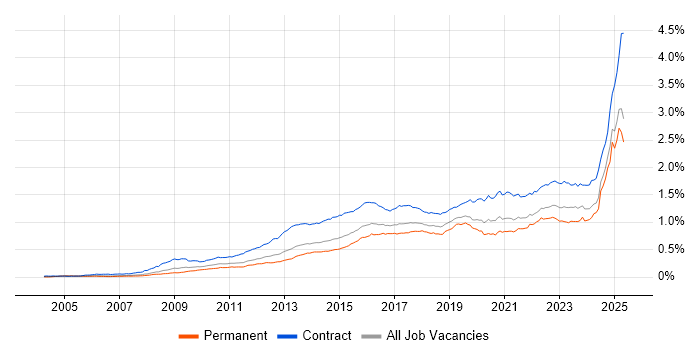
Job vacancy trend for Stakeholder Engagement in England

Stakeholder Engagement
Salary Trend in England

3-month moving average salary quoted in jobs citing Stakeholder Engagement in England.

Salary trend for Stakeholder Engagement in England

Stakeholder Engagement
Salary Histogram in England

Salary distribution for jobs citing Stakeholder Engagement in England over the 6 months to 30 May 2025.

Salary histogram for Stakeholder Engagement in England

Stakeholder Engagement
Job Locations in England

The table below looks at the demand and provides a guide to the median salaries quoted in IT jobs citing Stakeholder Engagement within the England region over the 6 months to 30 May 2025. The 'Rank Change' column provides an indication of the change in demand within each location based on the same 6 month period last year.

Location Rank Change
on Same Period
Last Year
Matching
Permanent
IT Job Ads
Median Salary
Past 6 Months
Median Salary
% Change
on Same Period
Last Year
Live
Jobs
North of England +165 428 £55,000 +1.85% 936
North West +151 376 £50,000 -4.76% 428
London +68 327 £77,500 +29.17% 636
South East +212 298 £62,000 +14.50% 1,307
East of England +116 121 £50,967 +1.93% 620
Midlands +59 90 £52,344 -4.31% 833
West Midlands +58 74 £51,887 -5.14% 452
Yorkshire +50 49 £65,000 +21.27% 392
South West +59 43 £60,000 -4.00% 519
East Midlands +18 14 £60,000 +37.93% 325
North East +43 3 £42,123 -23.41% 118
Stakeholder Engagement
UK

Stakeholder Engagement
Co-occurring Skills and Capabilities in England by Category

The follow tables expand on the table above by listing co-occurrences grouped by category. The same employment type, locality and period is covered with up to 20 co-occurrences shown in each of the following categories:

Application Platforms
1 29 (2.20%) SharePoint
2 20 (1.52%) Confluence
3 8 (0.61%) Apache Spark
4 5 (0.38%) CMS
4 5 (0.38%) Microsoft Exchange
5 4 (0.30%) SAS
6 3 (0.23%) nginx
7 2 (0.15%) Apache
7 2 (0.15%) Drupal
7 2 (0.15%) Umbraco
7 2 (0.15%) WordPress
8 1 (0.076%) ArcGIS
8 1 (0.076%) Sitecore CMS
Applications
1 25 (1.90%) Microsoft Excel
2 19 (1.44%) Microsoft Project
3 17 (1.29%) Microsoft Office
4 15 (1.14%) MS Visio
5 11 (0.83%) Maya
6 9 (0.68%) Microsoft PowerPoint
7 8 (0.61%) Trello
8 5 (0.38%) Chatbot
9 3 (0.23%) Adobe XD
10 2 (0.15%) Adobe Creative Suite
10 2 (0.15%) Notion
11 1 (0.076%) Blender
11 1 (0.076%) CATIA
11 1 (0.076%) SPSS
11 1 (0.076%) SPSS Modeler
Business Applications
1 66 (5.00%) Teamcenter
2 65 (4.93%) Sparx Enterprise Architect
3 20 (1.52%) Dynamics CRM
4 8 (0.61%) Salesforce CRM
5 7 (0.53%) SAP S/4HANA
6 5 (0.38%) Oracle ERP
6 5 (0.38%) Oracle Payables
7 4 (0.30%) Dynamics GP
7 4 (0.30%) Dynamics NAV
7 4 (0.30%) IBM Planning Analytics
7 4 (0.30%) Oracle Receivables
8 3 (0.23%) Elite 3E
8 3 (0.23%) NetSuite
8 3 (0.23%) Oracle EBS
8 3 (0.23%) SAP CX
8 3 (0.23%) Shopify
9 2 (0.15%) Carpe Diem
9 2 (0.15%) Oracle Cash Management
9 2 (0.15%) Oracle EBS R12
9 2 (0.15%) Oracle General Ledger
Cloud Services
1 153 (11.60%) Azure
2 100 (7.58%) Power Platform
3 84 (6.37%) AWS
4 61 (4.62%) SaaS
5 58 (4.40%) GCP
6 47 (3.56%) Microsoft 365
7 32 (2.43%) Dynamics 365
8 23 (1.74%) Azure DevOps
9 20 (1.52%) Azure Data Factory
10 15 (1.14%) Azure Synapse Analytics
10 15 (1.14%) PowerApps
11 14 (1.06%) Azure Monitor
11 14 (1.06%) Salsify
12 13 (0.99%) Boomi
12 13 (0.99%) Entra ID
13 12 (0.91%) Miro
14 11 (0.83%) Power Automate
14 11 (0.83%) Salesforce Commerce Cloud
15 10 (0.76%) Amazon EC2
15 10 (0.76%) Amazon S3
Communications & Networking
1 17 (1.29%) WAN
2 14 (1.06%) VPN
3 13 (0.99%) Network Security
4 12 (0.91%) Firewall
5 11 (0.83%) SD-WAN
5 11 (0.83%) Wireless
6 7 (0.53%) Wi-Fi
7 6 (0.45%) LAN
8 4 (0.30%) BGP
8 4 (0.30%) DNS
8 4 (0.30%) Intrusion Detection
8 4 (0.30%) OSPF
8 4 (0.30%) SAN
8 4 (0.30%) VLAN
9 3 (0.23%) NAS
10 2 (0.15%) ADSL2
10 2 (0.15%) Intranet
10 2 (0.15%) Remote Desktop
10 2 (0.15%) SSL
10 2 (0.15%) X.509
Database & Business Intelligence
1 79 (5.99%) Power BI
2 32 (2.43%) Metadata
3 29 (2.20%) Tableau
4 25 (1.90%) Data Warehouse
5 17 (1.29%) Data Lake
6 11 (0.83%) Amazon Redshift
7 10 (0.76%) BigQuery
7 10 (0.76%) NoSQL
8 9 (0.68%) Big Data
8 9 (0.68%) Data Hub
8 9 (0.68%) GIS
9 7 (0.53%) Amazon RDS
9 7 (0.53%) Hadoop
9 7 (0.53%) PostgreSQL
9 7 (0.53%) Relational Database
9 7 (0.53%) SQL Server
10 4 (0.30%) Looker
10 4 (0.30%) Power Query
10 4 (0.30%) Snowflake Schema
11 3 (0.23%) MariaDB
Development Applications
1 166 (12.59%) Rational DOORS
2 55 (4.17%) JIRA
3 5 (0.38%) Git
3 5 (0.38%) Jenkins
4 3 (0.23%) Axure RP
4 3 (0.23%) Balsamiq
4 3 (0.23%) GitLab
5 2 (0.15%) Artifactory
5 2 (0.15%) ER Studio
5 2 (0.15%) Selenium
5 2 (0.15%) Sonatype Nexus
6 1 (0.076%) Cucumber
6 1 (0.076%) Cypress.io
6 1 (0.076%) JMeter
6 1 (0.076%) Octopus Deploy
6 1 (0.076%) SoapUI
6 1 (0.076%) Subversion
6 1 (0.076%) Yeoman
General
1 649 (49.20%) Social Skills
2 282 (21.38%) Analytical Skills
3 245 (18.57%) Finance
4 137 (10.39%) Influencing Skills
5 112 (8.49%) Law
6 108 (8.19%) Legal
7 104 (7.88%) Electronics
8 68 (5.16%) Marketing
9 58 (4.40%) Public Sector
10 55 (4.17%) Retail
11 49 (3.71%) Inclusion and Diversity
12 48 (3.64%) Banking
13 37 (2.81%) Presentation Skills
14 16 (1.21%) Organisational Skills
15 15 (1.14%) Games
15 15 (1.14%) Manufacturing
16 13 (0.99%) Local Government
17 12 (0.91%) Advertising
18 11 (0.83%) Telecoms
19 8 (0.61%) Financial Institution
Job Titles
1 267 (20.24%) Support Engineer
2 266 (20.17%) Senior
3 262 (19.86%) Software Support Engineer
4 195 (14.78%) Analyst
5 167 (12.66%) Systems Engineer
6 114 (8.64%) Principal Engineer
7 102 (7.73%) Lead
7 102 (7.73%) Senior Systems Engineer
8 89 (6.75%) Change Analyst
9 88 (6.67%) Business Change Analyst
10 86 (6.52%) Architect
11 73 (5.53%) Project Manager
12 68 (5.16%) Platform Engineer
13 53 (4.02%) Senior Manager
14 36 (2.73%) Consultant
15 32 (2.43%) Business Analyst
16 31 (2.35%) Solutions Architect
17 23 (1.74%) Developer
18 22 (1.67%) Cybersecurity Consultant
18 22 (1.67%) Security Consultant
Libraries, Frameworks & Software Standards
1 13 (0.99%) REST
2 11 (0.83%) Hugging Face
2 11 (0.83%) LangChain
2 11 (0.83%) PyTorch
2 11 (0.83%) TensorFlow
3 10 (0.76%) .NET
3 10 (0.76%) React
4 9 (0.68%) Middleware
5 7 (0.53%) Kafka
5 7 (0.53%) SOAP
6 6 (0.45%) XML
7 5 (0.38%) JSON
8 4 (0.30%) Lightning Web Components
8 4 (0.30%) SailPoint
8 4 (0.30%) Web Services
9 3 (0.23%) ARM Templates
9 3 (0.23%) CSS
9 3 (0.23%) EDI
9 3 (0.23%) HTML
9 3 (0.23%) RESTful
Miscellaneous
1 127 (9.63%) Product Ownership
2 121 (9.17%) Management Information System
3 107 (8.11%) Algorithms
4 61 (4.62%) Analytical Mindset
5 31 (2.35%) Cloud Native
6 27 (2.05%) Enterprise Software
7 24 (1.82%) Life Science
8 23 (1.74%) Self-Motivation
9 21 (1.59%) Onboarding
10 18 (1.36%) Data Centre
11 17 (1.29%) FMCG
11 17 (1.29%) Taxonomies
12 15 (1.14%) Legacy Systems
12 15 (1.14%) Social Media
13 14 (1.06%) Data Structures
13 14 (1.06%) Operational Technology
14 12 (0.91%) SCADA
15 10 (0.76%) Hybrid Cloud
16 9 (0.68%) Driving Licence
16 9 (0.68%) NHS
Operating Systems
1 20 (1.52%) Windows
2 9 (0.68%) Windows Server
3 8 (0.61%) Android
3 8 (0.61%) Apple iOS
3 8 (0.61%) Linux
4 6 (0.45%) Red Hat Enterprise Linux
4 6 (0.45%) Windows Vista
5 3 (0.23%) Windows Server 2019
6 2 (0.15%) Mac OS
6 2 (0.15%) VMS
Processes & Methodologies
1 338 (25.63%) Problem-Solving
2 284 (21.53%) Agile
3 281 (21.30%) Continuous Improvement
4 199 (15.09%) Mentoring
5 188 (14.25%) Roadmaps
6 184 (13.95%) Change Management
7 181 (13.72%) Project Management
8 171 (12.96%) Strategic Thinking
9 160 (12.13%) Stakeholder Management
10 156 (11.83%) Technical Leadership
11 140 (10.61%) Business Analysis
12 133 (10.08%) Analytics
13 124 (9.40%) Collaborative Working
14 121 (9.17%) Business Case
15 119 (9.02%) Risk Management
16 116 (8.79%) Workshop Facilitation
17 111 (8.42%) Project Delivery
18 107 (8.11%) Decision-Making
18 107 (8.11%) Systems Engineering
19 101 (7.66%) Signal Processing
Programming Languages
1 114 (8.64%) R
2 68 (5.16%) SQL
3 52 (3.94%) Python
4 25 (1.90%) JavaScript
5 16 (1.21%) PowerShell
6 13 (0.99%) C#
6 13 (0.99%) Java
7 7 (0.53%) Scala
8 6 (0.45%) Data Analysis Expressions
9 4 (0.30%) Bash
9 4 (0.30%) TypeScript
10 3 (0.23%) Shell Script
10 3 (0.23%) SPARQL
10 3 (0.23%) VBA
11 2 (0.15%) Apex Code
11 2 (0.15%) Bicep
11 2 (0.15%) COBOL
11 2 (0.15%) PHP
11 2 (0.15%) T-SQL
11 2 (0.15%) X++
Qualifications
1 447 (33.89%) BPSS Clearance
2 386 (29.26%) Degree
3 107 (8.11%) CBAP
4 68 (5.16%) TOGAF Certification
5 58 (4.40%) CISSP
6 51 (3.87%) CISM
7 49 (3.71%) Security Cleared
8 39 (2.96%) PMI Certification
9 38 (2.88%) Master's Degree
10 35 (2.65%) PMP
11 32 (2.43%) SC Cleared
12 27 (2.05%) CRISC
13 20 (1.52%) Computer Science Degree
13 20 (1.52%) Microsoft Certification
14 13 (0.99%) Azure Certification
14 13 (0.99%) DV Cleared
15 11 (0.83%) AWS Certification
16 9 (0.68%) Cisco Certification
16 9 (0.68%) DBS Check
17 8 (0.61%) CCNP
Quality Assurance & Compliance
1 114 (8.64%) Def Stans
1 114 (8.64%) IEC 61508
2 101 (7.66%) ISO/IEC 15288
3 54 (4.09%) ISO/IEC 27001
4 49 (3.71%) Data Quality
5 44 (3.34%) QA
6 40 (3.03%) GDPR
7 35 (2.65%) Accessibility
8 18 (1.36%) NIST
8 18 (1.36%) SOC 2
9 14 (1.06%) Cyber Essentials
10 12 (0.91%) PMO
11 11 (0.83%) Cyber Essentials PLUS
12 9 (0.68%) WCAG
13 8 (0.61%) SLA
14 7 (0.53%) ISO/IEC 27002 (supersedes ISO/IEC 17799)
15 6 (0.45%) GRC
16 4 (0.30%) Dodd-Frank
16 4 (0.30%) IFRS
16 4 (0.30%) IFRS 9
System Software
1 15 (1.14%) Active Directory
2 9 (0.68%) VMware Infrastructure
3 7 (0.53%) Docker
4 5 (0.38%) Hyper-V
5 3 (0.23%) Virtual Machines
6 2 (0.15%) Virtual Desktop
6 2 (0.15%) VMware ESXi
6 2 (0.15%) VMware Workstation
Systems Management
1 21 (1.59%) Terraform
2 14 (1.06%) Grafana
3 13 (0.99%) Kubernetes
4 12 (0.91%) Prometheus
5 10 (0.76%) Ansible
6 4 (0.30%) FortiGate
6 4 (0.30%) Microsoft Intune
7 2 (0.15%) Computer Emergency Response Teams
7 2 (0.15%) Rancher
8 1 (0.076%) EMC NetWorker
8 1 (0.076%) Puppet
8 1 (0.076%) SCCM
8 1 (0.076%) SCOM
Vendors
1 153 (11.60%) Microsoft
2 127 (9.63%) IBM
3 65 (4.93%) Sparx
4 53 (4.02%) SAP
5 31 (2.35%) Salesforce
6 28 (2.12%) Oracle
7 27 (2.05%) Google
8 24 (1.82%) ServiceNow
9 23 (1.74%) YouTube
10 20 (1.52%) Adobe
11 17 (1.29%) Cisco
12 16 (1.21%) Databricks
13 15 (1.14%) Facebook
14 13 (0.99%) Dell
15 12 (0.91%) MuleSoft
15 12 (0.91%) OpenAI
15 12 (0.91%) VMware
16 7 (0.53%) Informatica
17 6 (0.45%) Intapp
17 6 (0.45%) Okta