Data Protection Act Jobs in England

Data Protection Act (DPA)
UK > England

The table below looks at the prevalence of the term Data Protection Act in permanent job vacancies in England. Included is a benchmarking guide to the salaries offered in vacancies that cited Data Protection Act over the 6 months leading up to 16 May 2025, comparing them to the same period in the previous two years.

6 months to
16 May 2025
Same period 2024 Same period 2023
Rank 498 610 468
Rank change year-on-year +112 -142 +96
Permanent jobs citing Data Protection Act 198 235 534
As % of all permanent jobs advertised in England 0.40% 0.27% 0.60%
As % of the Miscellaneous category 1.08% 0.79% 1.37%
Number of salaries quoted 119 172 256
10th Percentile £25,480 £27,750 £38,250
25th Percentile £42,417 £36,899 £45,938
Median annual salary (50th Percentile) £60,000 £50,000 £55,000
Median % change year-on-year +20.00% -9.09% -
75th Percentile £90,000 £70,608 £70,000
90th Percentile £111,850 £87,500 £95,625
UK median annual salary £60,000 £48,750 £55,000
% change year-on-year +23.08% -11.36% -

All Generic Skills
England

Data Protection Act falls under the General and Transferable Skills category. For comparison with the information above, the following table provides summary statistics for all permanent job vacancies requiring generic IT skills in England.

Permanent vacancies with a requirement for generic IT skills 18,282 29,848 39,029
As % of all permanent jobs advertised in England 37.16% 34.76% 43.99%
Number of salaries quoted 8,839 20,843 20,948
10th Percentile £31,250 £28,000 £35,500
25th Percentile £42,500 £38,000 £46,570
Median annual salary (50th Percentile) £60,000 £55,000 £65,000
Median % change year-on-year +9.09% -15.38% +4.00%
75th Percentile £80,000 £75,000 £87,500
90th Percentile £110,000 £100,000 £110,000
UK median annual salary £60,000 £55,000 £65,000
% change year-on-year +9.09% -15.38% +4.00%

Data Protection Act
Job Vacancy Trend in England

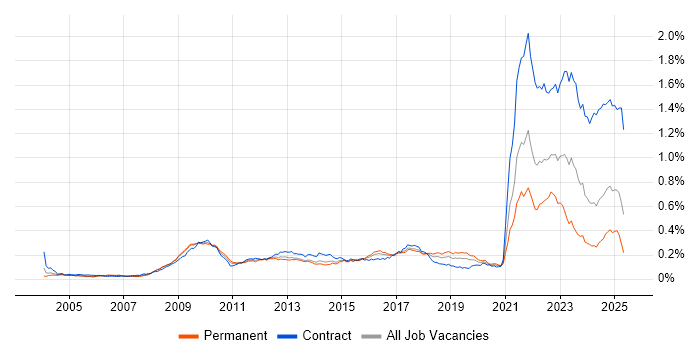
Job postings citing Data Protection Act as a proportion of all IT jobs advertised in England.

Job vacancy trend for Data Protection Act in England

Data Protection Act
Salary Trend in England

3-month moving average salary quoted in jobs citing Data Protection Act in England.

Salary trend for Data Protection Act in England

Data Protection Act
Salary Histogram in England

Salary distribution for jobs citing Data Protection Act in England over the 6 months to 16 May 2025.

Salary histogram for Data Protection Act in England

Data Protection Act
Job Locations in England

The table below looks at the demand and provides a guide to the median salaries quoted in IT jobs citing Data Protection Act within the England region over the 6 months to 16 May 2025. The 'Rank Change' column provides an indication of the change in demand within each location based on the same 6 month period last year.

Location Rank Change
on Same Period
Last Year
Matching
Permanent
IT Job Ads
Median Salary
Past 6 Months
Median Salary
% Change
on Same Period
Last Year
Live
Jobs
London +96 78 £85,000 +17.24% 19
North of England +55 48 £35,500 -29.00% 16
North West +26 41 £27,240 -19.88% 9
Midlands +63 34 £50,000 -13.04% 2
West Midlands +58 33 £50,000 -13.04% 1
South East +93 27 £80,384 +147.34% 20
Yorkshire +56 7 £60,000 +20.00% 7
East of England +43 4 £60,000 -14.29% 4
South West +83 3 £80,000 +77.78% 10
East Midlands +30 1 £28,500 -19.72% 1
Data Protection Act
UK

Data Protection Act
Co-occurring Skills and Capabilities in England by Category

The follow tables expand on the table above by listing co-occurrences grouped by category. The same employment type, locality and period is covered with up to 20 co-occurrences shown in each of the following categories:

Application Platforms
1 5 (2.53%) SharePoint
2 4 (2.02%) Microsoft Exchange
3 2 (1.01%) GemFire
4 1 (0.51%) Apache
4 1 (0.51%) Apache Spark
4 1 (0.51%) Jetty
4 1 (0.51%) OpenStack
4 1 (0.51%) Oracle Workflow
4 1 (0.51%) SAS
4 1 (0.51%) Tomcat
Applications
1 23 (11.62%) Microsoft Excel
2 15 (7.58%) Microsoft Office
3 9 (4.55%) Acrobat
4 1 (0.51%) Sketch
Business Applications
1 6 (3.03%) Oracle EBS
2 5 (2.53%) Dynamics CRM
3 4 (2.02%) Oracle Applications
4 1 (0.51%) Endur
4 1 (0.51%) ION Anvil
4 1 (0.51%) ION MarketView
4 1 (0.51%) Oracle Assets
4 1 (0.51%) Oracle EBS R12
4 1 (0.51%) Oracle Financials
4 1 (0.51%) Oracle General Ledger
4 1 (0.51%) Oracle Internet Expenses
4 1 (0.51%) Oracle iProcurement
4 1 (0.51%) Oracle Payables
4 1 (0.51%) Oracle Procure-to-Pay
4 1 (0.51%) Oracle Receivables
Cloud Services
1 43 (21.72%) Azure
2 42 (21.21%) Microsoft 365
3 19 (9.60%) AWS
4 10 (5.05%) Power Platform
5 9 (4.55%) GCP
5 9 (4.55%) Google Workspace
6 7 (3.54%) Azure AI
7 6 (3.03%) Azure AKS
7 6 (3.03%) SaaS
8 5 (2.53%) Azure DevOps
8 5 (2.53%) Dynamics 365
8 5 (2.53%) Entra ID
9 2 (1.01%) Amazon EKS
9 2 (1.01%) Azure Synapse Analytics
9 2 (1.01%) GitHub
9 2 (1.01%) Microsoft Copilot
9 2 (1.01%) OCI
10 1 (0.51%) ChatGPT
10 1 (0.51%) Cloud Computing
10 1 (0.51%) Copilot Studio
Communications & Networking
1 9 (4.55%) Intranet
2 3 (1.52%) Firewall
2 3 (1.52%) LAN
2 3 (1.52%) VLAN
2 3 (1.52%) VPN
2 3 (1.52%) WAN
2 3 (1.52%) Wi-Fi
3 2 (1.01%) Network Security
3 2 (1.01%) Remote Desktop
3 2 (1.01%) Unified Communications
4 1 (0.51%) Internet
4 1 (0.51%) OpenVPN
4 1 (0.51%) SSH
Database & Business Intelligence
1 10 (5.05%) Power BI
2 4 (2.02%) MongoDB
2 4 (2.02%) SQL Server
2 4 (2.02%) Tableau
3 3 (1.52%) Azure SQL Database
3 3 (1.52%) Oracle Database
3 3 (1.52%) Oracle Exadata
3 3 (1.52%) Oracle Reports
4 2 (1.01%) Data Lake
4 2 (1.01%) MySQL
4 2 (1.01%) PostgreSQL
5 1 (0.51%) Data Mining
5 1 (0.51%) Data Warehouse
5 1 (0.51%) DTS
5 1 (0.51%) Electronic Patient Records
5 1 (0.51%) Metadata
5 1 (0.51%) QlikView
5 1 (0.51%) Relational Database
5 1 (0.51%) SAS EBI
5 1 (0.51%) SQL Server Integration Services
Development Applications
1 9 (4.55%) JIRA
2 3 (1.52%) Git
3 2 (1.01%) Cypress.io
3 2 (1.01%) Jenkins
3 2 (1.01%) Postman
3 2 (1.01%) Sonatype Nexus
4 1 (0.51%) Android Studio
4 1 (0.51%) Artifactory
4 1 (0.51%) Bitbucket
4 1 (0.51%) Jaeger
4 1 (0.51%) JUnit
4 1 (0.51%) Oracle Forms
4 1 (0.51%) Selenium
4 1 (0.51%) TeamCity
General
1 85 (42.93%) Social Skills
2 39 (19.70%) Finance
3 29 (14.65%) Legal
4 26 (13.13%) Analytical Skills
5 24 (12.12%) Law
6 15 (7.58%) Retail
7 13 (6.57%) Front Office
8 8 (4.04%) Presentation Skills
9 7 (3.54%) Banking
9 7 (3.54%) Publishing
10 5 (2.53%) Inclusion and Diversity
10 5 (2.53%) Marketing
11 4 (2.02%) Back Office
11 4 (2.02%) Documentation Skills
11 4 (2.02%) Organisational Skills
12 2 (1.01%) Influencing Skills
12 2 (1.01%) Public Sector
12 2 (1.01%) Social Housing
13 1 (0.51%) Automotive
13 1 (0.51%) Police
Job Titles
1 35 (17.68%) Senior
2 24 (12.12%) Analyst
3 20 (10.10%) Administrator
3 20 (10.10%) Developer
4 19 (9.60%) Lead
5 16 (8.08%) IT Administrator
6 15 (7.58%) Information Manager
7 12 (6.06%) Architect
7 12 (6.06%) Governance Manager
7 12 (6.06%) Information Governance Manager
8 9 (4.55%) Applications Support
8 9 (4.55%) Compliance Advisor
8 9 (4.55%) Information Security Manager
8 9 (4.55%) Security Advisor
8 9 (4.55%) Security Manager
8 9 (4.55%) Senior Developer
8 9 (4.55%) Support Analyst
9 8 (4.04%) Consultant
9 8 (4.04%) Senior Analyst
10 7 (3.54%) Senior Manager
Libraries, Frameworks & Software Standards
1 13 (6.57%) Node.js
1 13 (6.57%) React
2 10 (5.05%) Middleware
3 8 (4.04%) .NET
3 8 (4.04%) Kafka
4 6 (3.03%) Oracle Fusion
5 4 (2.02%) Ruby on Rails
6 3 (1.52%) Elastic Stack
6 3 (1.52%) Oracle GoldenGate
7 2 (1.01%) RabbitMQ
7 2 (1.01%) Spring
7 2 (1.01%) Spring Boot
7 2 (1.01%) XML
8 1 (0.51%) AngularJS
8 1 (0.51%) JSON
8 1 (0.51%) Memcached
8 1 (0.51%) pytest
8 1 (0.51%) scikit-learn
8 1 (0.51%) TAPI
8 1 (0.51%) XSLT
Miscellaneous
1 26 (13.13%) Management Information System
2 20 (10.10%) Social Media
3 14 (7.07%) Freedom of Information
3 14 (7.07%) Freedom of Information Act
4 13 (6.57%) Product Ownership
5 11 (5.56%) Cyber Threat
6 9 (4.55%) e-Learning
7 8 (4.04%) Derivative
8 7 (3.54%) Data Centre
8 7 (3.54%) Self-Motivation
9 5 (2.53%) Cyberattack
9 5 (2.53%) Legacy Systems
10 3 (1.52%) Foreign Exchange (FX)
11 2 (1.01%) Analytical Mindset
11 2 (1.01%) Cloud Native
11 2 (1.01%) Learning Management System
11 2 (1.01%) Onboarding
11 2 (1.01%) Public Cloud
11 2 (1.01%) Renewable Energy
11 2 (1.01%) Video\Live Streaming
Operating Systems
1 26 (13.13%) Windows
2 14 (7.07%) Linux
3 8 (4.04%) Windows Server
4 6 (3.03%) Unix
4 6 (3.03%) Windows 10
5 5 (2.53%) Windows Vista
6 2 (1.01%) Android
7 1 (0.51%) Ubuntu
Processes & Methodologies
1 198 (100.00%) Data Protection
2 48 (24.24%) Information Security
3 43 (21.72%) Continuous Improvement
3 43 (21.72%) Problem-Solving
4 34 (17.17%) Agile
5 30 (15.15%) Cybersecurity
6 29 (14.65%) Stakeholder Management
7 28 (14.14%) Customer Service
8 23 (11.62%) Incident Management
9 20 (10.10%) Roadmaps
10 19 (9.60%) Line Management
10 19 (9.60%) Process Improvement
11 18 (9.09%) DevOps
11 18 (9.09%) Impact Assessments
12 16 (8.08%) Asset Management
12 16 (8.08%) Project Management
12 16 (8.08%) Risk Management
12 16 (8.08%) Scrum
13 15 (7.58%) Business Continuity
14 14 (7.07%) Migration
Programming Languages
1 43 (21.72%) SQL
2 21 (10.61%) Python
3 13 (6.57%) C#
4 11 (5.56%) Java
4 11 (5.56%) JavaScript
5 10 (5.05%) PowerShell
6 6 (3.03%) TypeScript
7 4 (2.02%) PL/SQL
7 4 (2.02%) Ruby
8 3 (1.52%) C++
9 2 (1.01%) Go
9 2 (1.01%) Scala
9 2 (1.01%) Shell Script
10 1 (0.51%) Bash
10 1 (0.51%) Groovy
10 1 (0.51%) Kotlin
10 1 (0.51%) SHACL
10 1 (0.51%) SPARQL
Qualifications
1 24 (12.12%) Degree
2 22 (11.11%) DBS Check
3 16 (8.08%) CISM
3 16 (8.08%) CISSP
4 9 (4.55%) CISA
5 7 (3.54%) CRISC
5 7 (3.54%) ISO 27001 Lead Implementer
6 4 (2.02%) Computer Science Degree
6 4 (2.02%) ISEB
6 4 (2.02%) PMI Certification
6 4 (2.02%) PMP
6 4 (2.02%) PRINCE2 Certification
7 3 (1.52%) Azure Certification
7 3 (1.52%) BPSS Clearance
7 3 (1.52%) CCNA
7 3 (1.52%) Cisco Certification
7 3 (1.52%) Microsoft Certification
7 3 (1.52%) SC Cleared
7 3 (1.52%) Security Cleared
8 2 (1.01%) SANS
Quality Assurance & Compliance
1 44 (22.22%) ISO/IEC 27001
2 41 (20.71%) Cyber Essentials
3 37 (18.69%) GDPR
4 16 (8.08%) Cyber Essentials PLUS
4 16 (8.08%) SLA
5 12 (6.06%) ISO/IEC 27002 (supersedes ISO/IEC 17799)
6 11 (5.56%) PCI DSS
7 9 (4.55%) PERC
8 7 (3.54%) Data Quality
8 7 (3.54%) HIPAA
9 5 (2.53%) NIST
10 4 (2.02%) QA
11 3 (1.52%) Accessibility
12 2 (1.01%) COBIT
12 2 (1.01%) NCSC
12 2 (1.01%) SOC 2
13 1 (0.51%) California Consumer Privacy Act
13 1 (0.51%) DICOM
13 1 (0.51%) HL7
13 1 (0.51%) WCAG
System Software
1 31 (15.66%) Active Directory
2 9 (4.55%) VMware Infrastructure
3 7 (3.54%) Docker
4 3 (1.52%) vSphere
5 1 (0.51%) Virtual Machines
Systems Management
1 13 (6.57%) Kubernetes
2 5 (2.53%) Terraform
3 4 (2.02%) Ansible
3 4 (2.02%) Prometheus
4 3 (1.52%) Grafana
4 3 (1.52%) Oracle RMAN
5 2 (1.01%) ITRS Geneos
5 2 (1.01%) Nagios
6 1 (0.51%) Argo
6 1 (0.51%) Control-M
6 1 (0.51%) Karpenter
6 1 (0.51%) Puppet
6 1 (0.51%) SCCM
Vendors
1 59 (29.80%) Microsoft
2 12 (6.06%) VMware
3 11 (5.56%) Google
3 11 (5.56%) Oracle
4 9 (4.55%) Adobe
4 9 (4.55%) OneTrust
5 8 (4.04%) Citrix
6 7 (3.54%) Cisco
7 4 (2.02%) Splunk
8 2 (1.01%) Salesforce
8 2 (1.01%) SolarWinds
8 2 (1.01%) TIBCO
9 1 (0.51%) Apple
9 1 (0.51%) Avaya
9 1 (0.51%) Bloomberg
9 1 (0.51%) Brocade
9 1 (0.51%) ION Trading
9 1 (0.51%) OpenLink
9 1 (0.51%) Reuters
9 1 (0.51%) Trayport