Inclusion and Diversity Jobs in the Midlands

Inclusion and Diversity
England > Midlands

The table below looks at the prevalence of the term Inclusion and Diversity in permanent job vacancies in the Midlands. Included is a benchmarking guide to the salaries offered in vacancies that cited Inclusion and Diversity over the 6 months leading up to 21 May 2025, comparing them to the same period in the previous two years.

6 months to
21 May 2025
Same period 2024 Same period 2023
Rank 35 45 73
Rank change year-on-year +10 +28 +34
Permanent jobs citing Inclusion and Diversity 418 514 390
As % of all permanent jobs advertised in the Midlands 5.92% 4.25% 4.30%
As % of the General category 9.84% 7.56% 5.84%
Number of salaries quoted 125 245 55
10th Percentile £26,500 £24,000 £32,150
25th Percentile £37,500 £30,500 £34,452
Median annual salary (50th Percentile) £50,000 £42,500 £53,000
Median % change year-on-year +17.65% -19.81% +6.00%
75th Percentile £62,500 £62,200 £65,000
90th Percentile £80,000 £69,800 £71,500
England median annual salary £55,000 £51,000 £70,000
% change year-on-year +7.84% -27.14% +19.67%

All General Skills
Midlands

Inclusion and Diversity falls under the General Skills category. For comparison with the information above, the following table provides summary statistics for all permanent job vacancies requiring common skills in the Midlands.

Permanent vacancies with a requirement for common skills 4,248 6,801 6,673
As % of all permanent jobs advertised in the Midlands 60.17% 56.24% 73.60%
Number of salaries quoted 1,815 4,718 3,035
10th Percentile £26,250 £25,500 £28,000
25th Percentile £32,500 £31,250 £37,000
Median annual salary (50th Percentile) £47,500 £45,000 £52,500
Median % change year-on-year +5.56% -14.29% +10.53%
75th Percentile £62,500 £60,000 £66,250
90th Percentile £75,000 £72,500 £77,500
England median annual salary £56,500 £52,500 £60,000
% change year-on-year +7.62% -12.50% -

Inclusion and Diversity
Job Vacancy Trend in the Midlands

Job postings citing Inclusion and Diversity as a proportion of all IT jobs advertised in the Midlands.
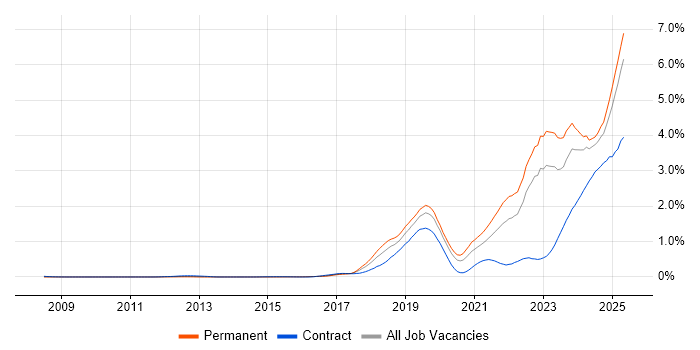
Job vacancy trend for Inclusion and Diversity in the Midlands

Inclusion and Diversity
Salary Trend in the Midlands

3-month moving average salary quoted in jobs citing Inclusion and Diversity in the Midlands.

Salary trend for Inclusion and Diversity in the Midlands

Inclusion and Diversity
Salary Histogram in the Midlands

Salary distribution for jobs citing Inclusion and Diversity in the Midlands over the 6 months to 21 May 2025.

Salary histogram for Inclusion and Diversity in the Midlands

Inclusion and Diversity
Job Locations in the Midlands

The table below looks at the demand and provides a guide to the median salaries quoted in IT jobs citing Inclusion and Diversity within the Midlands region over the 6 months to 21 May 2025. The 'Rank Change' column provides an indication of the change in demand within each location based on the same 6 month period last year.

Location Rank Change
on Same Period
Last Year
Matching
Permanent
IT Job Ads
Median Salary
Past 6 Months
Median Salary
% Change
on Same Period
Last Year
Live
Jobs
East Midlands +19 218 £32,500 -5.19% 116
West Midlands -3 200 £55,000 +15.91% 264
Inclusion and Diversity
England

Inclusion and Diversity
Co-occurring Skills and Capabilities in the Midlands by Category

The follow tables expand on the table above by listing co-occurrences grouped by category. The same employment type, locality and period is covered with up to 20 co-occurrences shown in each of the following categories:

Application Platforms
1 48 (11.48%) Confluence
2 9 (2.15%) Skype for Business
3 7 (1.67%) Microsoft Exchange
4 6 (1.44%) SharePoint
5 2 (0.48%) IBM Notes
5 2 (0.48%) IIS
5 2 (0.48%) Jupyter
6 1 (0.24%) Mendix
Applications
1 37 (8.85%) Microsoft Office
2 11 (2.63%) Microsoft Excel
3 5 (1.20%) Microsoft PowerPoint
4 2 (0.48%) MS Visio
5 1 (0.24%) Adobe After Effects
5 1 (0.24%) Adobe Premiere
5 1 (0.24%) Revit
Business Applications
1 22 (5.26%) Oracle EBS
2 12 (2.87%) Oracle Applications
3 4 (0.96%) Oracle ERP
3 4 (0.96%) PeopleSoft HCM
3 4 (0.96%) SAP HCM
4 2 (0.48%) Sparx Enterprise Architect
5 1 (0.24%) Dynamics AX
5 1 (0.24%) Remedy ITSM
5 1 (0.24%) Shopify
Cloud Services
1 110 (26.32%) Azure
2 93 (22.25%) AWS
3 48 (11.48%) GCP
4 14 (3.35%) Microsoft 365
5 9 (2.15%) Power Platform
6 7 (1.67%) Azure DevOps
7 6 (1.44%) Azure Data Factory
8 5 (1.20%) Azure Service Bus
8 5 (1.20%) Entra ID
8 5 (1.20%) Microsoft Purview
8 5 (1.20%) Pulumi
9 4 (0.96%) Amazon EC2
9 4 (0.96%) Azure Sentinel
9 4 (0.96%) Boomi
9 4 (0.96%) Dynamics 365
9 4 (0.96%) OCI
9 4 (0.96%) Route 53
10 3 (0.72%) IBM Cloud
10 3 (0.72%) Power Automate
10 3 (0.72%) PowerApps
Communications & Networking
1 30 (7.18%) VPN
2 16 (3.83%) TCP/IP
3 12 (2.87%) Firewall
4 10 (2.39%) Skype
4 10 (2.39%) WAN
5 9 (2.15%) Unified Communications
5 9 (2.15%) Wireless
6 8 (1.91%) Cisco IOS
7 6 (1.44%) LAN
8 4 (0.96%) Broadband
8 4 (0.96%) HTTP
8 4 (0.96%) HTTPS
8 4 (0.96%) Network Security
8 4 (0.96%) SD-WAN
8 4 (0.96%) VLAN
9 3 (0.72%) DNS
9 3 (0.72%) VoIP
9 3 (0.72%) Wi-Fi
10 2 (0.48%) DHCP
10 2 (0.48%) IPsec
Database & Business Intelligence
1 78 (18.66%) SQL Server
2 10 (2.39%) Data Warehouse
3 8 (1.91%) Oracle Database
3 8 (1.91%) Power BI
4 7 (1.67%) Metadata
5 5 (1.20%) NoSQL
6 4 (0.96%) Big Data
6 4 (0.96%) Data Hub
6 4 (0.96%) Metadata Repository
6 4 (0.96%) Oracle Exadata
6 4 (0.96%) RDBMS
6 4 (0.96%) Relational Database
7 3 (0.72%) Azure SQL Data Warehouse
7 3 (0.72%) Elasticsearch
8 2 (0.48%) Amazon Redshift
8 2 (0.48%) GIS
8 2 (0.48%) SQL Server Integration Services
8 2 (0.48%) Tableau
9 1 (0.24%) PostgreSQL
9 1 (0.24%) Redis
Development Applications
1 78 (18.66%) Cucumber
2 70 (16.75%) JIRA
3 63 (15.07%) Bitbucket
3 63 (15.07%) GitLab
3 63 (15.07%) Maven
3 63 (15.07%) Selenium
3 63 (15.07%) SonarQube
3 63 (15.07%) Sonatype Nexus
4 15 (3.59%) Robot Framework
5 6 (1.44%) Git
6 4 (0.96%) Jaeger
6 4 (0.96%) JUnit
6 4 (0.96%) NUnit
7 2 (0.48%) ERwin
7 2 (0.48%) Mocha
7 2 (0.48%) SQL Server Management Studio (SSMS)
8 1 (0.24%) Visual Studio
General
1 126 (30.14%) Finance
2 73 (17.46%) Social Skills
3 64 (15.31%) Banking
4 60 (14.35%) Manufacturing
5 39 (9.33%) Analytical Skills
6 36 (8.61%) Public Sector
7 31 (7.42%) Law
8 27 (6.46%) Retail
9 24 (5.74%) Legal
10 17 (4.07%) Telecoms
11 16 (3.83%) Corporate Banking
11 16 (3.83%) Electronics
11 16 (3.83%) Investment Banking
12 10 (2.39%) Organisational Skills
13 7 (1.67%) Marketing
13 7 (1.67%) Presentation Skills
14 3 (0.72%) Billing
14 3 (0.72%) Influencing Skills
15 2 (0.48%) Military
16 1 (0.24%) Aerospace
Job Titles
1 65 (15.55%) Software Engineer
2 47 (11.24%) Senior
3 41 (9.81%) Test Engineer
4 35 (8.37%) Electrical Engineer
5 28 (6.70%) Project Manager
6 26 (6.22%) Analyst
6 26 (6.22%) Lead
6 26 (6.22%) Safety Engineer
7 24 (5.74%) Consultant
8 19 (4.55%) Support Engineer
9 17 (4.07%) Oracle Consultant
10 15 (3.59%) Infrastructure Engineer
10 15 (3.59%) Integration Consultant
10 15 (3.59%) Oracle Technical Consultant
10 15 (3.59%) Technical Consultant
10 15 (3.59%) Test Automation Engineer
11 14 (3.35%) Developer
12 13 (3.11%) 2nd Line Support
12 13 (3.11%) Design Engineer
12 13 (3.11%) Electronics Engineer
Libraries, Frameworks & Software Standards
1 70 (16.75%) React
2 65 (15.55%) Kafka
3 64 (15.31%) CSS
3 64 (15.31%) HTML
3 64 (15.31%) Spring
3 64 (15.31%) Spring Boot
4 63 (15.07%) JPA
4 63 (15.07%) Redux
5 47 (11.24%) Hibernate
6 23 (5.50%) REST
7 22 (5.26%) Jest
8 18 (4.31%) Middleware
8 18 (4.31%) Oracle Fusion
9 17 (4.07%) RESTful
10 16 (3.83%) CSS3
10 16 (3.83%) HTML5
10 16 (3.83%) Sass
11 12 (2.87%) Elastic Stack
12 10 (2.39%) EDI
13 9 (2.15%) .NET
Miscellaneous
1 67 (16.03%) Enterprise Software
2 63 (15.07%) Product Ownership
3 34 (8.13%) Cyberattack
4 17 (4.07%) Hybrid Cloud
4 17 (4.07%) Linux Command Line
5 16 (3.83%) Management Information System
6 15 (3.59%) e-Learning
7 10 (2.39%) Driving Licence
7 10 (2.39%) Video Conferencing
8 9 (2.15%) Data Centre
8 9 (2.15%) Digital Signage
9 5 (1.20%) Algorithms
10 3 (0.72%) Mobile App
10 3 (0.72%) Renewable Energy
10 3 (0.72%) SCADA
10 3 (0.72%) Self-Motivation
11 2 (0.48%) CCTV
11 2 (0.48%) IoT
11 2 (0.48%) NB-IoT
12 1 (0.24%) Public Cloud
Operating Systems
1 56 (13.40%) Windows
2 39 (9.33%) Linux
3 17 (4.07%) Windows Server
4 14 (3.35%) Android
5 9 (2.15%) Unix
6 3 (0.72%) Apple iOS
7 2 (0.48%) Oracle Linux
7 2 (0.48%) Windows 10
Processes & Methodologies
1 110 (26.32%) DevOps
2 92 (22.01%) Agile
2 92 (22.01%) Mentoring
3 86 (20.57%) Continuous Improvement
4 79 (18.90%) Test Automation
5 74 (17.70%) CI/CD
5 74 (17.70%) SDLC
6 71 (16.99%) Microservices
7 70 (16.75%) Containerisation
7 70 (16.75%) Problem-Solving
7 70 (16.75%) Software Engineering
8 67 (16.03%) Performance Optimisation
9 66 (15.79%) Front End Development
10 64 (15.31%) Full-Stack Development
11 52 (12.44%) Clean Code
12 51 (12.20%) Coaching
13 48 (11.48%) TDD
14 38 (9.09%) ITIL
15 35 (8.37%) Line Management
16 32 (7.66%) Stakeholder Management
Programming Languages
1 96 (22.97%) SQL
2 91 (21.77%) JavaScript
3 75 (17.94%) Java
4 37 (8.85%) Python
5 30 (7.18%) PowerShell
6 29 (6.94%) Bash
7 16 (3.83%) TypeScript
8 7 (1.67%) Go
9 6 (1.44%) C#
10 4 (0.96%) PL/SQL
10 4 (0.96%) Shell Script
11 3 (0.72%) C++
11 3 (0.72%) T-SQL
12 2 (0.48%) PHP
12 2 (0.48%) Rust
13 1 (0.24%) R
Qualifications
1 116 (27.75%) Degree
2 32 (7.66%) HND
3 22 (5.26%) Security Cleared
4 11 (2.63%) HNC
5 9 (2.15%) CCNA
5 9 (2.15%) Cisco Certification
5 9 (2.15%) DV Cleared
5 9 (2.15%) SC Cleared
6 8 (1.91%) AWS Certification
6 8 (1.91%) Microsoft Certification
7 6 (1.44%) CompTIA Security+
7 6 (1.44%) DBS Check
7 6 (1.44%) Oracle Certification
8 5 (1.20%) CITP
8 5 (1.20%) ITIL Certification
9 4 (0.96%) Azure Certification
9 4 (0.96%) MRICS
9 4 (0.96%) OCA
9 4 (0.96%) OCP
10 3 (0.72%) Computer Science Degree
Quality Assurance & Compliance
1 99 (23.68%) QA
2 22 (5.26%) Accessibility
3 19 (4.55%) NCSC
4 9 (2.15%) SLA
5 5 (1.20%) Data Quality
6 4 (0.96%) COBIT
7 3 (0.72%) GDPR
7 3 (0.72%) ISO/IEC 27001
7 3 (0.72%) NIST
8 2 (0.48%) PMBOK
9 1 (0.24%) Cyber Essentials
9 1 (0.24%) Cyber Essentials PLUS
9 1 (0.24%) GRC
9 1 (0.24%) NEBOSH
System Software
1 82 (19.62%) Docker
2 24 (5.74%) Active Directory
3 12 (2.87%) vSphere
4 11 (2.63%) VMware Infrastructure
5 10 (2.39%) Hyper-V
6 8 (1.91%) VMware NSX
7 4 (0.96%) Virtual Machines
8 2 (0.48%) Terminal Services
9 1 (0.24%) Virtual Desktop
Systems Management
1 72 (17.22%) Kubernetes
2 19 (4.55%) Ansible
2 19 (4.55%) Terraform
3 9 (2.15%) Microsoft Intune
4 4 (0.96%) Argo
4 4 (0.96%) Kustomize
4 4 (0.96%) Oracle RMAN
4 4 (0.96%) Prometheus
5 3 (0.72%) AirWatch
6 2 (0.48%) Cisco CUCM
6 2 (0.48%) Puppet
6 2 (0.48%) Single Sign-On
7 1 (0.24%) AWS Copilot
7 1 (0.24%) Marathon
7 1 (0.24%) SCCM
Vendors
1 90 (21.53%) Microsoft
2 63 (15.07%) Solace
3 41 (9.81%) Oracle
4 29 (6.94%) Cisco
5 26 (6.22%) ServiceNow
6 19 (4.55%) IBM
7 15 (3.59%) Red Hat
8 14 (3.35%) Juniper
9 13 (3.11%) Dell
9 13 (3.11%) EMC
10 12 (2.87%) VMware
11 11 (2.63%) SAP
12 9 (2.15%) Mitel
12 9 (2.15%) Polycom
12 9 (2.15%) ShoreTel
12 9 (2.15%) YouTube
13 8 (1.91%) 3PAR
13 8 (1.91%) Splunk
14 7 (1.67%) Informatica
14 7 (1.67%) Salesforce