Project Management Jobs in the Midlands

Project Management
England > Midlands

The following table provides summary statistics for permanent job vacancies advertised in the Midlands with a requirement for Project Management skills. Included is a benchmarking guide to the salaries offered in vacancies that have cited Project Management over the 6 months to 25 April 2024 with a comparison to the same period in the previous 2 years.

6 months to
25 Apr 2024
Same period 2023 Same period 2022
Rank 13 17 21
Rank change year-on-year +4 +4 +16
Permanent jobs citing Project Management 1,124 1,126 1,031
As % of all permanent jobs advertised in the Midlands 9.65% 11.67% 9.50%
As % of the Processes & Methodologies category 11.70% 12.08% 10.07%
Number of salaries quoted 829 498 693
10th Percentile £32,000 £37,500 £35,200
25th Percentile £41,250 £45,000 £42,500
Median annual salary (50th Percentile) £51,997 £55,000 £52,500
Median % change year-on-year -5.46% +4.76% +10.53%
75th Percentile £61,500 £65,000 £61,250
90th Percentile £76,050 £73,750 £73,750
England median annual salary £52,500 £57,500 £57,500
% change year-on-year -8.70% - +4.55%

All Process and Methodology Skills
Midlands

Project Management is in the Processes and Methodologies category. The following table is for comparison with the above and provides summary statistics for all permanent job vacancies advertised in the Midlands with a requirement for process or methodology skills.

Permanent vacancies with a requirement for process or methodology skills 9,604 9,322 10,241
As % of all permanent jobs advertised in the Midlands 82.48% 96.59% 94.33%
Number of salaries quoted 7,117 4,647 6,965
10th Percentile £26,250 £30,000 £28,750
25th Percentile £34,571 £38,276 £37,500
Median annual salary (50th Percentile) £47,500 £52,500 £50,000
Median % change year-on-year -9.52% +5.00% +8.70%
75th Percentile £61,500 £67,500 £63,750
90th Percentile £75,000 £77,500 £77,500
England median annual salary £55,000 £62,500 £60,000
% change year-on-year -12.00% +4.17% +9.09%

Project Management
Job Vacancy Trend in the Midlands

Job postings citing Project Management as a proportion of all IT jobs advertised in the Midlands.
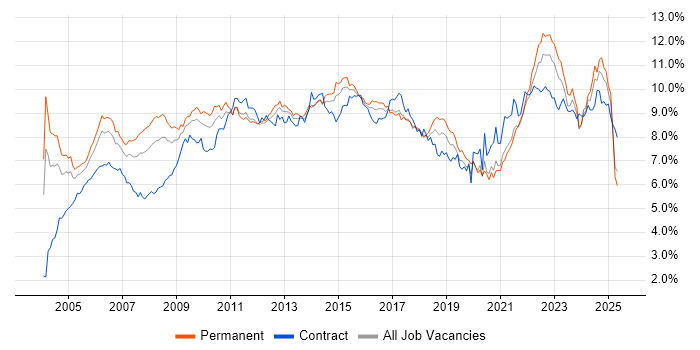
Job vacancy trend for Project Management in the Midlands

Project Management
Salary Trend in the Midlands

3-month moving average salary quoted in jobs citing Project Management in the Midlands.

Salary trend for Project Management in the Midlands

Project Management
Salary Histogram in the Midlands

Salary distribution for jobs citing Project Management in the Midlands over the 6 months to 25 April 2024.

Salary histogram for Project Management in the Midlands

Project Management
Job Locations in the Midlands

The table below looks at the demand and provides a guide to the median salaries quoted in IT jobs citing Project Management within the Midlands region over the 6 months to 25 April 2024. The 'Rank Change' column provides an indication of the change in demand within each location based on the same 6 month period last year.

Location Rank Change
on Same Period
Last Year
Matching
Permanent
IT Job Ads
Median Salary
Past 6 Months
Median Salary
% Change
on Same Period
Last Year
Live
Jobs
West Midlands +1 628 £54,000 -1.82% 241
East Midlands +4 458 £47,500 -13.64% 148
Project Management
England

Project Management
Co-occurring Skills and Capabilities in the Midlands by Category

The follow tables expand on the table above by listing co-occurrences grouped by category. The same employment type, locality and period is covered with up to 20 co-occurrences shown in each of the following categories:

Application Platforms
1 49 (4.36%) SharePoint
2 21 (1.87%) Microsoft Exchange
3 20 (1.78%) Confluence
4 10 (0.89%) WordPress
5 8 (0.71%) CMS
6 5 (0.44%) Apache
7 4 (0.36%) Office Communications Server
7 4 (0.36%) WebLogic
8 2 (0.18%) Alfresco
8 2 (0.18%) Captiva
8 2 (0.18%) Documentum
9 1 (0.089%) Adobe Experience Manager
9 1 (0.089%) IIS
9 1 (0.089%) Mendix
9 1 (0.089%) TYPO3
Applications
1 70 (6.23%) Microsoft Excel
2 60 (5.34%) Microsoft Project
3 58 (5.16%) Microsoft Office
4 27 (2.40%) Microsoft PowerPoint
5 19 (1.69%) AutoCAD
6 11 (0.98%) MS Visio
7 10 (0.89%) Spreadsheet
8 9 (0.80%) Trello
9 5 (0.44%) Adobe Creative Suite
9 5 (0.44%) Adobe Illustrator
10 4 (0.36%) InDesign
10 4 (0.36%) Simulink
11 3 (0.27%) Adobe XD
11 3 (0.27%) Sketch
12 2 (0.18%) 3ds Max
12 2 (0.18%) Adobe Captivate
12 2 (0.18%) Chatbot
13 1 (0.089%) Photoshop
Business Applications
1 10 (0.89%) Dynamics CRM
2 9 (0.80%) SAP S/4HANA
3 5 (0.44%) NEC Housing
3 5 (0.44%) Shopify
4 4 (0.36%) Sage 200
4 4 (0.36%) Sparx Enterprise Architect
5 3 (0.27%) Dynamics NAV
5 3 (0.27%) ProductWriter
5 3 (0.27%) Sage 300 ERP
5 3 (0.27%) SAP ERP
6 2 (0.18%) Oracle EBS
6 2 (0.18%) Primavera
6 2 (0.18%) SAP BPC
6 2 (0.18%) SAP FSCM
6 2 (0.18%) SAP MDG
7 1 (0.089%) CA PPM
7 1 (0.089%) Odoo
7 1 (0.089%) Oracle Payables
7 1 (0.089%) SAP Business ByDesign
7 1 (0.089%) SAP Oil and Gas
Cloud Services
1 123 (10.94%) Azure
2 72 (6.41%) Microsoft 365
3 64 (5.69%) Power Platform
4 57 (5.07%) AWS
5 44 (3.91%) SaaS
6 39 (3.47%) Azure DevOps
7 26 (2.31%) Dynamics 365
8 23 (2.05%) GCP
9 18 (1.60%) Power Automate
10 17 (1.51%) PowerApps
11 13 (1.16%) Smartsheet
12 10 (0.89%) Amazon S3
12 10 (0.89%) Entra ID
12 10 (0.89%) GitHub
12 10 (0.89%) IaaS
12 10 (0.89%) PaaS
13 9 (0.80%) Google Drive
14 8 (0.71%) GitHub Actions
15 7 (0.62%) Google Workspace
15 7 (0.62%) Mavenlink
Communications & Networking
1 26 (2.31%) Firewall
2 17 (1.51%) WAN
3 16 (1.42%) DNS
3 16 (1.42%) Intranet
4 12 (1.07%) Internet
4 12 (1.07%) LAN
5 10 (0.89%) DHCP
6 9 (0.80%) SNMP
7 8 (0.71%) SAN
7 8 (0.71%) VPN
8 7 (0.62%) NAS
8 7 (0.62%) TCP/IP
9 6 (0.53%) SD-WAN
9 6 (0.53%) Wi-Fi
10 5 (0.44%) Extranet
10 5 (0.44%) IPsec
10 5 (0.44%) SMS
11 4 (0.36%) BGP
11 4 (0.36%) Broadband
11 4 (0.36%) SSL
Database & Business Intelligence
1 58 (5.16%) Power BI
2 25 (2.22%) SQL Server
3 22 (1.96%) MySQL
4 15 (1.33%) Data Warehouse
5 12 (1.07%) Relational Database
6 11 (0.98%) Data Lake
7 9 (0.80%) SQL Server Reporting Services
8 8 (0.71%) Amazon RDS
8 8 (0.71%) BigQuery
8 8 (0.71%) Looker
8 8 (0.71%) RDBMS
9 6 (0.53%) Crystal Reports
9 6 (0.53%) Data Mining
9 6 (0.53%) PostgreSQL
10 5 (0.44%) Elasticsearch
10 5 (0.44%) Metadata
10 5 (0.44%) MongoDB
10 5 (0.44%) Tableau
11 4 (0.36%) Geospatial Data
11 4 (0.36%) Spatial Data
Development Applications
1 48 (4.27%) JIRA
2 20 (1.78%) Git
3 8 (0.71%) SonarQube
4 6 (0.53%) Visual Studio
5 5 (0.44%) gulp
5 5 (0.44%) Postman
6 3 (0.27%) GitLab
7 2 (0.18%) Android Studio
7 2 (0.18%) Axure RP
7 2 (0.18%) LSMW
8 1 (0.089%) Bitbucket
8 1 (0.089%) Visual Studio Team System
General
1 480 (42.70%) Social Skills
2 370 (32.92%) Finance
3 161 (14.32%) Analytical Skills
4 109 (9.70%) Retail
5 108 (9.61%) Manufacturing
6 82 (7.30%) Marketing
7 79 (7.03%) Organisational Skills
8 57 (5.07%) Influencing Skills
9 56 (4.98%) Inclusion and Diversity
10 55 (4.89%) Presentation Skills
11 49 (4.36%) Legal
11 49 (4.36%) Telecoms
12 35 (3.11%) Automotive
12 35 (3.11%) Law
13 33 (2.94%) Public Sector
14 22 (1.96%) Local Government
15 19 (1.69%) Billing
16 18 (1.60%) Documentation Skills
17 17 (1.51%) Games
18 16 (1.42%) Health Technology
Job Titles
1 460 (40.93%) Project Manager
2 123 (10.94%) Senior
3 115 (10.23%) IT Manager
4 82 (7.30%) Lead
5 69 (6.14%) IT Project Manager
6 68 (6.05%) Senior Manager
7 52 (4.63%) Consultant
8 49 (4.36%) Senior Project Manager
9 42 (3.74%) Analyst
10 35 (3.11%) Coordinator
11 32 (2.85%) Business Manager
11 32 (2.85%) Developer
12 31 (2.76%) Delivery Manager
13 30 (2.67%) Technical Manager
14 26 (2.31%) Architect
15 25 (2.22%) Technical Project Manager
16 23 (2.05%) Business Analyst
16 23 (2.05%) Infrastructure Manager
17 20 (1.78%) Business Change Manager
18 19 (1.69%) Head of IT
Libraries, Frameworks & Software Standards
1 21 (1.87%) HTML
2 20 (1.78%) CSS
3 17 (1.51%) .NET
4 11 (0.98%) RESTful
5 10 (0.89%) Laravel
6 9 (0.80%) JSON
6 9 (0.80%) RabbitMQ
6 9 (0.80%) SOAP
7 8 (0.71%) ARM Templates
7 8 (0.71%) Azure Blueprints
7 8 (0.71%) Spring Boot
8 6 (0.53%) HTML5
8 6 (0.53%) jQuery
8 6 (0.53%) XML
9 5 (0.44%) CSS3
9 5 (0.44%) Node.js
9 5 (0.44%) Sass
9 5 (0.44%) Twig
9 5 (0.44%) Web Services
9 5 (0.44%) YAML
Miscellaneous
1 118 (10.50%) Management Information System
2 82 (7.30%) Self-Motivation
3 49 (4.36%) Product Ownership
4 42 (3.74%) Driving Licence
5 41 (3.65%) Data Centre
6 35 (3.11%) Onboarding
6 35 (3.11%) PMI
7 22 (1.96%) NHS
8 21 (1.87%) Enterprise Software
8 21 (1.87%) FMCG
9 15 (1.33%) CCTV
9 15 (1.33%) Virtual Team
10 14 (1.25%) Public Cloud
11 13 (1.16%) PKI
11 13 (1.16%) SCADA
12 12 (1.07%) Analytical Mindset
12 12 (1.07%) Digital Media
13 11 (0.98%) Renewable Energy
14 10 (0.89%) Data Structures
15 9 (0.80%) Algorithms
Operating Systems
1 57 (5.07%) Windows
2 25 (2.22%) Linux
3 19 (1.69%) Windows Server
4 15 (1.33%) Windows 10
5 7 (0.62%) Android
6 6 (0.53%) VMS
7 5 (0.44%) Apple iOS
7 5 (0.44%) Data ONTAP
7 5 (0.44%) Red Hat Enterprise Linux
8 3 (0.27%) Mac OS
8 3 (0.27%) Windows Server 2019
9 2 (0.18%) Windows Server 2016
10 1 (0.089%) CentOS
10 1 (0.089%) Debian
10 1 (0.089%) Scientific Linux
10 1 (0.089%) Ubuntu
10 1 (0.089%) Unix
Processes & Methodologies
1 312 (27.76%) Agile
2 251 (22.33%) Project Delivery
3 224 (19.93%) Problem-Solving
4 175 (15.57%) Continuous Improvement
4 175 (15.57%) PRINCE2
5 152 (13.52%) Stakeholder Management
6 149 (13.26%) Change Management
7 148 (13.17%) Risk Management
8 101 (8.99%) Mentoring
9 96 (8.54%) Waterfall
10 90 (8.01%) Business Case
11 89 (7.92%) Decision-Making
12 84 (7.47%) Roadmaps
13 81 (7.21%) ERP
14 75 (6.67%) Customer Service
15 70 (6.23%) Cybersecurity
15 70 (6.23%) Scrum
16 68 (6.05%) Collaborative Working
17 67 (5.96%) DevOps
18 62 (5.52%) Business Intelligence
Programming Languages
1 51 (4.54%) SQL
2 37 (3.29%) JavaScript
3 19 (1.69%) Python
4 17 (1.51%) PHP
5 14 (1.25%) C#
6 12 (1.07%) C
7 11 (0.98%) PowerShell
8 7 (0.62%) Java
8 7 (0.62%) TypeScript
8 7 (0.62%) VB
9 5 (0.44%) MATLAB
10 4 (0.36%) Ladder Logic
10 4 (0.36%) VBA
11 3 (0.27%) Bash
11 3 (0.27%) T-SQL
12 2 (0.18%) C++
12 2 (0.18%) Data Analysis Expressions
12 2 (0.18%) Embedded C
13 1 (0.089%) Apex Code
13 1 (0.089%) SOQL
Qualifications
1 240 (21.35%) Degree
2 80 (7.12%) Security Cleared
3 66 (5.87%) PMI Certification
4 48 (4.27%) PMP
5 40 (3.56%) SC Cleared
6 37 (3.29%) PRINCE2 Practitioner
7 31 (2.76%) PRINCE2 Certification
8 19 (1.69%) APMP
9 16 (1.42%) DBS Check
9 16 (1.42%) HND
10 15 (1.33%) Microsoft Certification
11 13 (1.16%) BPSS Clearance
11 13 (1.16%) Computer Science Degree
12 12 (1.07%) Master's Degree
13 10 (0.89%) APMG
13 10 (0.89%) CAPM
13 10 (0.89%) Cisco Certification
14 9 (0.80%) CCNA
15 8 (0.71%) Azure Certification
15 8 (0.71%) MCSE
Quality Assurance & Compliance
1 87 (7.74%) PMO
2 53 (4.72%) QA
3 40 (3.56%) GDPR
4 31 (2.76%) ISO/IEC 27001
5 20 (1.78%) Accessibility
6 10 (0.89%) Data Quality
7 8 (0.71%) NCSC
8 7 (0.62%) ISO 9001
9 4 (0.36%) Cyber Essentials
9 4 (0.36%) HMG Security Policy Framework
9 4 (0.36%) ISO 26262
9 4 (0.36%) SLA
10 3 (0.27%) GMP
10 3 (0.27%) Sarbanes-Oxley
11 2 (0.18%) IFRS
11 2 (0.18%) ISO 22301
11 2 (0.18%) MISRA
11 2 (0.18%) NIST
11 2 (0.18%) PCI DSS
11 2 (0.18%) SOX 404
System Software
1 23 (2.05%) Active Directory
1 23 (2.05%) VMware Infrastructure
2 14 (1.25%) Docker
2 14 (1.25%) Hyper-V
3 4 (0.36%) pfSense
4 2 (0.18%) Virtual Desktop
4 2 (0.18%) Virtual Servers
4 2 (0.18%) vSphere
Systems Management
1 14 (1.25%) Terraform
2 13 (1.16%) Ansible
2 13 (1.16%) Kubernetes
3 7 (0.62%) Microsoft Intune
4 5 (0.44%) Prometheus
4 5 (0.44%) vCenter Server
5 4 (0.36%) SCOM
5 4 (0.36%) WSUS
6 2 (0.18%) Active Directory Federation Services
6 2 (0.18%) FortiGate
6 2 (0.18%) Functional Safety
7 1 (0.089%) Backup Exec
7 1 (0.089%) HP ALM
Vendors
1 166 (14.77%) Microsoft
2 37 (3.29%) Google
3 34 (3.02%) SAP
4 31 (2.76%) VMware
5 25 (2.22%) IFS
6 17 (1.51%) Workday
7 16 (1.42%) Cisco
7 16 (1.42%) Salesforce
8 15 (1.33%) Adobe
9 13 (1.16%) Oracle
10 11 (0.98%) ServiceNow
11 9 (0.80%) CheckPoint
11 9 (0.80%) Xero
12 7 (0.62%) Citrix
12 7 (0.62%) Fortinet
12 7 (0.62%) Minitab
12 7 (0.62%) NEC
12 7 (0.62%) Siemens
13 6 (0.53%) Dell
13 6 (0.53%) Northgate