Confluence Jobs in England

Confluence
UK > England

The table below provides summary statistics for permanent job vacancies advertised in England requiring Confluence skills. It includes a benchmarking guide to the annual salaries offered in vacancies that cited Confluence over the 6 months leading up to 12 June 2025, comparing them to the same period in the previous two years.

6 months to
12 Jun 2025
Same period 2024 Same period 2023
Rank 237 327 255
Rank change year-on-year +90 -72 -38
Permanent jobs citing Confluence 719 769 1,217
As % of all permanent jobs advertised in England 1.47% 0.81% 1.48%
As % of the Application Platforms category 17.83% 8.55% 12.97%
Number of salaries quoted 326 559 782
10th Percentile £26,500 £28,619 £45,000
25th Percentile £41,438 £43,750 £52,500
Median annual salary (50th Percentile) £60,000 £57,500 £65,000
Median % change year-on-year +4.35% -11.54% +1.01%
75th Percentile £76,250 £75,772 £80,000
90th Percentile £97,500 £93,750 £97,500
UK median annual salary £60,000 £57,500 £65,000
% change year-on-year +4.35% -11.54% +4.00%

All Application Platform Skills
England

Confluence falls under the Application Platforms category. For comparison with the information above, the following table provides summary statistics for all permanent job vacancies requiring application platform skills in England.

Permanent vacancies with a requirement for application platform skills 4,033 8,993 9,383
As % of all permanent jobs advertised in England 8.22% 9.45% 11.38%
Number of salaries quoted 2,660 6,602 6,694
10th Percentile £29,750 £27,500 £31,250
25th Percentile £37,500 £35,000 £40,000
Median annual salary (50th Percentile) £55,000 £50,000 £56,500
Median % change year-on-year +10.00% -11.50% +2.73%
75th Percentile £75,000 £72,500 £77,500
90th Percentile £110,000 £102,500 £97,500
UK median annual salary £54,000 £50,000 £55,043
% change year-on-year +8.00% -9.16% +0.08%

Confluence
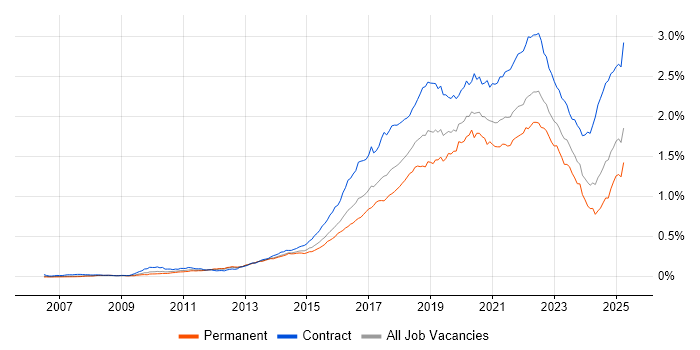
Job Vacancy Trend in England

Job postings citing Confluence as a proportion of all IT jobs advertised in England.

Job vacancy trend for Confluence in England

Confluence
Salary Trend in England

3-month moving average salary quoted in jobs citing Confluence in England.

Salary trend for Confluence in England

Confluence
Salary Histogram in England

Salary distribution for jobs citing Confluence in England over the 6 months to 12 June 2025.

Salary histogram for Confluence in England

Confluence
Job Locations in England

The table below looks at the demand and provides a guide to the median salaries quoted in IT jobs citing Confluence within the England region over the 6 months to 12 June 2025. The 'Rank Change' column provides an indication of the change in demand within each location based on the same 6 month period last year.

Location Rank Change
on Same Period
Last Year
Matching
Permanent
IT Job Ads
Median Salary
Past 6 Months
Median Salary
% Change
on Same Period
Last Year
Live
Jobs
North of England +100 228 £62,500 - 109
London +58 184 £70,000 - 334
North West +75 164 £63,900 +16.18% 59
Midlands +129 141 £51,250 +20.59% 81
West Midlands +95 73 £72,500 +31.82% 63
East Midlands +95 68 £22,500 -39.19% 17
South East +80 62 £48,750 -15.22% 218
Yorkshire +56 54 £48,507 -22.39% 39
South West -5 40 £50,000 - 47
East of England +47 34 £82,500 +65.00% 17
North East +41 10 £22,500 -67.86% 11
Confluence
UK

Confluence
Co-occurring Skills and Capabilities in England by Category

The follow tables expand on the table above by listing co-occurrences grouped by category. The same employment type, locality and period is covered with up to 20 co-occurrences shown in each of the following categories:

Application Platforms
1 19 (2.64%) SharePoint
2 3 (0.42%) Adobe Experience Manager
2 3 (0.42%) nginx
2 3 (0.42%) Tomcat
3 2 (0.28%) CICS
3 2 (0.28%) CMS
3 2 (0.28%) Microsoft Exchange
3 2 (0.28%) WebSphere
3 2 (0.28%) WebSphere Application Server
4 1 (0.14%) Apache
4 1 (0.14%) Appian
4 1 (0.14%) ColdFusion
4 1 (0.14%) JBoss
Applications
1 98 (13.63%) Microsoft Office
2 31 (4.31%) Microsoft Excel
3 15 (2.09%) MS Visio
4 13 (1.81%) Microsoft Project
5 12 (1.67%) Microsoft PowerPoint
6 3 (0.42%) Mozilla Thunderbird
7 2 (0.28%) Adobe XD
7 2 (0.28%) FrameMaker
7 2 (0.28%) MadCap Flare
7 2 (0.28%) Trello
8 1 (0.14%) Adobe After Effects
8 1 (0.14%) Adobe Creative Suite
8 1 (0.14%) Adobe Illustrator
8 1 (0.14%) Adobe Premiere
8 1 (0.14%) InDesign
8 1 (0.14%) Photoshop
Business Applications
1 2 (0.28%) Dynamics NAV
2 1 (0.14%) Endur
2 1 (0.14%) Payment Gateway
2 1 (0.14%) Shopify
Cloud Services
1 212 (29.49%) AWS
2 200 (27.82%) Azure
3 144 (20.03%) GCP
4 78 (10.85%) Miro
5 72 (10.01%) Asana
6 43 (5.98%) GitHub
7 36 (5.01%) Amazon S3
8 34 (4.73%) Amazon CloudWatch
8 34 (4.73%) Amazon EC2
9 30 (4.17%) AWS KMS
10 27 (3.76%) Virtual Private Cloud
11 25 (3.48%) Microsoft 365
12 23 (3.20%) Amazon ELB
13 21 (2.92%) SaaS
13 21 (2.92%) Serverless
14 20 (2.78%) Amazon Glacier
15 18 (2.50%) Azure DevOps
16 15 (2.09%) AWS Lambda
17 11 (1.53%) Power Platform
18 10 (1.39%) AWS CloudFormation
Communications & Networking
1 76 (10.57%) Broadband
2 31 (4.31%) Firewall
3 19 (2.64%) Internet
4 13 (1.81%) DNS
5 12 (1.67%) HTTP
6 10 (1.39%) FTP
6 10 (1.39%) SMTP
6 10 (1.39%) SSH
6 10 (1.39%) Wi-Fi
7 4 (0.56%) 5G
7 4 (0.56%) OpenLDAP
7 4 (0.56%) VPN
8 3 (0.42%) IMAP
8 3 (0.42%) Network Security
8 3 (0.42%) SAN
8 3 (0.42%) Wireless
9 2 (0.28%) DHCP
9 2 (0.28%) iSCSI
9 2 (0.28%) LAN
9 2 (0.28%) WAN
Database & Business Intelligence
1 154 (21.42%) SQL Server
2 62 (8.62%) Relational Database
3 58 (8.07%) MySQL
4 39 (5.42%) PostgreSQL
5 31 (4.31%) Amazon RDS
6 24 (3.34%) MongoDB
7 20 (2.78%) NoSQL
8 13 (1.81%) Amazon Aurora
9 10 (1.39%) Oracle Reports
10 9 (1.25%) DynamoDB
11 8 (1.11%) Redis
12 7 (0.97%) Power BI
13 6 (0.83%) Amazon QuickSight
13 6 (0.83%) Amazon Redshift
13 6 (0.83%) BusinessObjects
13 6 (0.83%) Elasticsearch
14 4 (0.56%) RDBMS
15 3 (0.42%) Apache Cassandra
15 3 (0.42%) Couchbase
15 3 (0.42%) Tableau
Development Applications
1 688 (95.69%) JIRA
2 165 (22.95%) Bitbucket
3 152 (21.14%) SonarQube
4 139 (19.33%) Sonatype Nexus
5 135 (18.78%) Maven
6 131 (18.22%) GitLab
7 127 (17.66%) Git
8 125 (17.39%) Selenium
9 122 (16.97%) Cucumber
10 78 (10.85%) Jenkins
11 23 (3.20%) Vagrant
12 19 (2.64%) TeamCity
13 17 (2.36%) Ant
14 13 (1.81%) JUnit
15 8 (1.11%) Mockito
16 7 (0.97%) Atlassian Bamboo
16 7 (0.97%) Bitbucket Server
16 7 (0.97%) DbUnit
16 7 (0.97%) jMock
17 5 (0.70%) Artifactory
General
1 303 (42.14%) Finance
2 166 (23.09%) Banking
3 149 (20.72%) Social Skills
4 119 (16.55%) Inclusion and Diversity
5 78 (10.85%) Influencing Skills
6 59 (8.21%) Analytical Skills
6 59 (8.21%) Manufacturing
7 54 (7.51%) Law
8 38 (5.29%) Public Sector
9 21 (2.92%) Retail
10 16 (2.23%) Marketing
11 10 (1.39%) Presentation Skills
12 9 (1.25%) Back Office
12 9 (1.25%) Organisational Skills
13 8 (1.11%) Documentation Skills
13 8 (1.11%) Investment Banking
14 7 (0.97%) Automotive
15 5 (0.70%) Advertising
15 5 (0.70%) Financial Institution
15 5 (0.70%) Legal
Job Titles
1 180 (25.03%) Analyst
2 149 (20.72%) Software Engineer
3 96 (13.35%) Lead
4 82 (11.40%) Architect
5 75 (10.43%) Senior
6 74 (10.29%) Product Analyst
7 65 (9.04%) Developer
8 58 (8.07%) Lead Architect
8 58 (8.07%) Solutions Architect
9 56 (7.79%) Lead Solutions Architect
10 49 (6.82%) IT Support
11 46 (6.40%) Support Analyst
12 43 (5.98%) Business Analyst
13 31 (4.31%) IT Analyst
13 31 (4.31%) IT Support Analyst
14 29 (4.03%) SQL Analyst
14 29 (4.03%) SQL Support Analyst
15 27 (3.76%) IT Engineer
16 26 (3.62%) Support Engineer
17 24 (3.34%) Delivery Manager
Libraries, Frameworks & Software Standards
1 138 (19.19%) React
2 137 (19.05%) Spring
3 127 (17.66%) Spring Boot
4 125 (17.39%) CSS
4 125 (17.39%) HTML
5 124 (17.25%) Kafka
6 118 (16.41%) Hibernate
7 116 (16.13%) JPA
8 110 (15.30%) Redux
9 46 (6.40%) .NET
10 26 (3.62%) Node.js
11 24 (3.34%) Web Services
12 22 (3.06%) SOAP
13 21 (2.92%) REST
14 18 (2.50%) AngularJS
14 18 (2.50%) RESTful
15 11 (1.53%) GraphQL
15 11 (1.53%) Vue
16 10 (1.39%) 802.1X
17 9 (1.25%) Flask
Miscellaneous
1 220 (30.60%) Product Ownership
2 110 (15.30%) Enterprise Software
3 79 (10.99%) Self-Motivation
4 72 (10.01%) Over-the-Top Content
4 72 (10.01%) Video\Live Streaming
5 33 (4.59%) Management Information System
6 19 (2.64%) Replication
7 15 (2.09%) Onboarding
8 11 (1.53%) CMDB
8 11 (1.53%) Virtual Team
9 10 (1.39%) Mobile App
10 9 (1.25%) Cloud Native
11 8 (1.11%) IoT
12 7 (0.97%) Distributed Architecture
12 7 (0.97%) Public Cloud
12 7 (0.97%) Wiki
13 6 (0.83%) Analytical Mindset
13 6 (0.83%) Data Centre
13 6 (0.83%) Greenfield Project
14 4 (0.56%) Cyber Defence
Operating Systems
1 124 (17.25%) Linux
2 74 (10.29%) Windows
3 24 (3.34%) VMS
4 19 (2.64%) Unix
5 11 (1.53%) Amazon Linux
6 7 (0.97%) Android
7 6 (0.83%) Red Hat Enterprise Linux
8 4 (0.56%) Debian
8 4 (0.56%) Ubuntu
9 3 (0.42%) CentOS
9 3 (0.42%) Mac OS
10 2 (0.28%) Solaris
10 2 (0.28%) Windows Server
10 2 (0.28%) zOS
11 1 (0.14%) Apple iOS
11 1 (0.14%) Windows 10
Processes & Methodologies
1 548 (76.22%) Agile
2 241 (33.52%) DevOps
3 201 (27.96%) CI/CD
4 165 (22.95%) Software Engineering
5 157 (21.84%) Microservices
6 149 (20.72%) Continuous Improvement
7 148 (20.58%) Test Automation
8 141 (19.61%) Stakeholder Management
9 140 (19.47%) TDD
10 138 (19.19%) SDLC
11 132 (18.36%) Containerisation
12 123 (17.11%) Full-Stack Development
13 120 (16.69%) Front End Development
14 112 (15.58%) Roadmaps
15 111 (15.44%) Clean Code
16 110 (15.30%) Performance Optimisation
17 96 (13.35%) Customer Service
18 87 (12.10%) Product Management
19 84 (11.68%) Business Strategy
19 84 (11.68%) Problem-Solving
Programming Languages
1 210 (29.21%) SQL
2 184 (25.59%) Java
3 167 (23.23%) JavaScript
4 75 (10.43%) Python
5 51 (7.09%) C#
6 29 (4.03%) PowerShell
7 28 (3.89%) Groovy
8 24 (3.34%) TypeScript
9 15 (2.09%) T-SQL
10 9 (1.25%) Bash
11 8 (1.11%) Perl
12 7 (0.97%) Apex Code
13 6 (0.83%) Kotlin
14 5 (0.70%) Go
15 4 (0.56%) PHP
16 3 (0.42%) R
16 3 (0.42%) Shell Script
17 2 (0.28%) COBOL
18 1 (0.14%) Gremlin
18 1 (0.14%) PL/SQL
Qualifications
1 105 (14.60%) BPSS Clearance
2 68 (9.46%) Degree
3 48 (6.68%) Security Cleared
4 40 (5.56%) SC Cleared
5 15 (2.09%) HND
6 13 (1.81%) AWS Certification
7 11 (1.53%) Azure Certification
8 8 (1.11%) PMI Certification
9 5 (0.70%) Computer Science Degree
9 5 (0.70%) ISTQB
10 3 (0.42%) (ISC)2 CCSP
10 3 (0.42%) CBAP
10 3 (0.42%) CCSP
10 3 (0.42%) Cisco Certification
10 3 (0.42%) CISM
10 3 (0.42%) CISSP
10 3 (0.42%) DV Cleared
10 3 (0.42%) Numerate Degree
10 3 (0.42%) OCP
10 3 (0.42%) PMP
Quality Assurance & Compliance
1 138 (19.19%) QA
2 38 (5.29%) SLA
3 8 (1.11%) Accessibility
3 8 (1.11%) GDPR
4 6 (0.83%) ISO 20022
5 5 (0.70%) ISO/IEC 27001
5 5 (0.70%) PMO
6 3 (0.42%) GRC
6 3 (0.42%) HIPAA
6 3 (0.42%) NIST
6 3 (0.42%) Software Quality Assurance
7 2 (0.28%) SOC 2
7 2 (0.28%) Solvency II
8 1 (0.14%) California Consumer Privacy Act
8 1 (0.14%) Data Quality
8 1 (0.14%) EMIR
8 1 (0.14%) PERC
System Software
1 173 (24.06%) Docker
2 24 (3.34%) Active Directory
3 17 (2.36%) DFS Replication
4 8 (1.11%) Virtual Desktop
5 3 (0.42%) Dovecot
5 3 (0.42%) Postfix
5 3 (0.42%) Squid
5 3 (0.42%) VMware Infrastructure
6 2 (0.28%) Hyper-V
6 2 (0.28%) KVM
6 2 (0.28%) NFS
6 2 (0.28%) SRDF
6 2 (0.28%) Veritas Cluster Server
6 2 (0.28%) VMware ESXi
6 2 (0.28%) Xen
7 1 (0.14%) Virtual Machines
Systems Management
1 156 (21.70%) Kubernetes
2 69 (9.60%) Ansible
3 44 (6.12%) Terraform
4 39 (5.42%) Prometheus
5 36 (5.01%) Grafana
6 7 (0.97%) Puppet
7 6 (0.83%) Progress Chef
8 4 (0.56%) Argo
8 4 (0.56%) Nessus
8 4 (0.56%) Proxmox
9 3 (0.42%) Istio
9 3 (0.42%) Jamf Pro
9 3 (0.42%) Kibana
9 3 (0.42%) Single Sign-On
10 2 (0.28%) CA Endevor
10 2 (0.28%) Kustomize
10 2 (0.28%) Microsoft Intune
10 2 (0.28%) vCenter Server
11 1 (0.14%) FortiGate
11 1 (0.14%) SCOM
Vendors
1 121 (16.83%) Microsoft
2 108 (15.02%) Solace
3 89 (12.38%) Salesforce
4 87 (12.10%) Atlassian
5 62 (8.62%) SAP
6 56 (7.79%) Siemens
7 40 (5.56%) ServiceNow
8 31 (4.31%) Oracle
9 20 (2.78%) Google
10 15 (2.09%) Juniper
11 13 (1.81%) Adobe
12 8 (1.11%) Cisco
12 8 (1.11%) IBM
13 6 (0.83%) CA Agile Central
13 6 (0.83%) Dynatrace
13 6 (0.83%) VMware
14 5 (0.70%) Red Hat
14 5 (0.70%) Splunk
15 4 (0.56%) Palo Alto
15 4 (0.56%) Samsung