GDPR Jobs in the North of England

General Data Protection Regulation EU 2016/679 (GDPR)
England > North of England

The table below provides summary statistics for permanent job vacancies advertised in the North of England requiring GDPR skills. It includes a benchmarking guide to the annual salaries offered in vacancies that cited GDPR over the 6 months leading up to 16 May 2025, comparing them to the same period in the previous two years.

6 months to
16 May 2025
Same period 2024 Same period 2023
Rank 203 113 306
Rank change year-on-year -90 +193 -135
Permanent jobs citing GDPR 145 402 126
As % of all permanent jobs advertised in the North of England 1.25% 2.29% 0.74%
As % of the Quality Assurance & Compliance category 7.94% 16.93% 3.40%
Number of salaries quoted 110 192 106
10th Percentile £24,950 £27,050 £33,374
25th Percentile £31,250 £33,000 £40,125
Median annual salary (50th Percentile) £50,000 £42,250 £47,625
Median % change year-on-year +18.34% -11.29% -13.41%
75th Percentile £73,750 £62,500 £60,000
90th Percentile £77,500 £82,548 £68,750
England median annual salary £62,500 £46,500 £55,000
% change year-on-year +34.41% -15.45% -4.35%

All Quality Assurance and Compliance Skills
North of England

GDPR falls under the Quality Assurance and Compliance category. For comparison with the information above, the following table provides summary statistics for all permanent job vacancies requiring quality assurance or compliance skills in the North of England.

Permanent vacancies with a requirement for quality assurance or compliance skills 1,827 2,374 3,708
As % of all permanent jobs advertised in the North of England 15.71% 13.54% 21.80%
Number of salaries quoted 801 1,644 1,142
10th Percentile £28,500 £26,250 £28,000
25th Percentile £40,000 £35,000 £37,500
Median annual salary (50th Percentile) £47,683 £47,500 £50,000
Median % change year-on-year +0.39% -5.00% +11.11%
75th Percentile £61,250 £62,500 £65,000
90th Percentile £77,500 £82,548 £79,925
England median annual salary £60,000 £52,500 £57,500
% change year-on-year +14.29% -8.70% +4.55%

GDPR
Job Vacancy Trend in the North of England

Job postings citing GDPR as a proportion of all IT jobs advertised in the North of England.
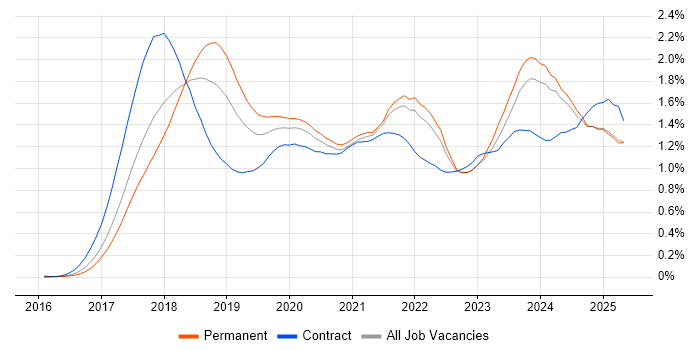
Job vacancy trend for GDPR in the North of England

GDPR
Salary Trend in the North of England

3-month moving average salary quoted in jobs citing GDPR in the North of England.

Salary trend for GDPR in the North of England

GDPR
Salary Histogram in the North of England

Salary distribution for jobs citing GDPR in the North of England over the 6 months to 16 May 2025.

Salary histogram for GDPR in the North of England

GDPR
Job Locations in the North of England

The table below looks at the demand and provides a guide to the median salaries quoted in IT jobs citing GDPR within the North of England region over the 6 months to 16 May 2025. The 'Rank Change' column provides an indication of the change in demand within each location based on the same 6 month period last year.

Location Rank Change
on Same Period
Last Year
Matching
Permanent
IT Job Ads
Median Salary
Past 6 Months
Median Salary
% Change
on Same Period
Last Year
Live
Jobs
North West -85 82 £48,306 +20.77% 135
Yorkshire -25 47 £50,375 +9.51% 74
North East +3 16 £57,500 +42.86% 18
GDPR
England

GDPR
Co-occurring Skills and Capabilities in the North of England by Category

The follow tables expand on the table above by listing co-occurrences grouped by category. The same employment type, locality and period is covered with up to 20 co-occurrences shown in each of the following categories:

Application Platforms
1 19 (13.10%) CMS
1 19 (13.10%) Umbraco
2 8 (5.52%) SharePoint
3 7 (4.83%) SAS
4 3 (2.07%) Microsoft Exchange
5 2 (1.38%) Apache Spark
6 1 (0.69%) Confluence
Applications
1 7 (4.83%) Microsoft Office
2 2 (1.38%) Microsoft Excel
Business Applications
1 1 (0.69%) Payment Gateway
Cloud Services
1 22 (15.17%) Azure
2 15 (10.34%) Microsoft 365
3 14 (9.66%) AWS
3 14 (9.66%) GCP
4 8 (5.52%) Power Platform
5 5 (3.45%) Azure DevOps
6 4 (2.76%) Azure Monitor
6 4 (2.76%) Entra ID
7 3 (2.07%) Cloud Computing
7 3 (2.07%) Facebook Ads
7 3 (2.07%) OneDrive
7 3 (2.07%) SaaS
7 3 (2.07%) Snowflake
8 2 (1.38%) Amazon EMR
8 2 (1.38%) Amazon SageMaker
8 2 (1.38%) IaaS
8 2 (1.38%) PaaS
9 1 (0.69%) AWS CloudFormation
9 1 (0.69%) Azure Data Factory
9 1 (0.69%) Dynamics 365
Communications & Networking
1 24 (16.55%) Firewall
2 19 (13.10%) Intranet
2 19 (13.10%) Intrusion Detection
3 8 (5.52%) Network Security
4 6 (4.14%) VPN
5 3 (2.07%) Broadband
5 3 (2.07%) SD-WAN
5 3 (2.07%) WAN
6 2 (1.38%) LAN
6 2 (1.38%) Wi-Fi
7 1 (0.69%) BGP
7 1 (0.69%) EIGRP
7 1 (0.69%) IPsec
7 1 (0.69%) MPLS
7 1 (0.69%) OSPF
7 1 (0.69%) Structured Cabling
7 1 (0.69%) TCP/IP
Database & Business Intelligence
1 22 (15.17%) SQL Server
2 12 (8.28%) NoSQL
3 8 (5.52%) Power BI
4 4 (2.76%) Data Warehouse
4 4 (2.76%) Tableau
5 3 (2.07%) SQL Server Integration Services
5 3 (2.07%) SQL Server Reporting Services
6 2 (1.38%) BigQuery
7 1 (0.69%) Data Lake
7 1 (0.69%) Elasticsearch
7 1 (0.69%) Endeca
7 1 (0.69%) Looker
7 1 (0.69%) Metadata
7 1 (0.69%) Power Query
Development Applications
1 7 (4.83%) Jenkins
2 3 (2.07%) Selenium
3 2 (1.38%) Git
3 2 (1.38%) GitLab
3 2 (1.38%) JIRA
3 2 (1.38%) SQL Server Management Studio (SSMS)
4 1 (0.69%) Gradle
4 1 (0.69%) JUnit
4 1 (0.69%) Maven
4 1 (0.69%) Postman
4 1 (0.69%) SoapUI
4 1 (0.69%) Sonatype Nexus
4 1 (0.69%) Spinnaker
4 1 (0.69%) TestNG
General
1 92 (63.45%) Social Skills
2 29 (20.00%) Finance
3 27 (18.62%) Analytical Skills
4 21 (14.48%) Legal
5 20 (13.79%) Law
6 9 (6.21%) Banking
7 8 (5.52%) Financial Institution
7 8 (5.52%) Inclusion and Diversity
7 8 (5.52%) Prime Brokerage
8 6 (4.14%) Advertising
8 6 (4.14%) Retail
9 4 (2.76%) Manufacturing
9 4 (2.76%) Marketing
9 4 (2.76%) Pharmaceutical
10 3 (2.07%) Brand Awareness
10 3 (2.07%) Influencing Skills
10 3 (2.07%) Organisational Skills
11 2 (1.38%) Public Sector
12 1 (0.69%) Aviation
12 1 (0.69%) Presentation Skills
Job Titles
1 29 (20.00%) Architect
2 20 (13.79%) Lead
3 19 (13.10%) Developer
3 19 (13.10%) Umbraco Developer
4 16 (11.03%) Security Architect
5 13 (8.97%) Risk Manager
6 12 (8.28%) Security Engineer
7 11 (7.59%) Senior
7 11 (7.59%) Solutions Architect
8 10 (6.90%) Lead Architect
9 9 (6.21%) Infrastructure Engineer
10 7 (4.83%) Enterprise Management Architect
10 7 (4.83%) Enterprise Solutions Architect
10 7 (4.83%) Infrastructure Security Engineer
10 7 (4.83%) Lead Solutions Architect
11 6 (4.14%) Consultant
11 6 (4.14%) Cybersecurity Engineer
11 6 (4.14%) DevOps Engineer
11 6 (4.14%) Information Security Consultant
11 6 (4.14%) Security Consultant
Libraries, Frameworks & Software Standards
1 19 (13.10%) CSS
1 19 (13.10%) HTML
1 19 (13.10%) HTML5
1 19 (13.10%) jQuery
2 4 (2.76%) ARM Templates
3 3 (2.07%) RESTful
3 3 (2.07%) SOAP
4 2 (1.38%) .NET
4 2 (1.38%) Kafka
4 2 (1.38%) LDAP
5 1 (0.69%) JSON
5 1 (0.69%) JWT
5 1 (0.69%) OAuth
5 1 (0.69%) OAuth2
5 1 (0.69%) XML
Miscellaneous
1 34 (23.45%) Management Information System
2 22 (15.17%) Security Posture
3 21 (14.48%) NHS
3 21 (14.48%) Self-Motivation
4 17 (11.72%) Social Media
5 14 (9.66%) Team-Oriented Environment
6 11 (7.59%) Distributed Systems
7 9 (6.21%) Cyber Threat
8 8 (5.52%) Blockchain
8 8 (5.52%) Credit Risk
8 8 (5.52%) Derivative
8 8 (5.52%) Hedge funds
8 8 (5.52%) Market Risk
8 8 (5.52%) Product Ownership
9 7 (4.83%) Cyber Security Posture
9 7 (4.83%) Data Protection Act
10 5 (3.45%) Cyberattack
11 4 (2.76%) Cloud Native
11 4 (2.76%) Cyber Kill Chain
11 4 (2.76%) Operational Technology
Operating Systems
1 21 (14.48%) Windows
2 14 (9.66%) Windows Vista
3 7 (4.83%) Linux
4 3 (2.07%) CentOS
4 3 (2.07%) Ubuntu
5 1 (0.69%) Windows Server
Processes & Methodologies
1 56 (38.62%) Problem-Solving
2 48 (33.10%) Risk Management
3 37 (25.52%) Cybersecurity
3 37 (25.52%) Data Protection
4 36 (24.83%) Information Security
5 29 (20.00%) DevOps
6 28 (19.31%) CI/CD
7 27 (18.62%) Continuous Improvement
8 26 (17.93%) Vulnerability Management
9 23 (15.86%) Agile
9 23 (15.86%) Incident Response
10 22 (15.17%) Data Management
11 21 (14.48%) TOGAF
12 20 (13.79%) Analytics
13 19 (13.10%) Clean Code
13 19 (13.10%) Containerisation
13 19 (13.10%) Content Management
13 19 (13.10%) Customer Requirements
13 19 (13.10%) Web Development
14 18 (12.41%) Computer Science
Programming Languages
1 34 (23.45%) SQL
2 25 (17.24%) C#
3 20 (13.79%) Python
4 12 (8.28%) PowerShell
5 9 (6.21%) Bash
6 8 (5.52%) Java
7 7 (4.83%) R
8 6 (4.14%) JavaScript
9 2 (1.38%) T-SQL
10 1 (0.69%) Data Analysis Expressions
10 1 (0.69%) Progress 4GL
Qualifications
1 46 (31.72%) Degree
2 23 (15.86%) CISSP
3 22 (15.17%) CISA
4 19 (13.10%) CISM
5 16 (11.03%) CEH
5 16 (11.03%) Cisco Certification
6 15 (10.34%) Master's Degree
7 14 (9.66%) (ISC)2 CCSP
7 14 (9.66%) Computer Science Degree
7 14 (9.66%) DBS Check
8 11 (7.59%) Azure Certification
9 7 (4.83%) AWS Certification
10 4 (2.76%) AWS Certified Solutions Architect
10 4 (2.76%) Security Cleared
11 3 (2.07%) CISMP
11 3 (2.07%) GSEC
11 3 (2.07%) Linux+ Certification
11 3 (2.07%) RHCE
12 2 (1.38%) Microsoft Certification
13 1 (0.69%) CCIE
Quality Assurance & Compliance
1 45 (31.03%) ISO/IEC 27001
2 38 (26.21%) NIST
3 20 (13.79%) Accessibility
4 19 (13.10%) WCAG
5 18 (12.41%) PCI DSS
6 12 (8.28%) HIPAA
7 11 (7.59%) California Consumer Privacy Act
8 10 (6.90%) Cyber Essentials
8 10 (6.90%) ISO/IEC 27002 (supersedes ISO/IEC 17799)
9 8 (5.52%) Basel III
9 8 (5.52%) IFRS
9 8 (5.52%) IFRS 9
10 7 (4.83%) Basel II
10 7 (4.83%) Dodd-Frank
11 4 (2.76%) Data Quality
11 4 (2.76%) SOC 2
12 3 (2.07%) GRC
13 2 (1.38%) Cyber Essentials PLUS
14 1 (0.69%) ISO 9001
14 1 (0.69%) SLA
System Software
1 12 (8.28%) Docker
2 5 (3.45%) Active Directory
3 4 (2.76%) Virtual Machines
3 4 (2.76%) VMware Infrastructure
4 3 (2.07%) Dovecot
4 3 (2.07%) Hyper-V
4 3 (2.07%) Postfix
5 1 (0.69%) Squid
Systems Management
1 12 (8.28%) Kubernetes
2 7 (4.83%) Terraform
3 4 (2.76%) SCCM
3 4 (2.76%) SCOM
3 4 (2.76%) SCOrch
4 2 (1.38%) Microsoft Intune
5 1 (0.69%) Ansible
5 1 (0.69%) Kibana
Vendors
1 32 (22.07%) Microsoft
2 19 (13.10%) HP
3 8 (5.52%) Google
4 4 (2.76%) VMware
5 3 (2.07%) Cisco
5 3 (2.07%) Facebook
5 3 (2.07%) Okta
5 3 (2.07%) Ping Identity
5 3 (2.07%) Red Hat
5 3 (2.07%) Salesforce
6 2 (1.38%) Rapid7
7 1 (0.69%) Capita
7 1 (0.69%) Citrix
7 1 (0.69%) CyberSource
7 1 (0.69%) Informatica
7 1 (0.69%) Juniper
7 1 (0.69%) Meraki
7 1 (0.69%) New Relic
7 1 (0.69%) Oracle
7 1 (0.69%) Progress