JIRA Jobs in the South East

Atlassian JIRA
England > South East

The table below provides summary statistics for permanent job vacancies advertised in the South East requiring JIRA skills. It includes a benchmarking guide to the annual salaries offered in vacancies that cited JIRA over the 6 months leading up to 26 July 2024, comparing them to the same period in the previous two years.

6 months to
26 Jul 2024
Same period 2023 Same period 2022
Rank 135 82 76
Rank change year-on-year -53 -6 -16
Permanent jobs citing JIRA 283 417 919
As % of all permanent jobs advertised in the South East 1.88% 3.60% 4.16%
As % of the Development Applications category 22.20% 25.57% 20.67%
Number of salaries quoted 170 304 534
10th Percentile £36,700 £33,750 £35,750
25th Percentile £41,250 £43,750 £43,000
Median annual salary (50th Percentile) £52,500 £55,000 £55,000
Median % change year-on-year -4.55% - +4.76%
75th Percentile £62,500 £70,000 £66,250
90th Percentile £74,125 £79,625 £75,000
England median annual salary £55,000 £60,000 £58,750
% change year-on-year -8.33% +2.13% +2.17%

All Development Application Skills
South East

JIRA falls under the Development Applications category. For comparison with the information above, the following table provides summary statistics for all permanent job vacancies requiring development application skills in the South East.

Permanent vacancies with a requirement for development application skills 1,275 1,631 4,446
As % of all permanent jobs advertised in the South East 8.45% 14.07% 20.15%
Number of salaries quoted 921 1,120 2,398
10th Percentile £38,500 £39,149 £36,250
25th Percentile £46,250 £48,563 £45,000
Median annual salary (50th Percentile) £57,500 £60,000 £57,500
Median % change year-on-year -4.17% +4.35% +9.52%
75th Percentile £72,500 £75,000 £72,500
90th Percentile £83,750 £91,375 £84,125
England median annual salary £60,000 £65,000 £62,500
% change year-on-year -7.69% +4.00% +8.70%

JIRA
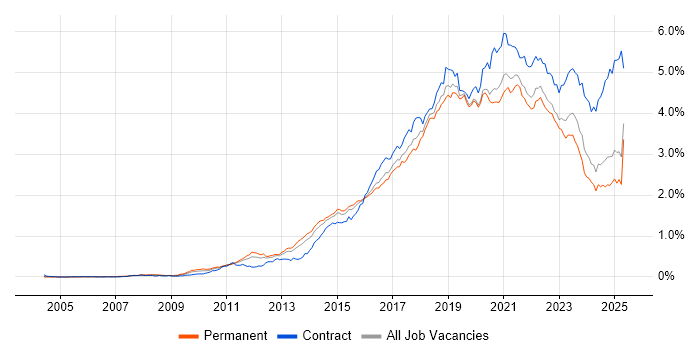
Job Vacancy Trend in the South East

Job postings citing JIRA as a proportion of all IT jobs advertised in the South East.

Job vacancy trend for JIRA in the South East

JIRA
Salary Trend in the South East

3-month moving average salary quoted in jobs citing JIRA in the South East.

Salary trend for JIRA in the South East

JIRA
Salary Histogram in the South East

Salary distribution for jobs citing JIRA in the South East over the 6 months to 26 July 2024.

Salary histogram for JIRA in the South East

JIRA
Job Locations in the South East

The table below looks at the demand and provides a guide to the median salaries quoted in IT jobs citing JIRA within the South East region over the 6 months to 26 July 2024. The 'Rank Change' column provides an indication of the change in demand within each location based on the same 6 month period last year.

Location Rank Change
on Same Period
Last Year
Matching
Permanent
IT Job Ads
Median Salary
Past 6 Months
Median Salary
% Change
on Same Period
Last Year
Live
Jobs
Thames Valley -19 103 £50,000 -18.37% 17
Surrey +16 77 £55,000 +0.92% 9
Berkshire -26 50 £50,000 -25.93% 3
Hampshire -81 43 £52,500 -1.87% 16
Buckinghamshire +21 34 £40,000 -17.10% 9
West Sussex +11 25 £47,500 - 10
Kent -34 20 £38,500 -30.00% 4
Oxfordshire -33 19 £48,750 -2.50% 5
East Sussex +13 7 £48,750 -11.36% 8
Middlesex -17 4 - -
Sussex - 2 £58,000 - 3
JIRA
England

JIRA
Co-occurring Skills and Capabilities in the South East by Category

The follow tables expand on the table above by listing co-occurrences grouped by category. The same employment type, locality and period is covered with up to 20 co-occurrences shown in each of the following categories:

Application Platforms
1 54 (19.08%) Confluence
2 17 (6.01%) CMS
3 9 (3.18%) IIS
4 7 (2.47%) SharePoint
5 5 (1.77%) Adobe Experience Manager
6 4 (1.41%) Kentico
7 3 (1.06%) nginx
8 2 (0.71%) Apache
9 1 (0.35%) Umbraco
Applications
1 15 (5.30%) Microsoft Excel
2 14 (4.95%) Microsoft Office
2 14 (4.95%) Microsoft Project
3 10 (3.53%) MS Visio
3 10 (3.53%) Simulink
4 8 (2.83%) Stateflow
5 6 (2.12%) OrCAD
6 5 (1.77%) Microsoft PowerPoint
7 4 (1.41%) Trello
8 1 (0.35%) Chatbot
8 1 (0.35%) Doxygen
8 1 (0.35%) Maya
8 1 (0.35%) MotionBuilder
8 1 (0.35%) Photoshop
8 1 (0.35%) Spreadsheet
Business Applications
1 4 (1.41%) SAP S/4HANA
1 4 (1.41%) SDL Web 8
2 3 (1.06%) Dynamics CRM
2 3 (1.06%) Salesforce CRM
2 3 (1.06%) Sparx Enterprise Architect
3 2 (0.71%) Primavera
4 1 (0.35%) SAP ERP
Cloud Services
1 60 (21.20%) Azure
2 40 (14.13%) AWS
3 23 (8.13%) Azure DevOps
4 20 (7.07%) Cloud Computing
5 19 (6.71%) GitHub
6 15 (5.30%) Power Platform
7 13 (4.59%) SaaS
8 6 (2.12%) Asana
8 6 (2.12%) Microsoft 365
8 6 (2.12%) Salesforce Sales Cloud
9 5 (1.77%) Basecamp
9 5 (1.77%) PaaS
10 4 (1.41%) Kontent
10 4 (1.41%) Mavenlink
10 4 (1.41%) Salesforce Service Cloud
11 3 (1.06%) Azure AKS
11 3 (1.06%) Azure Monitor
11 3 (1.06%) Miro
11 3 (1.06%) PowerApps
11 3 (1.06%) WhatsApp
Communications & Networking
1 26 (9.19%) Firewall
2 11 (3.89%) 5G
2 11 (3.89%) DNS
3 10 (3.53%) VPN
4 9 (3.18%) DHCP
4 9 (3.18%) Modbus
4 9 (3.18%) Wireless
5 8 (2.83%) 4G
6 7 (2.47%) 3G
6 7 (2.47%) GPRS
7 5 (1.77%) J1939
8 3 (1.06%) LTE
9 2 (0.71%) Internet
9 2 (0.71%) IPsec
9 2 (0.71%) LoRaWAN
9 2 (0.71%) MQTT
9 2 (0.71%) Network Security
9 2 (0.71%) RS-232
9 2 (0.71%) RS-485
9 2 (0.71%) Wi-Fi
Database & Business Intelligence
1 35 (12.37%) MySQL
2 17 (6.01%) SQL Server
3 13 (4.59%) Power BI
4 12 (4.24%) Relational Database
5 7 (2.47%) PostgreSQL
6 6 (2.12%) Azure SQL Database
7 5 (1.77%) Enterprise Data Warehouse
7 5 (1.77%) Tableau
8 4 (1.41%) NoSQL
9 3 (1.06%) SAP BW
10 2 (0.71%) Big Data
10 2 (0.71%) Data Warehouse
10 2 (0.71%) MariaDB
10 2 (0.71%) SQL Server Analysis Services
11 1 (0.35%) Apache Cassandra
11 1 (0.35%) Couchbase
11 1 (0.35%) Data Mart
11 1 (0.35%) Microsoft Analysis Services
11 1 (0.35%) QlikView
11 1 (0.35%) SQL Server Integration Services
Development Applications
1 81 (28.62%) Git
2 49 (17.31%) Jenkins
3 21 (7.42%) Bitbucket
4 19 (6.71%) Team Foundation Server
5 14 (4.95%) TestRail
5 14 (4.95%) Visual Studio
6 13 (4.59%) Robot Framework
7 12 (4.24%) Selenium
8 11 (3.89%) Maven
9 10 (3.53%) Cypress.io
9 10 (3.53%) Octopus Deploy
9 10 (3.53%) Zephyr
10 9 (3.18%) CMake
10 9 (3.18%) GitLab
10 9 (3.18%) Trac
11 8 (2.83%) MSBuild
12 7 (2.47%) Postman
12 7 (2.47%) Rational DOORS
13 6 (2.12%) JMeter
13 6 (2.12%) SoapUI
General
1 97 (34.28%) Social Skills
2 47 (16.61%) Analytical Skills
3 37 (13.07%) Finance
4 27 (9.54%) Telecoms
5 25 (8.83%) Marketing
6 23 (8.13%) Retail
7 22 (7.77%) Aerospace
8 18 (6.36%) Automotive
8 18 (6.36%) Electronics
8 18 (6.36%) Manufacturing
9 17 (6.01%) Public Sector
10 16 (5.65%) Organisational Skills
11 9 (3.18%) Games
12 6 (2.12%) Billing
12 6 (2.12%) Documentation Skills
13 5 (1.77%) Law
14 4 (1.41%) Presentation Skills
15 3 (1.06%) Legal
16 2 (0.71%) Inclusion and Diversity
17 1 (0.35%) Influencing Skills
Job Titles
1 61 (21.55%) Developer
2 47 (16.61%) Senior
3 32 (11.31%) Software Engineer
4 29 (10.25%) Analyst
5 21 (7.42%) Project Manager
6 17 (6.01%) Senior Developer
7 15 (5.30%) Business Analyst
7 15 (5.30%) Consultant
8 13 (4.59%) Embedded Engineer
8 13 (4.59%) Full Stack Developer
8 13 (4.59%) PHP Developer
8 13 (4.59%) Software Consultant
9 12 (4.24%) Support Engineer
10 11 (3.89%) .NET Developer
10 11 (3.89%) Systems Engineer
11 10 (3.53%) Infrastructure Engineer
11 10 (3.53%) Lead
12 9 (3.18%) Java Developer
12 9 (3.18%) Senior Software Engineer
12 9 (3.18%) Tester
Libraries, Frameworks & Software Standards
1 77 (27.21%) HTML
2 53 (18.73%) CSS
3 36 (12.72%) REST
4 34 (12.01%) .NET
5 32 (11.31%) React
6 31 (10.95%) Web Services
7 26 (9.19%) SOAP
7 26 (9.19%) XML
8 22 (7.77%) HTML5
9 19 (6.71%) ASP.NET
9 19 (6.71%) Laravel
9 19 (6.71%) Symfony
10 16 (5.65%) WPF
11 15 (5.30%) AngularJS
12 13 (4.59%) JSON
13 12 (4.24%) .NET Framework
14 11 (3.89%) LAMP
14 11 (3.89%) Swagger
15 9 (3.18%) Twitter Bootstrap
15 9 (3.18%) Vulkan
Miscellaneous
1 29 (10.25%) Product Ownership
2 18 (6.36%) Linux Command Line
3 15 (5.30%) Embedded Systems
4 12 (4.24%) Algorithms
5 11 (3.89%) Self-Motivation
6 10 (3.53%) IoT
7 9 (3.18%) CUDA
7 9 (3.18%) NB-IoT
8 8 (2.83%) Enterprise Software
8 8 (2.83%) Legacy Systems
9 7 (2.47%) Greenfield Project
9 7 (2.47%) Management Information System
9 7 (2.47%) Mobile App
9 7 (2.47%) PMI
10 5 (1.77%) Client/Server
11 4 (1.41%) ARM Cortex
11 4 (1.41%) Legacy Code
12 3 (1.06%) Data Structures
12 3 (1.06%) Low-Code
12 3 (1.06%) NHS
Operating Systems
1 70 (24.73%) Linux
2 21 (7.42%) Windows
3 9 (3.18%) Windows Server
4 5 (1.77%) Embedded Linux
5 4 (1.41%) Ubuntu
6 2 (0.71%) Mac OS
7 1 (0.35%) Android
7 1 (0.35%) Apple iOS
7 1 (0.35%) Unix
Processes & Methodologies
1 115 (40.64%) Agile
2 85 (30.04%) Problem-Solving
3 64 (22.61%) DevOps
4 54 (19.08%) Project Management
4 54 (19.08%) Scrum
5 48 (16.96%) Software Engineering
6 47 (16.61%) Software Testing
7 35 (12.37%) MVC
8 30 (10.60%) Configuration Management
8 30 (10.60%) User Stories
9 28 (9.89%) E-Commerce
10 27 (9.54%) Actionable Insight
10 27 (9.54%) Business Intelligence
10 27 (9.54%) Stakeholder Management
11 25 (8.83%) CI/CD
11 25 (8.83%) Systems Engineering
11 25 (8.83%) Test Automation
11 25 (8.83%) Validation
12 24 (8.48%) Computer Science
13 23 (8.13%) Continuous Improvement
Programming Languages
1 80 (28.27%) JavaScript
2 71 (25.09%) SQL
3 55 (19.43%) C#
4 46 (16.25%) Python
5 34 (12.01%) Java
6 28 (9.89%) Bash
7 26 (9.19%) C
7 26 (9.19%) PHP
8 24 (8.48%) PowerShell
9 22 (7.77%) C++
10 11 (3.89%) MATLAB
10 11 (3.89%) TypeScript
11 9 (3.18%) C-shell
11 9 (3.18%) Fortran
12 6 (2.12%) Assembly Language
12 6 (2.12%) T-SQL
13 5 (1.77%) Embedded C
13 5 (1.77%) Groovy
14 3 (1.06%) VB
14 3 (1.06%) VBA
Qualifications
1 74 (26.15%) Degree
2 28 (9.89%) Security Cleared
3 22 (7.77%) SC Cleared
4 13 (4.59%) PMI Certification
5 11 (3.89%) Computer Science Degree
6 9 (3.18%) Master's Degree
7 8 (2.83%) Azure Certification
8 6 (2.12%) Microsoft Certification
8 6 (2.12%) PMP
9 4 (1.41%) ISTQB
10 3 (1.06%) CBAP
10 3 (1.06%) Chartered Engineer
10 3 (1.06%) DV Cleared
10 3 (1.06%) IIBA
10 3 (1.06%) PhD
11 2 (0.71%) DBS Check
11 2 (0.71%) PRINCE2 Practitioner
12 1 (0.35%) AWS Certification
12 1 (0.35%) ISTQB Advanced Certification
12 1 (0.35%) PgMP
Quality Assurance & Compliance
1 30 (10.60%) QA
2 8 (2.83%) PMO
3 7 (2.47%) MISRA
4 5 (1.77%) Automotive SPICE
4 5 (1.77%) ISO 26262
4 5 (1.77%) JTAG
5 4 (1.41%) IEC 61131
6 3 (1.06%) GDPR
6 3 (1.06%) IEC 62304
6 3 (1.06%) ISO 13485
6 3 (1.06%) ISO 9001
6 3 (1.06%) ISO/IEC 15288
6 3 (1.06%) SLA
7 2 (0.71%) Accessibility
7 2 (0.71%) AUTOSAR
7 2 (0.71%) MISRA C
7 2 (0.71%) PMBOK
8 1 (0.35%) GRC
System Software
1 22 (7.77%) Docker
2 11 (3.89%) Virtual Machines
3 9 (3.18%) Active Directory
3 9 (3.18%) Hyper-V
3 9 (3.18%) NFS
3 9 (3.18%) pfSense
4 7 (2.47%) Firmware
5 4 (1.41%) VMware Infrastructure
6 2 (0.71%) Embedded Firmware
7 1 (0.35%) Virtual Desktop
Systems Management
1 23 (8.13%) Kubernetes
2 11 (3.89%) Ansible
3 10 (3.53%) Grafana
4 9 (3.18%) Microsoft Data Protection Manager
4 9 (3.18%) SCDPM
4 9 (3.18%) ZABBIX
5 6 (2.12%) Terraform
6 4 (1.41%) HP Quality Center
7 3 (1.06%) Functional Safety
8 1 (0.35%) Jamf Pro
8 1 (0.35%) Microsoft Intune
8 1 (0.35%) Prometheus
8 1 (0.35%) Rancher
Vendors
1 60 (21.20%) Microsoft
2 23 (8.13%) SAP
3 21 (7.42%) Salesforce
4 14 (4.95%) ServiceNow
5 13 (4.59%) Adobe
5 13 (4.59%) VMware
6 10 (3.53%) Atlassian
6 10 (3.53%) Fortinet
6 10 (3.53%) Google
6 10 (3.53%) Juniper
6 10 (3.53%) McAfee
7 9 (3.18%) Veeam
8 8 (2.83%) IBM
9 6 (2.12%) MuleSoft
9 6 (2.12%) Oracle
10 5 (1.77%) EMC
10 5 (1.77%) Lauterbach
11 4 (1.41%) Databricks
11 4 (1.41%) HP
12 3 (1.06%) Facebook