IoT Jobs in the South East

IoT (Internet of Things, Internet of Everything)
England > South East

The table below looks at the prevalence of the term IoT in permanent job vacancies in the South East. Included is a benchmarking guide to the salaries offered in vacancies that cited IoT over the 6 months leading up to 26 July 2024, comparing them to the same period in the previous two years.

6 months to
26 Jul 2024
Same period 2023 Same period 2022
Rank 208 260 306
Rank change year-on-year +52 +46 +10
Permanent jobs citing IoT 155 101 216
As % of all permanent jobs advertised in the South East 1.03% 0.87% 0.98%
As % of the Miscellaneous category 3.09% 2.28% 2.24%
Number of salaries quoted 109 80 126
10th Percentile £32,900 £40,000 £27,750
25th Percentile £45,000 £50,000 £42,500
Median annual salary (50th Percentile) £55,000 £70,000 £55,000
Median % change year-on-year -21.43% +27.27% -8.33%
75th Percentile £68,000 £85,000 £65,000
90th Percentile £85,000 £91,250 £78,750
England median annual salary £60,000 £64,000 £70,000
% change year-on-year -6.25% -8.57% +16.67%

All Generic Skills
South East

IoT falls under the General and Transferable Skills category. For comparison with the information above, the following table provides summary statistics for all permanent job vacancies requiring generic IT skills in the South East.

Permanent vacancies with a requirement for generic IT skills 5,014 4,432 9,637
As % of all permanent jobs advertised in the South East 33.22% 38.25% 43.68%
Number of salaries quoted 3,005 2,762 4,582
10th Percentile £26,500 £32,500 £31,250
25th Percentile £36,250 £41,250 £42,500
Median annual salary (50th Percentile) £50,000 £55,690 £55,000
Median % change year-on-year -10.22% +1.25% +4.76%
75th Percentile £65,000 £73,844 £72,500
90th Percentile £78,750 £85,000 £85,000
England median annual salary £56,124 £65,000 £62,500
% change year-on-year -13.66% +4.00% +4.17%

IoT
Job Vacancy Trend in the South East

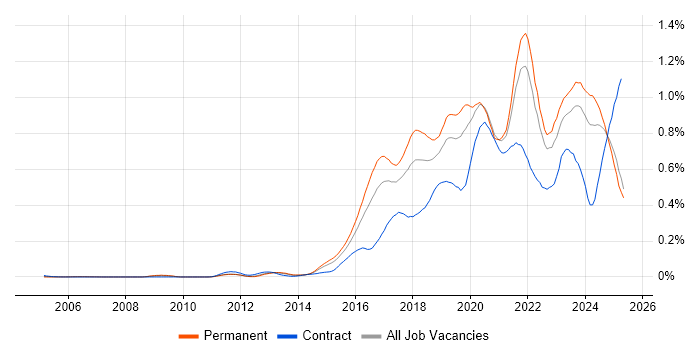
Job postings citing IoT as a proportion of all IT jobs advertised in the South East.

Job vacancy trend for IoT in the South East

IoT
Salary Trend in the South East

3-month moving average salary quoted in jobs citing IoT in the South East.

Salary trend for IoT in the South East

IoT
Salary Histogram in the South East

Salary distribution for jobs citing IoT in the South East over the 6 months to 26 July 2024.

Salary histogram for IoT in the South East

IoT
Job Locations in the South East

The table below looks at the demand and provides a guide to the median salaries quoted in IT jobs citing IoT within the South East region over the 6 months to 26 July 2024. The 'Rank Change' column provides an indication of the change in demand within each location based on the same 6 month period last year.

Location Rank Change
on Same Period
Last Year
Matching
Permanent
IT Job Ads
Median Salary
Past 6 Months
Median Salary
% Change
on Same Period
Last Year
Live
Jobs
Hampshire +8 55 £50,000 - 2
Thames Valley +18 50 £54,500 -23.51% 10
Surrey +7 34 £62,500 -3.85%
Berkshire +15 26 £75,000 +7.14% 5
Oxfordshire +8 22 £48,239 -8.98% 4
Kent -1 16 £55,000 +10.00% 1
West Sussex +25 6 £64,000 -26.86% 1
Buckinghamshire -15 2 £68,000 -12.26% 1
IoT
England

IoT
Co-occurring Skills and Capabilities in the South East by Category

The follow tables expand on the table above by listing co-occurrences grouped by category. The same employment type, locality and period is covered with up to 20 co-occurrences shown in each of the following categories:

Application Platforms
1 8 (5.16%) Kinematics
2 4 (2.58%) nginx
3 1 (0.65%) Apache
Applications
1 6 (3.87%) OrCAD
2 5 (3.23%) Microsoft Office
3 1 (0.65%) Chatbot
Cloud Services
1 31 (20.00%) Azure
2 17 (10.97%) AWS
2 17 (10.97%) SaaS
3 11 (7.10%) IaaS
3 11 (7.10%) Nutanix
4 7 (4.52%) Serverless
5 5 (3.23%) GitHub
6 4 (2.58%) Amazon EC2
6 4 (2.58%) Amazon ELB
6 4 (2.58%) Amazon S3
6 4 (2.58%) GCP
6 4 (2.58%) GitHub Actions
6 4 (2.58%) Power Platform
6 4 (2.58%) Virtual Private Cloud
7 2 (1.29%) Azure DevOps
7 2 (1.29%) Microsoft 365
8 1 (0.65%) AWS IoT
8 1 (0.65%) Azure Service Bus
8 1 (0.65%) Azure Stack
8 1 (0.65%) Twilio
Communications & Networking
1 20 (12.90%) 4G
2 16 (10.32%) 5G
3 15 (9.68%) Firewall
4 14 (9.03%) Internet
4 14 (9.03%) MPLS
4 14 (9.03%) WAN
5 12 (7.74%) DNS
6 11 (7.10%) Modbus
6 11 (7.10%) Wireless
7 8 (5.16%) GPRS
7 8 (5.16%) MQTT
8 7 (4.52%) 3G
8 7 (4.52%) RFID
9 6 (3.87%) Bluetooth
9 6 (3.87%) LoRaWAN
10 5 (3.23%) VPN
11 4 (2.58%) Ethernet
11 4 (2.58%) Reverse Proxy
11 4 (2.58%) RS-485
12 3 (1.94%) LTE
Database & Business Intelligence
1 7 (4.52%) Big Data
2 5 (3.23%) NoSQL
3 4 (2.58%) Amazon RDS
3 4 (2.58%) MySQL
3 4 (2.58%) PostgreSQL
3 4 (2.58%) Power BI
4 1 (0.65%) Elasticsearch
4 1 (0.65%) Relational Database
Development Applications
1 17 (10.97%) Git
2 16 (10.32%) Subversion
3 12 (7.74%) Visual Studio
4 10 (6.45%) JIRA
5 5 (3.23%) Eclipse
6 3 (1.94%) Jenkins
7 1 (0.65%) GitLab
7 1 (0.65%) Mocha
7 1 (0.65%) Selenium
General
1 46 (29.68%) Social Skills
2 32 (20.65%) Electronics
3 28 (18.06%) Finance
4 25 (16.13%) Telecoms
5 22 (14.19%) Analytical Skills
6 14 (9.03%) Public Sector
7 13 (8.39%) Marketing
8 12 (7.74%) Manufacturing
9 5 (3.23%) Legal
10 4 (2.58%) Financial Institution
10 4 (2.58%) Games
10 4 (2.58%) Local Government
10 4 (2.58%) Organisational Skills
10 4 (2.58%) Wearables
11 2 (1.29%) Retail
11 2 (1.29%) Tech for Good
12 1 (0.65%) Aerospace
12 1 (0.65%) Automotive
12 1 (0.65%) Billing
12 1 (0.65%) Inclusion and Diversity
Job Titles
1 40 (25.81%) Software Engineer
2 38 (24.52%) Senior
3 23 (14.84%) Embedded Engineer
4 19 (12.26%) Infrastructure Engineer
5 16 (10.32%) Embedded Software Engineer
6 15 (9.68%) Systems Engineer
7 14 (9.03%) Senior Embedded Engineer
8 13 (8.39%) Senior Software Engineer
9 12 (7.74%) Applications Engineer
10 9 (5.81%) Python Engineer
10 9 (5.81%) Senior Embedded Software Engineer
10 9 (5.81%) Senior Infrastructure Engineer
11 8 (5.16%) Architect
11 8 (5.16%) Hardware Engineer
11 8 (5.16%) Lead
11 8 (5.16%) Research Engineer
12 7 (4.52%) Developer
12 7 (4.52%) Electronics Engineer
13 6 (3.87%) Systems Architect
13 6 (3.87%) Team Leader
Libraries, Frameworks & Software Standards
1 19 (12.26%) .NET
2 12 (7.74%) .NET Framework
2 12 (7.74%) Qt
3 9 (5.81%) Node.js
4 7 (4.52%) WPF
5 6 (3.87%) React
6 5 (3.23%) CSS
6 5 (3.23%) HTML
6 5 (3.23%) RESTful
7 4 (2.58%) Flash
7 4 (2.58%) GraphQL
7 4 (2.58%) gRPC
7 4 (2.58%) Java RMI
7 4 (2.58%) Knex.js
7 4 (2.58%) LEMP Stack
7 4 (2.58%) Node-RED
7 4 (2.58%) React Native
7 4 (2.58%) Sequelize
8 2 (1.29%) Flask
8 2 (1.29%) web3js
Miscellaneous
1 16 (10.32%) Robotics
2 14 (9.03%) Driving Licence
3 12 (7.74%) Distributed Systems
4 11 (7.10%) ARM Cortex
4 11 (7.10%) Mobile App
5 9 (5.81%) Management Information System
5 9 (5.81%) NB-IoT
6 7 (4.52%) GNSS
6 7 (4.52%) Product Ownership
6 7 (4.52%) Raspberry Pi
7 5 (3.23%) Blockchain
8 4 (2.58%) Arduino
8 4 (2.58%) Self-Motivation
9 3 (1.94%) Algorithms
9 3 (1.94%) Augmented Reality
9 3 (1.94%) Embedded Systems
9 3 (1.94%) Renewable Energy
9 3 (1.94%) Virtual Reality
9 3 (1.94%) VLSI
10 2 (1.29%) Low-Code
Operating Systems
1 43 (27.74%) Linux
2 30 (19.35%) Windows
3 13 (8.39%) Windows 10
4 12 (7.74%) Embedded Linux
4 12 (7.74%) Ubuntu
5 6 (3.87%) Android
6 4 (2.58%) Apple iOS
7 2 (1.29%) FreeRTOS
8 1 (0.65%) Windows Server
8 1 (0.65%) Windows Server 2019
Processes & Methodologies
1 55 (35.48%) Software Engineering
2 43 (27.74%) DevOps
3 38 (24.52%) Problem-Solving
4 35 (22.58%) Agile
5 26 (16.77%) Data Management
6 23 (14.84%) Customer Requirements
6 23 (14.84%) Cybersecurity
6 23 (14.84%) Technical Leadership
7 20 (12.90%) Project Management
8 19 (12.26%) Infrastructure Engineering
9 18 (11.61%) CI/CD
9 18 (11.61%) Software Architecture
10 17 (10.97%) Computer Science
11 15 (9.68%) Artificial Intelligence
11 15 (9.68%) Disaster Recovery
12 14 (9.03%) Analytics
12 14 (9.03%) ITIL
12 14 (9.03%) Time Management
13 13 (8.39%) Business Intelligence
13 13 (8.39%) Test Strategy
Programming Languages
1 54 (34.84%) Python
2 42 (27.10%) C
3 41 (26.45%) C++
4 22 (14.19%) C#
4 22 (14.19%) JavaScript
5 16 (10.32%) Java
6 14 (9.03%) Perl
7 13 (8.39%) Bash
8 7 (4.52%) XAML
9 6 (3.87%) Assembly Language
10 4 (2.58%) JSX
10 4 (2.58%) R
10 4 (2.58%) TypeScript
11 3 (1.94%) Embedded C++
11 3 (1.94%) Tcl
12 2 (1.29%) Embedded C
13 1 (0.65%) Go
13 1 (0.65%) PHP
13 1 (0.65%) PowerShell
Qualifications
1 54 (34.84%) Degree
2 15 (9.68%) Computer Science Degree
3 11 (7.10%) Master's Degree
3 11 (7.10%) Security Cleared
4 6 (3.87%) BPSS Clearance
4 6 (3.87%) Cisco Certification
4 6 (3.87%) CTC Cleared
5 5 (3.23%) CCNA
6 4 (2.58%) SC Cleared
7 2 (1.29%) EMC Certification
8 1 (0.65%) (ISC)2 CCSP
8 1 (0.65%) CEH
8 1 (0.65%) CISSP
8 1 (0.65%) CSSLP
8 1 (0.65%) ITIL Certification
8 1 (0.65%) MCP
8 1 (0.65%) Microsoft Certification
8 1 (0.65%) Numerate Degree
8 1 (0.65%) OSCP
Quality Assurance & Compliance
1 20 (12.90%) QA
2 14 (9.03%) Cyber Essentials
3 11 (7.10%) Data Quality
4 7 (4.52%) GDPR
5 6 (3.87%) COSHH
5 6 (3.87%) ISO 13485
6 5 (3.23%) ISO/IEC 27001
6 5 (3.23%) JTAG
7 4 (2.58%) IEC 61131
7 4 (2.58%) ISO 14001
7 4 (2.58%) ISO 9001
7 4 (2.58%) PMO
8 2 (1.29%) SLA
9 1 (0.65%) NIST
9 1 (0.65%) NIST 800
9 1 (0.65%) SOC 2
System Software
1 15 (9.68%) Hyper-V
2 13 (8.39%) Firmware
3 11 (7.10%) Active Directory
3 11 (7.10%) Virtual Machines
3 11 (7.10%) VMware Infrastructure
4 6 (3.87%) Docker
5 3 (1.94%) Embedded Firmware
6 1 (0.65%) Microsoft Virtual Server
6 1 (0.65%) Virtual Servers
6 1 (0.65%) VMware ESXi
Systems Management
1 14 (9.03%) FortiGate
2 4 (2.58%) Grafana
3 2 (1.29%) Autotask
4 1 (0.65%) Kubernetes
4 1 (0.65%) SCCM
Vendors
1 33 (21.29%) Microsoft
2 14 (9.03%) Cisco
2 14 (9.03%) Darktrace
2 14 (9.03%) HP
2 14 (9.03%) NEC
3 11 (7.10%) VMware
4 9 (5.81%) EMC
4 9 (5.81%) SAP
5 6 (3.87%) Mitel
5 6 (3.87%) Ribbon
6 4 (2.58%) HubSpot
7 3 (1.94%) Synopsys
8 2 (1.29%) Atmel
8 2 (1.29%) Freescale
9 1 (0.65%) Autodesk
9 1 (0.65%) CA
9 1 (0.65%) Ivanti
9 1 (0.65%) NCR
9 1 (0.65%) Renesas