Mentoring Jobs in the South East

Mentorship
England > South East

The table below provides summary statistics for permanent job vacancies advertised in the South East requiring Mentoring skills. It includes a benchmarking guide to the annual salaries offered in vacancies that cited Mentoring over the 6 months leading up to 26 April 2025, comparing them to the same period in the previous two years.

6 months to
26 Apr 2025
Same period 2024 Same period 2023
Rank 20 25 20
Rank change year-on-year +5 -5 +16
Permanent jobs citing Mentoring 680 1,169 1,523
As % of all permanent jobs advertised in the South East 8.20% 7.03% 10.06%
As % of the Processes & Methodologies category 9.02% 8.28% 10.65%
Number of salaries quoted 318 542 539
10th Percentile £37,574 £31,500 £38,500
25th Percentile £61,250 £42,500 £49,375
Median annual salary (50th Percentile) £62,000 £57,500 £67,500
Median % change year-on-year +7.83% -14.81% +12.50%
75th Percentile £72,375 £71,500 £80,000
90th Percentile £83,750 £85,000 £95,000
England median annual salary £65,000 £62,500 £70,000
% change year-on-year +4.00% -10.71% +7.69%

All Process and Methodology Skills
South East

Mentoring falls under the Processes and Methodologies category. For comparison with the information above, the following table provides summary statistics for all permanent job vacancies requiring process or methodology skills in the South East.

Permanent vacancies with a requirement for process or methodology skills 7,538 14,122 14,297
As % of all permanent jobs advertised in the South East 90.90% 84.88% 94.48%
Number of salaries quoted 4,079 9,946 8,294
10th Percentile £30,000 £27,500 £30,265
25th Percentile £41,250 £36,250 £41,250
Median annual salary (50th Percentile) £55,000 £50,000 £55,000
Median % change year-on-year +10.00% -9.09% -
75th Percentile £70,000 £65,000 £72,500
90th Percentile £80,200 £77,750 £86,250
England median annual salary £57,560 £55,000 £62,500
% change year-on-year +4.65% -12.00% +4.17%

Mentoring
Job Vacancy Trend in the South East

Job postings citing Mentoring as a proportion of all IT jobs advertised in the South East.
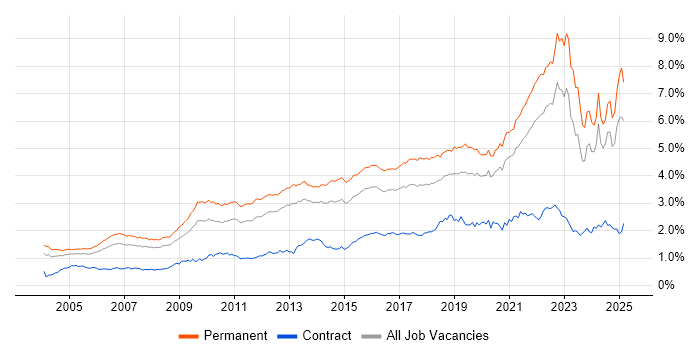
Job vacancy trend for Mentoring in the South East

Mentoring
Salary Trend in the South East

3-month moving average salary quoted in jobs citing Mentoring in the South East.

Salary trend for Mentoring in the South East

Mentoring
Salary Histogram in the South East

Salary distribution for jobs citing Mentoring in the South East over the 6 months to 26 April 2025.

Salary histogram for Mentoring in the South East

Mentoring
Job Locations in the South East

The table below looks at the demand and provides a guide to the median salaries quoted in IT jobs citing Mentoring within the South East region over the 6 months to 26 April 2025. The 'Rank Change' column provides an indication of the change in demand within each location based on the same 6 month period last year.

Location Rank Change
on Same Period
Last Year
Matching
Permanent
IT Job Ads
Median Salary
Past 6 Months
Median Salary
% Change
on Same Period
Last Year
Live
Jobs
Thames Valley -3 229 £64,000 +25.49% 194
Isle of Wight - 176 £62,000 - 15
Buckinghamshire -1 113 £66,634 +48.08% 44
Middlesex +13 112 - - 8
Berkshire -3 68 £57,500 +4.55% 116
Hampshire -20 61 £69,750 +7.31% 126
Surrey -11 59 £57,500 -4.17% 52
Oxfordshire +11 48 £57,500 +6.84% 63
Kent -11 17 £62,500 +46.20% 25
East Sussex +9 11 £37,500 -31.82% 30
West Sussex +3 8 £80,000 +24.03% 33
Sussex +17 1 - - 24
Mentoring
England

Mentoring
Co-occurring Skills and Capabilities in the South East by Category

The follow tables expand on the table above by listing co-occurrences grouped by category. The same employment type, locality and period is covered with up to 20 co-occurrences shown in each of the following categories:

Application Platforms
1 46 (6.76%) SharePoint
2 14 (2.06%) CMS
3 6 (0.88%) Apache
3 6 (0.88%) Microsoft Exchange
4 3 (0.44%) Confluence
5 2 (0.29%) ThingWorx
6 1 (0.15%) Headless CMS
6 1 (0.15%) IIS
6 1 (0.15%) Sitefinity
6 1 (0.15%) Strapi
6 1 (0.15%) Umbraco
Applications
1 24 (3.53%) Microsoft Office
2 13 (1.91%) Microsoft Excel
3 5 (0.74%) Trello
4 4 (0.59%) Adobe Creative Suite
4 4 (0.59%) Microsoft PowerPoint
5 2 (0.29%) MS Visio
5 2 (0.29%) Photoshop
5 2 (0.29%) Simulink
6 1 (0.15%) Adobe Illustrator
6 1 (0.15%) AutoCAD
6 1 (0.15%) InDesign
6 1 (0.15%) Microsoft Project
6 1 (0.15%) MicroStation
6 1 (0.15%) Mingle
Business Applications
1 7 (1.03%) Dynamics CRM
2 5 (0.74%) Oracle ERP
3 3 (0.44%) Salesforce CRM
4 2 (0.29%) PeopleSoft Financials
Cloud Services
1 132 (19.41%) Azure
2 57 (8.38%) Power Platform
3 32 (4.71%) PaaS
3 32 (4.71%) PowerApps
4 30 (4.41%) AWS
5 29 (4.26%) Azure DevOps
6 27 (3.97%) Microsoft 365
7 26 (3.82%) Power Automate
8 25 (3.68%) SaaS
9 13 (1.91%) GitHub
10 11 (1.62%) Azure Synapse Analytics
10 11 (1.62%) iPaaS
11 10 (1.47%) Entra ID
11 10 (1.47%) GitHub Actions
12 9 (1.32%) IBM Watson
13 8 (1.18%) Cloud Computing
13 8 (1.18%) GCP
14 7 (1.03%) Azure Logic Apps
14 7 (1.03%) Dynamics 365
14 7 (1.03%) Serverless
Communications & Networking
1 45 (6.62%) VPN
2 38 (5.59%) TCP/IP
3 29 (4.26%) Wireless
4 23 (3.38%) Wi-Fi
5 20 (2.94%) Firewall
6 19 (2.79%) 5G
6 19 (2.79%) Bluetooth
6 19 (2.79%) GSM
6 19 (2.79%) LTE
6 19 (2.79%) UMTS
7 8 (1.18%) IPsec
7 8 (1.18%) VLAN
8 7 (1.03%) WAN
9 6 (0.88%) VoIP
10 5 (0.74%) SD-WAN
11 4 (0.59%) BGP
11 4 (0.59%) Cisco ISE
11 4 (0.59%) Cisco Nexus
11 4 (0.59%) OSPF
11 4 (0.59%) VSAT
Database & Business Intelligence
1 52 (7.65%) Power BI
2 30 (4.41%) Tableau
3 29 (4.26%) Data Lake
4 26 (3.82%) Big Data
5 25 (3.68%) SQL Server
6 15 (2.21%) Data Warehouse
7 9 (1.32%) QlikView
8 8 (1.18%) Azure SQL Database
8 8 (1.18%) NoSQL
8 8 (1.18%) PostgreSQL
9 6 (0.88%) Microsoft Analysis Services
9 6 (0.88%) MongoDB
10 5 (0.74%) Relational Database
11 3 (0.44%) MySQL
12 2 (0.29%) Amazon RDS
12 2 (0.29%) DynamoDB
12 2 (0.29%) SQL Server Reporting Services
13 1 (0.15%) Amazon Redshift
13 1 (0.15%) BigQuery
13 1 (0.15%) Redis
Development Applications
1 146 (21.47%) Rational DOORS
2 34 (5.00%) Cucumber
2 34 (5.00%) Robot Framework
3 20 (2.94%) Git
4 11 (1.62%) JIRA
5 6 (0.88%) Eclipse
5 6 (0.88%) Maven
6 5 (0.74%) Eclipse RCP
6 5 (0.74%) GitLab
7 4 (0.59%) Jenkins
8 3 (0.44%) Cypress.io
9 2 (0.29%) Bitbucket
9 2 (0.29%) CMake
9 2 (0.29%) MSI
9 2 (0.29%) Subversion
9 2 (0.29%) Visual Studio
10 1 (0.15%) Burp Suite
10 1 (0.15%) Jasmine
10 1 (0.15%) Karma Test Runner
10 1 (0.15%) SpecFlow
General
1 258 (37.94%) Social Skills
2 145 (21.32%) Finance
3 130 (19.12%) Electronics
4 112 (16.47%) Inclusion and Diversity
5 70 (10.29%) Manufacturing
6 50 (7.35%) Telecoms
7 48 (7.06%) Legal
8 45 (6.62%) Analytical Skills
9 35 (5.15%) Law
10 30 (4.41%) Marketing
11 29 (4.26%) Retail
12 25 (3.68%) Presentation Skills
12 25 (3.68%) Public Sector
13 24 (3.53%) Organisational Skills
14 14 (2.06%) Automotive
15 12 (1.76%) Advertising
16 10 (1.47%) Aerospace
17 7 (1.03%) Banking
17 7 (1.03%) Financial Institution
17 7 (1.03%) Pharmaceutical
Job Titles
1 253 (37.21%) Senior
2 106 (15.59%) Architect
3 99 (14.56%) Systems Engineer
4 98 (14.41%) Senior Systems Engineer
5 67 (9.85%) Lead
5 67 (9.85%) Test Engineer
6 48 (7.06%) Systems Architect
7 35 (5.15%) Senior Manager
8 34 (5.00%) Test Automation Engineer
9 31 (4.56%) Engineering Manager
9 31 (4.56%) Software Engineer
10 24 (3.53%) Developer
11 23 (3.38%) Senior Architect
12 22 (3.24%) Analyst
13 20 (2.94%) Electronics Engineer
14 19 (2.79%) Electronics Test Engineer
15 18 (2.65%) IT Manager
16 17 (2.50%) Security Engineer
17 16 (2.35%) Security Manager
18 15 (2.21%) Senior Security Architect
Libraries, Frameworks & Software Standards
1 29 (4.26%) .NET
2 20 (2.94%) HTML
3 18 (2.65%) .NET Framework
3 18 (2.65%) CSS
4 17 (2.50%) Middleware
5 15 (2.21%) React
6 11 (1.62%) YAML
7 9 (1.32%) Kafka
7 9 (1.32%) REST
8 8 (1.18%) AngularJS
9 7 (1.03%) Spring Boot
10 5 (0.74%) JSP
10 5 (0.74%) SailPoint
10 5 (0.74%) Vue
11 4 (0.59%) Spring
12 3 (0.44%) .NET Core
12 3 (0.44%) 802.1X
12 3 (0.44%) GraphQL
13 2 (0.29%) Hugging Face
13 2 (0.29%) Node.js
Miscellaneous
1 109 (16.03%) Algorithms
2 105 (15.44%) Management Information System
3 38 (5.59%) Linux Command Line
4 26 (3.82%) Product Ownership
5 21 (3.09%) Driving Licence
5 21 (3.09%) Security Posture
5 21 (3.09%) Self-Motivation
6 18 (2.65%) Greenfield Project
7 15 (2.21%) Blockchain
8 13 (1.91%) Virtual Team
9 11 (1.62%) Data Structures
9 11 (1.62%) Robotics
10 10 (1.47%) Digital Media
10 10 (1.47%) e-Learning
10 10 (1.47%) Marketing Technology
11 9 (1.32%) Cloud Native
11 9 (1.32%) Data Protection Act
11 9 (1.32%) Hybrid Cloud
12 7 (1.03%) Data Centre
12 7 (1.03%) IoT
Operating Systems
1 81 (11.91%) Windows
2 66 (9.71%) Linux
3 15 (2.21%) Apple iOS
4 7 (1.03%) Android
4 7 (1.03%) Mac OS
5 6 (0.88%) Windows Server
6 4 (0.59%) VMS
7 2 (0.29%) Red Hat Enterprise Linux
8 1 (0.15%) Windows 10
8 1 (0.15%) Windows 7
8 1 (0.15%) Windows 8
Processes & Methodologies
1 239 (35.15%) Coaching
2 186 (27.35%) Agile
3 150 (22.06%) Systems Engineering
4 130 (19.12%) Technical Leadership
5 127 (18.68%) Problem-Solving
6 121 (17.79%) Stakeholder Engagement
7 110 (16.18%) Creative Thinking
8 109 (16.03%) DevOps
9 108 (15.88%) Project Management
10 97 (14.26%) Signal Processing
11 93 (13.68%) Continuous Improvement
12 88 (12.94%) Analytics
13 80 (11.76%) Computer Science
14 74 (10.88%) Customer Requirements
15 67 (9.85%) Stakeholder Management
16 66 (9.71%) Configuration Management
17 65 (9.56%) Test Automation
18 56 (8.24%) Data Analytics
18 56 (8.24%) Risk Management
19 55 (8.09%) Project Delivery
Programming Languages
1 110 (16.18%) R
2 94 (13.82%) Python
3 66 (9.71%) PowerShell
4 57 (8.38%) JavaScript
5 41 (6.03%) SQL
6 38 (5.59%) C#
7 35 (5.15%) Bash
8 25 (3.68%) Java
9 17 (2.50%) C++
10 15 (2.21%) C
11 9 (1.32%) TypeScript
12 8 (1.18%) Rust
13 7 (1.03%) Ruby
14 6 (0.88%) Data Analysis Expressions
15 5 (0.74%) Ada
15 5 (0.74%) Bicep
15 5 (0.74%) MATLAB
16 4 (0.59%) Go
17 3 (0.44%) Apex Code
17 3 (0.44%) Kusto Query Language
Qualifications
1 319 (46.91%) Degree
2 189 (27.79%) BPSS Clearance
3 72 (10.59%) Chartered Engineer
4 44 (6.47%) CISSP
5 41 (6.03%) Computer Science Degree
5 41 (6.03%) Security Cleared
6 23 (3.38%) Master's Degree
7 21 (3.09%) SC Cleared
8 20 (2.94%) CISM
8 20 (2.94%) HND
9 18 (2.65%) CRISC
10 15 (2.21%) Azure Certification
11 11 (1.62%) PMI Certification
12 10 (1.47%) DV Cleared
12 10 (1.47%) Microsoft Certification
12 10 (1.47%) PMP
13 9 (1.32%) Cisco Certification
14 7 (1.03%) CCNA
15 5 (0.74%) CCNP
15 5 (0.74%) PhD
Quality Assurance & Compliance
1 144 (21.18%) ISO/IEC 15288
2 80 (11.76%) QA
3 45 (6.62%) ISO/IEC 27001
4 42 (6.18%) Data Quality
5 14 (2.06%) NIST
6 13 (1.91%) GDPR
7 12 (1.76%) ISO/IEC 12207
7 12 (1.76%) SOC 2
8 11 (1.62%) NCSC
9 7 (1.03%) Cyber Essentials
9 7 (1.03%) Cyber Essentials PLUS
9 7 (1.03%) ISO/IEC 27002 (supersedes ISO/IEC 17799)
9 7 (1.03%) PMO
10 4 (0.59%) Accessibility
10 4 (0.59%) Sarbanes-Oxley
11 3 (0.44%) PMBOK
12 2 (0.29%) Def Stans
13 1 (0.15%) ISO 9001
13 1 (0.15%) SLA
13 1 (0.15%) WCAG
System Software
1 25 (3.68%) Active Directory
2 12 (1.76%) Docker
3 9 (1.32%) Virtual Desktop
4 8 (1.18%) Virtual Machines
5 7 (1.03%) VMware Infrastructure
6 5 (0.74%) Hyper-V
7 3 (0.44%) Firmware
8 2 (0.29%) Embedded Firmware
9 1 (0.15%) vSphere
Systems Management
1 15 (2.21%) Kubernetes
2 8 (1.18%) Microsoft Intune
3 7 (1.03%) Terraform
4 6 (0.88%) Ansible
5 5 (0.74%) CASB
5 5 (0.74%) Prometheus
6 3 (0.44%) Grafana
7 2 (0.29%) Active Directory Federation Services
7 2 (0.29%) Jamf Pro
7 2 (0.29%) Progress Chef
7 2 (0.29%) Puppet
7 2 (0.29%) WMI
8 1 (0.15%) Nessus
8 1 (0.15%) QRadar
8 1 (0.15%) SCCM
8 1 (0.15%) Single Sign-On
Vendors
1 161 (23.68%) IBM
2 140 (20.59%) Microsoft
3 32 (4.71%) ServiceNow
4 22 (3.24%) Databricks
5 11 (1.62%) Cisco
5 11 (1.62%) Salesforce
6 10 (1.47%) Oracle
6 10 (1.47%) VMware
7 9 (1.32%) Apple
8 8 (1.18%) Red Hat
9 7 (1.03%) Google
9 7 (1.03%) PeopleSoft
10 6 (0.88%) Adobe
10 6 (0.88%) Citrix
11 5 (0.74%) F5
11 5 (0.74%) Juniper
11 5 (0.74%) Okta
11 5 (0.74%) Palo Alto
11 5 (0.74%) Workday
12 4 (0.59%) SAP