Software Engineering Jobs in the South East

Software Engineering
England > South East

The following table provides summary statistics for permanent job vacancies advertised in the South East with a requirement for Software Engineering skills. Included is a benchmarking guide to the salaries offered in vacancies that have cited Software Engineering over the 6 months to 1 December 2023 with a comparison to the same period in the previous 2 years.

6 months to
1 Dec 2023
Same period 2022 Same period 2021
Rank 28 11 16
Rank change year-on-year -17 +5 +8
Permanent jobs citing Software Engineering 585 2,293 2,104
As % of all permanent jobs advertised in the South East 7.55% 13.17% 11.39%
As % of the Processes & Methodologies category 8.10% 13.85% 11.99%
Number of salaries quoted 391 1,310 1,262
10th Percentile £40,000 £37,500 £33,320
25th Percentile £47,500 £47,025 £42,500
Median annual salary (50th Percentile) £60,000 £60,000 £57,500
Median % change year-on-year - +4.35% +4.55%
75th Percentile £77,500 £77,500 £70,000
90th Percentile £92,500 £86,250 £87,500
England median annual salary £70,000 £70,000 £67,500
% change year-on-year - +3.70% +12.50%

All Process and Methodology Skills
South East

Software Engineering is in the Processes and Methodologies category. The following table is for comparison with the above and provides summary statistics for all permanent job vacancies advertised in the South East with a requirement for process or methodology skills.

Permanent vacancies with a requirement for process or methodology skills 7,222 16,558 17,546
As % of all permanent jobs advertised in the South East 93.16% 95.10% 94.99%
Number of salaries quoted 4,839 9,997 11,818
10th Percentile £30,500 £31,250 £31,250
25th Percentile £40,000 £41,750 £40,500
Median annual salary (50th Percentile) £54,500 £55,000 £52,500
Median % change year-on-year -0.91% +4.76% +5.00%
75th Percentile £67,500 £72,500 £67,500
90th Percentile £82,500 £85,000 £80,000
England median annual salary £60,000 £62,500 £60,000
% change year-on-year -4.00% +4.17% +9.09%

Software Engineering
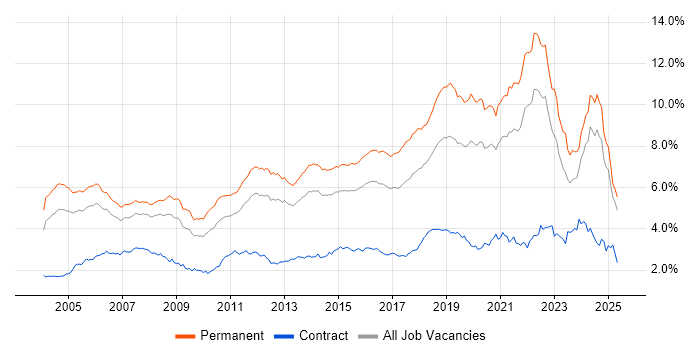
Job Vacancy Trend in the South East

Job postings citing Software Engineering as a proportion of all IT jobs advertised in the South East.

Job vacancy trend for Software Engineering in the South East

Software Engineering
Salary Trend in the South East

3-month moving average salary quoted in jobs citing Software Engineering in the South East.

Salary trend for Software Engineering in the South East

Software Engineering
Salary Histogram in the South East

Salary distribution for jobs citing Software Engineering in the South East over the 6 months to 1 December 2023.

Salary histogram for Software Engineering in the South East

Software Engineering
Job Locations in the South East

The table below looks at the demand and provides a guide to the median salaries quoted in IT jobs citing Software Engineering within the South East region over the 6 months to 1 December 2023. The 'Rank Change' column provides an indication of the change in demand within each location based on the same 6 month period last year.

Location Rank Change
on Same Period
Last Year
Matching
Permanent
IT Job Ads
Median Salary
Past 6 Months
Median Salary
% Change
on Same Period
Last Year
Live
Jobs
Thames Valley -18 271 £65,000 +4.00% 140
Berkshire -22 151 £67,500 -3.57% 52
Hampshire -11 146 £55,000 -8.33% 89
Surrey -12 83 £60,000 +4.35% 48
Oxfordshire -10 61 £66,250 +32.50% 52
Buckinghamshire -7 59 £55,000 -20.00% 36
West Sussex +2 43 £72,500 +38.10% 14
Kent -12 30 £54,500 -12.80% 15
East Sussex -40 12 £70,000 -3.45% 9
Isle of Wight +5 3 £53,500 -
Middlesex -2 1 £85,000 -10.53% 1
Software Engineering
England

Software Engineering
Co-occurring Skills and Capabilities in the South East by Category

The follow tables expand on the table above by listing co-occurrences grouped by category. The same employment type, locality and period is covered with up to 20 co-occurrences shown in each of the following categories:

Application Platforms
1 15 (2.56%) Apache
2 8 (1.37%) JBoss
3 7 (1.20%) IIS
3 7 (1.20%) MS Exchange
3 7 (1.20%) WebSphere
4 6 (1.03%) Confluence
4 6 (1.03%) Red Hat Fuse
4 6 (1.03%) SharePoint
5 5 (0.85%) CMS
5 5 (0.85%) Tomcat
6 3 (0.51%) Adobe Experience Manager
6 3 (0.51%) Apache Solr
7 2 (0.34%) Apache Airflow
7 2 (0.34%) WordPress
8 1 (0.17%) Apache Spark
8 1 (0.17%) Jupyter
8 1 (0.17%) Luigi
8 1 (0.17%) nginx
8 1 (0.17%) OpenStack
Applications
1 13 (2.22%) Simulink
2 9 (1.54%) Windchill
3 8 (1.37%) AutoCAD
3 8 (1.37%) PTC Creo
4 7 (1.20%) SOLIDWORKS
5 1 (0.17%) Mathcad
5 1 (0.17%) Stateflow
Business Applications
1 2 (0.34%) Siebel CRM
1 2 (0.34%) SystmOne
1 2 (0.34%) Temenos T24
2 1 (0.17%) NetSuite
2 1 (0.17%) Sparx Enterprise Architect
Cloud Services
1 91 (15.56%) Azure
2 84 (14.36%) AWS
3 52 (8.89%) Serverless
4 43 (7.35%) SaaS
5 32 (5.47%) GCP
6 26 (4.44%) GitHub
7 25 (4.27%) Azure DevOps
8 23 (3.93%) PaaS
9 19 (3.25%) AWS Lambda
10 13 (2.22%) IaaS
11 10 (1.71%) Cloud Computing
12 8 (1.37%) GitHub Actions
13 7 (1.20%) Amazon Kinesis
13 7 (1.20%) Amazon S3
13 7 (1.20%) AWS IoT
13 7 (1.20%) Azure AKS
13 7 (1.20%) Entra ID
13 7 (1.20%) Power Platform
14 6 (1.03%) Dynamics 365
14 6 (1.03%) PowerApps
Communications & Networking
1 47 (8.03%) TCP/IP
2 29 (4.96%) HTTP
3 10 (1.71%) Internet
4 8 (1.37%) Ethernet
4 8 (1.37%) Wireshark
5 7 (1.20%) Wireless
6 6 (1.03%) Firewall
7 4 (0.68%) 5G
7 4 (0.68%) RFID
8 3 (0.51%) 3GPP
8 3 (0.51%) 5G NR
8 3 (0.51%) ATM
8 3 (0.51%) LTE
8 3 (0.51%) MIMO
8 3 (0.51%) SpaceWire
9 2 (0.34%) Link 16
9 2 (0.34%) Software-Defined Networking
9 2 (0.34%) Tactical Data Link
10 1 (0.17%) J1939
10 1 (0.17%) Software-Defined Radio
Database & Business Intelligence
1 43 (7.35%) SQL Server
2 41 (7.01%) MySQL
3 28 (4.79%) NoSQL
4 18 (3.08%) MongoDB
5 17 (2.91%) Relational Database
6 16 (2.74%) PostgreSQL
7 9 (1.54%) Oracle Database
7 9 (1.54%) SQLite
8 8 (1.37%) Big Data
9 7 (1.20%) SAP HANA
10 6 (1.03%) DynamoDB
10 6 (1.03%) EDRMS
10 6 (1.03%) RDBMS
11 5 (0.85%) Amazon Redshift
12 3 (0.51%) Amazon RDS
12 3 (0.51%) Elasticsearch
12 3 (0.51%) Jackrabbit
13 2 (0.34%) Apache Hive
13 2 (0.34%) Redis
13 2 (0.34%) SQL Server Integration Services
Development Applications
1 109 (18.63%) Git
2 35 (5.98%) Jenkins
3 27 (4.62%) Subversion
4 21 (3.59%) Selenium
5 20 (3.42%) Cypress.io
5 20 (3.42%) JIRA
6 18 (3.08%) SoapUI
7 11 (1.88%) CMake
8 8 (1.37%) AutoIt
8 8 (1.37%) eggPlant
9 7 (1.20%) Chocolatey
10 6 (1.03%) GitLab
10 6 (1.03%) IntelliJ
11 3 (0.51%) Ant
11 3 (0.51%) Gradle
11 3 (0.51%) Visual Studio
11 3 (0.51%) VSS/SourceSafe
12 2 (0.34%) Cucumber
12 2 (0.34%) GDB
12 2 (0.34%) Hudson
General
1 95 (16.24%) Social Skills
2 66 (11.28%) Finance
3 63 (10.77%) Electronics
4 41 (7.01%) Inclusion and Diversity
5 34 (5.81%) Analytical Skills
6 29 (4.96%) Aerospace
7 24 (4.10%) Public Sector
8 22 (3.76%) Marketing
9 21 (3.59%) Automotive
10 17 (2.91%) Telecoms
11 13 (2.22%) Manufacturing
11 13 (2.22%) Military
11 13 (2.22%) Police
12 9 (1.54%) Aviation
13 7 (1.20%) Back Office
14 6 (1.03%) Banking
14 6 (1.03%) Billing
14 6 (1.03%) Tech for Good
15 5 (0.85%) Games
16 4 (0.68%) Advertising
Job Titles
1 305 (52.14%) Software Engineer
2 116 (19.83%) Senior
3 83 (14.19%) Developer
4 82 (14.02%) Senior Software Engineer
5 53 (9.06%) Embedded Engineer
6 50 (8.55%) Embedded Software Engineer
7 44 (7.52%) C++ Software Engineer
8 42 (7.18%) Lead
9 38 (6.50%) Java Engineer
10 37 (6.32%) Java Software Engineer
11 31 (5.30%) Architect
12 29 (4.96%) Graduate
13 28 (4.79%) Junior
14 26 (4.44%) Solutions Architect
15 24 (4.10%) Junior Software Engineer
16 22 (3.76%) Software Manager
17 20 (3.42%) C# Software Engineer
17 20 (3.42%) Development Manager
17 20 (3.42%) Graduate Software Engineer
17 20 (3.42%) Senior Developer
Libraries, Frameworks & Software Standards
1 116 (19.83%) .NET
2 100 (17.09%) React
3 52 (8.89%) HTML
4 46 (7.86%) AngularJS
4 46 (7.86%) ASP.NET
5 41 (7.01%) CSS
6 35 (5.98%) XML
7 34 (5.81%) Spring
8 32 (5.47%) Node.js
8 32 (5.47%) REST
9 30 (5.13%) .NET Core
10 29 (4.96%) Protocol Buffers
11 27 (4.62%) Vue
12 26 (4.44%) Middleware
12 26 (4.44%) Web Services
13 25 (4.27%) JSON
14 22 (3.76%) .NET Framework
15 20 (3.42%) ASP.NET Web API
16 19 (3.25%) Entity Framework
17 17 (2.91%) Jest
Miscellaneous
1 41 (7.01%) Algorithms
2 29 (4.96%) Embedded Systems
3 25 (4.27%) Self-Motivation
4 24 (4.10%) Greenfield Project
4 24 (4.10%) IoT
5 17 (2.91%) Product Ownership
6 15 (2.56%) Raspberry Pi
7 10 (1.71%) Device Driver
7 10 (1.71%) FPGA
7 10 (1.71%) Public Cloud
8 9 (1.54%) Cloud Native
8 9 (1.54%) Satnav
9 8 (1.37%) Arduino
9 8 (1.37%) Data Structures
9 8 (1.37%) Enterprise Software
9 8 (1.37%) VHDL
9 8 (1.37%) Virtual Team
10 7 (1.20%) Distributed Systems
10 7 (1.20%) Operational Technology
11 6 (1.03%) Linux Command Line
Operating Systems
1 130 (22.22%) Linux
2 55 (9.40%) Windows
3 11 (1.88%) Embedded Linux
4 8 (1.37%) Windows Server
5 7 (1.20%) Windows Server 2012
6 4 (0.68%) Android
6 4 (0.68%) VxWorks
7 3 (0.51%) Apple iOS
7 3 (0.51%) Mac OS
8 2 (0.34%) Unix
9 1 (0.17%) Windows Server 2019
Processes & Methodologies
1 191 (32.65%) Agile
2 142 (24.27%) Problem-Solving
3 98 (16.75%) Computer Science
4 96 (16.41%) DevOps
5 87 (14.87%) Mentoring
6 71 (12.14%) Actionable Insight
6 71 (12.14%) Microservices
7 68 (11.62%) CI/CD
7 68 (11.62%) Unit Testing
8 54 (9.23%) Mathematics
9 51 (8.72%) Containerisation
9 51 (8.72%) Software Testing
10 48 (8.21%) Continuous Improvement
10 48 (8.21%) TDD
10 48 (8.21%) Test Automation
11 47 (8.03%) Coaching
12 46 (7.86%) Design Patterns
13 45 (7.69%) Continuous Integration
13 45 (7.69%) SDLC
14 41 (7.01%) Scrum
Programming Languages
1 153 (26.15%) C#
2 146 (24.96%) Python
3 144 (24.62%) C++
4 142 (24.27%) JavaScript
5 135 (23.08%) C
6 127 (21.71%) Java
7 79 (13.50%) SQL
8 58 (9.91%) TypeScript
9 35 (5.98%) PHP
10 23 (3.93%) PowerShell
11 22 (3.76%) Bash
12 21 (3.59%) Ruby
13 20 (3.42%) Go
14 16 (2.74%) MATLAB
15 13 (2.22%) Ada
16 10 (1.71%) Bicep
16 10 (1.71%) Perl
17 7 (1.20%) Delphi
17 7 (1.20%) T-SQL
18 6 (1.03%) Shell Script
Qualifications
1 196 (33.50%) Degree
2 113 (19.32%) Security Cleared
3 88 (15.04%) SC Cleared
4 54 (9.23%) Computer Science Degree
5 23 (3.93%) Master's Degree
6 15 (2.56%) DV Cleared
6 15 (2.56%) PhD
7 10 (1.71%) Microsoft Certification
8 9 (1.54%) DBS Check
9 7 (1.20%) AWS Certification
9 7 (1.20%) AWS Certified Solutions Architect
9 7 (1.20%) Azure Certification
9 7 (1.20%) MCSA
9 7 (1.20%) MCSE
10 3 (0.51%) BPSS Clearance
11 2 (0.34%) Numerate Degree
12 1 (0.17%) CompTIA Security+
12 1 (0.17%) MCAD
12 1 (0.17%) Postgraduate
Quality Assurance & Compliance
1 44 (7.52%) QA
2 9 (1.54%) Software Quality Assurance
3 5 (0.85%) Automotive SPICE
3 5 (0.85%) ISO 26262
4 2 (0.34%) Accessibility
4 2 (0.34%) Data Quality
4 2 (0.34%) MISRA
5 1 (0.17%) DICOM
5 1 (0.17%) ECSS
5 1 (0.17%) HAZOP
5 1 (0.17%) HL7
5 1 (0.17%) IEC 61508
5 1 (0.17%) PMO
System Software
1 75 (12.82%) Docker
2 14 (2.39%) Firmware
3 8 (1.37%) Active Directory
4 5 (0.85%) Embedded Firmware
5 3 (0.51%) Virtual Machines
6 2 (0.34%) Hyper-V
6 2 (0.34%) Virtual Servers
7 1 (0.17%) Kamailio
7 1 (0.17%) Microsoft Virtual Server
7 1 (0.17%) VMware Infrastructure
Systems Management
1 66 (11.28%) Kubernetes
2 32 (5.47%) Terraform
3 16 (2.74%) Ansible
4 7 (1.20%) Active Directory Federation Services
4 7 (1.20%) SCCM
4 7 (1.20%) SCOM
5 2 (0.34%) Prometheus
6 1 (0.17%) Docker Swarm
6 1 (0.17%) Grafana
6 1 (0.17%) HP ALM
6 1 (0.17%) Mesos
6 1 (0.17%) Nessus
6 1 (0.17%) Oozie
6 1 (0.17%) Progress Chef
6 1 (0.17%) Puppet
Vendors
1 49 (8.38%) Microsoft
2 21 (3.59%) SAP
3 20 (3.42%) Oracle
4 15 (2.56%) Xamarin
5 9 (1.54%) Google
6 8 (1.37%) PTC
7 7 (1.20%) IBM
7 7 (1.20%) MathWorks
7 7 (1.20%) Red Hat
7 7 (1.20%) TOWER Software
8 4 (0.68%) Foundry
9 3 (0.51%) Adobe
9 3 (0.51%) Atlassian
9 3 (0.51%) CA Agile Central
10 2 (0.34%) Axosoft
10 2 (0.34%) Siebel
10 2 (0.34%) Temenos
11 1 (0.17%) HP
11 1 (0.17%) Intel
11 1 (0.17%) Sun