Performance Optimisation Contract Job Trends in the City of London

Performance Optimisation
Central London > City of London

The table below provides summary statistics and contractor rates for jobs advertised in the City of London requiring Performance Optimisation skills. It covers contract job vacancies from the 6 months leading up to 23 November 2025, with comparisons to the same periods in the previous two years.

6 months to
23 Nov 2025
Same period 2024 Same period 2023
Rank 95 103 127
Rank change year-on-year +8 +24 +45
Contract jobs citing Performance Optimisation 30 25 14
As % of all contract jobs in the City of London 1.68% 1.16% 0.51%
As % of the Processes & Methodologies category 1.81% 1.27% 0.57%
Number of daily rates quoted 19 11 11
10th Percentile £404 £613 £331
25th Percentile £466 £644 £394
Median daily rate (50th Percentile) £550 £700 £575
Median % change year-on-year -21.43% +21.74% +21.05%
75th Percentile £669 £825 £669
90th Percentile £780 £900 -
Central London median daily rate £550 £693 £580
% change year-on-year -20.63% +19.48% +16.00%

All Process and Methodology Skills
City of London

Performance Optimisation falls under the Processes and Methodologies category. For comparison with the information above, the following table provides summary statistics for all contract job vacancies requiring process or methodology skills in the City of London.

Contract vacancies with a requirement for process or methodology skills 1,662 1,973 2,445
As % of all contract IT jobs advertised in the City of London 93.01% 91.68% 89.79%
Number of daily rates quoted 1,165 1,206 1,724
10th Percentile £334 £379 £363
25th Percentile £418 £475 £463
Median daily rate (50th Percentile) £550 £583 £575
Median % change year-on-year -5.58% +1.30% -
75th Percentile £675 £688 £690
90th Percentile £756 £788 £800
Central London median daily rate £550 £575 £575
% change year-on-year -4.35% - -
Number of hourly rates quoted 20 17 14
10th Percentile £17.02 £16.70 £17.00
25th Percentile £20.18 £22.00 £17.48
Median hourly rate £28.25 £42.50 £32.75
Median % change year-on-year -33.53% +29.77% -36.41%
75th Percentile £43.33 £112.00 £52.88
90th Percentile £63.75 £137.50 £72.25
Central London median hourly rate £27.75 £35.00 £27.50
% change year-on-year -20.71% +27.27% -45.54%

Performance Optimisation
Job Vacancy Trend in the City of London

Historical trend showing the proportion of contract IT job postings citing Performance Optimisation relative to all contract IT jobs advertised in the City of London.
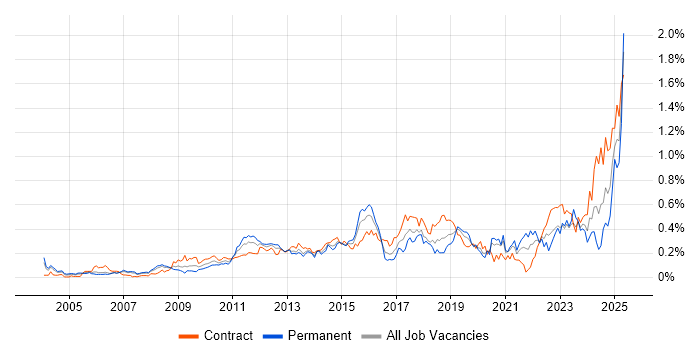
Performance Optimisation job vacancy trend in the City of London

Performance Optimisation
Daily Rate Trend in the City of London

Contractor daily rate distribution trend for jobs in the City of London citing Performance Optimisation.

Contractor daily rate distribution trend for jobs in the City of London citing Performance Optimisation

Performance Optimisation
Daily Rate Histogram in the City of London

Daily rate distribution for jobs citing Performance Optimisation in the City of London over the 6 months to 23 November 2025.

Daily rate histogram for Performance Optimisation in the City of London

Performance Optimisation
Hourly Rate Trend in the City of London

Contractor hourly rate distribution trend for jobs in the City of London citing Performance Optimisation.

Contractor hourly rate distribution trend for jobs in the City of London citing Performance Optimisation

Performance Optimisation
Co-Occurring Skills & Capabilities in the City of London by Category

The following tables expand on the one above by listing co-occurrences grouped by category. They cover the same employment type, locality and period, with up to 20 co-occurrences shown in each category:

Application Platforms
1 3 (10.00%) SharePoint
2 2 (6.67%) Apache
2 2 (6.67%) Apache Airflow
2 2 (6.67%) Apache Spark
3 1 (3.33%) Camunda
3 1 (3.33%) Confluence
Applications
1 3 (10.00%) Microsoft Excel
2 2 (6.67%) Microsoft Office
2 2 (6.67%) Microsoft PowerPoint
Business Applications
1 1 (3.33%) Aladdin
1 1 (3.33%) Fidessa
1 1 (3.33%) thinkFolio
1 1 (3.33%) Workday HCM
Cloud Services
1 10 (33.33%) Azure
2 6 (20.00%) AWS
3 3 (10.00%) Amazon S3
3 3 (10.00%) Azure DevOps
3 3 (10.00%) GCP
3 3 (10.00%) GitHub
3 3 (10.00%) Serverless
4 2 (6.67%) Amazon CloudWatch
4 2 (6.67%) Amazon Cognito
4 2 (6.67%) Amazon EventBridge
4 2 (6.67%) Amazon SQS
4 2 (6.67%) AWS Lambda
4 2 (6.67%) AWS Step Functions
4 2 (6.67%) Azure Data Factory
4 2 (6.67%) Datadog
4 2 (6.67%) GitHub Actions
4 2 (6.67%) Power Platform
5 1 (3.33%) Azure Logic Apps
5 1 (3.33%) Azure Machine Learning
5 1 (3.33%) Azure Synapse Analytics
Communications & Networking
1 1 (3.33%) BGP
1 1 (3.33%) Firewall
1 1 (3.33%) Internet
1 1 (3.33%) MPLS
1 1 (3.33%) SD-WAN
1 1 (3.33%) VPN
1 1 (3.33%) WAN
Database & Business Intelligence
1 3 (10.00%) Data Warehouse
1 3 (10.00%) Oracle Database
1 3 (10.00%) Relational Database
2 2 (6.67%) Delta Lake
2 2 (6.67%) DynamoDB
2 2 (6.67%) OLAP
2 2 (6.67%) PostgreSQL
2 2 (6.67%) Power BI
2 2 (6.67%) RDBMS
2 2 (6.67%) SQL Server
2 2 (6.67%) SQLPlus
3 1 (3.33%) Data Lake
3 1 (3.33%) Hadoop
3 1 (3.33%) Metadata
3 1 (3.33%) Microsoft Analysis Services
3 1 (3.33%) MongoDB
3 1 (3.33%) Oracle Database 11g
3 1 (3.33%) Oracle OLAP
3 1 (3.33%) SQL Server Analysis Services
3 1 (3.33%) SQL Server Integration Services
Development Applications
1 6 (20.00%) Git
2 2 (6.67%) Bitbucket
2 2 (6.67%) Gradle
2 2 (6.67%) Toad
3 1 (3.33%) Artifactory
3 1 (3.33%) Cypress.io
3 1 (3.33%) gulp
3 1 (3.33%) JIRA
3 1 (3.33%) JUnit
3 1 (3.33%) Mockito
3 1 (3.33%) Visual Studio Code
3 1 (3.33%) webpack
General
1 12 (40.00%) Finance
2 8 (26.67%) Social Skills
3 4 (13.33%) Banking
4 3 (10.00%) Analytical Skills
5 2 (6.67%) Financial Institution
5 2 (6.67%) Games
5 2 (6.67%) Investment Banking
6 1 (3.33%) Documentation Skills
6 1 (3.33%) Public Sector
Job Titles
1 12 (40.00%) Developer
2 4 (13.33%) Architect
2 4 (13.33%) Data Engineer
2 4 (13.33%) Java Developer
2 4 (13.33%) Senior
2 4 (13.33%) Software Engineer
3 3 (10.00%) Full-Stack Developer
3 3 (10.00%) Oracle Developer
4 2 (6.67%) Analyst
4 2 (6.67%) Consultant
4 2 (6.67%) Software Design Engineer
4 2 (6.67%) Technical Architect
5 1 (3.33%) .NET Technical Architect
5 1 (3.33%) FoxPro Developer
5 1 (3.33%) HR Data Analyst
5 1 (3.33%) Linux Engineer
5 1 (3.33%) Microsoft Developer
5 1 (3.33%) Oracle Data Warehouse Developer
5 1 (3.33%) SharePoint Developer
5 1 (3.33%) Technical Leader
Libraries, Frameworks & Software Standards
1 6 (20.00%) REST
2 4 (13.33%) .NET
2 4 (13.33%) AngularJS
3 3 (10.00%) GraphQL
3 3 (10.00%) OpenTelemetry
3 3 (10.00%) React
3 3 (10.00%) Spring
4 2 (6.67%) CSS
4 2 (6.67%) HTML
4 2 (6.67%) LangChain
4 2 (6.67%) Node.js
4 2 (6.67%) RESTful
4 2 (6.67%) Spring Boot
4 2 (6.67%) Unity (Game Engine)
4 2 (6.67%) WebSockets
5 1 (3.33%) HTML5
5 1 (3.33%) Kafka
5 1 (3.33%) RabbitMQ
5 1 (3.33%) Sass
5 1 (3.33%) SOAP
Miscellaneous
1 3 (10.00%) Distributed Systems
2 2 (6.67%) 3D Graphics
2 2 (6.67%) Cloud Native
2 2 (6.67%) Data Centre
2 2 (6.67%) Derivative
2 2 (6.67%) Fixed Income
2 2 (6.67%) Foreign Exchange (FX)
2 2 (6.67%) Product Ownership
2 2 (6.67%) Virtual Reality
3 1 (3.33%) Credit Risk
3 1 (3.33%) Data Structures
3 1 (3.33%) Fat Client
3 1 (3.33%) Greenfield Project
3 1 (3.33%) Hybrid Cloud
3 1 (3.33%) IoT
3 1 (3.33%) Mobile App
3 1 (3.33%) Onboarding
3 1 (3.33%) Public Cloud
3 1 (3.33%) Thin Client
3 1 (3.33%) Virtual Team
Operating Systems
1 3 (10.00%) Linux
1 3 (10.00%) Unix
2 2 (6.67%) Windows
Processes & Methodologies
1 14 (46.67%) CI/CD
2 9 (30.00%) DevOps
3 7 (23.33%) Software Engineering
4 6 (20.00%) Agile
4 6 (20.00%) Analytics
4 6 (20.00%) ETL
5 5 (16.67%) Data Modelling
5 5 (16.67%) Problem-Solving
6 4 (13.33%) Business Intelligence
6 4 (13.33%) Data Pipeline
6 4 (13.33%) Event-Driven
6 4 (13.33%) Event-Driven Architecture
6 4 (13.33%) Infrastructure as Code
6 4 (13.33%) Migration
6 4 (13.33%) Performance Tuning
6 4 (13.33%) Technical Leadership
7 3 (10.00%) Computer Science
7 3 (10.00%) Data Migration
7 3 (10.00%) Full-Stack Development
7 3 (10.00%) Workflow
Programming Languages
1 11 (36.67%) Python
1 11 (36.67%) SQL
2 5 (16.67%) Java
2 5 (16.67%) JavaScript
2 5 (16.67%) PHP
2 5 (16.67%) PL/SQL
3 4 (13.33%) C#
4 3 (10.00%) C++
5 2 (6.67%) Perl
5 2 (6.67%) Shell Script
6 1 (3.33%) Apex Code
6 1 (3.33%) Bash
6 1 (3.33%) CodeQL
6 1 (3.33%) FoxPro (VFP)
6 1 (3.33%) Go
6 1 (3.33%) PromQL
6 1 (3.33%) Ruby
6 1 (3.33%) Scala
6 1 (3.33%) T-SQL
6 1 (3.33%) TypeScript
Qualifications
1 2 (6.67%) Computer Science Degree
1 2 (6.67%) Degree
1 2 (6.67%) SC Cleared
1 2 (6.67%) Security Cleared
2 1 (3.33%) BPSS Clearance
2 1 (3.33%) SnowPro
2 1 (3.33%) VCAP
2 1 (3.33%) VMware Certified Professional (VCP)
Quality Assurance & Compliance
1 3 (10.00%) Data Quality
2 1 (3.33%) Accessibility
2 1 (3.33%) Actionable Recommendations
2 1 (3.33%) GDPR
2 1 (3.33%) MiFID
2 1 (3.33%) WCAG
System Software
1 2 (6.67%) Docker
2 1 (3.33%) VMware Infrastructure
2 1 (3.33%) vSphere
Systems Management
1 2 (6.67%) Kubernetes
1 2 (6.67%) Prometheus
1 2 (6.67%) Terraform
2 1 (3.33%) Ansible
2 1 (3.33%) CASB
2 1 (3.33%) Grafana
2 1 (3.33%) Podman
2 1 (3.33%) PowerCLI
Vendors
1 6 (20.00%) Microsoft
2 5 (16.67%) Oracle
3 3 (10.00%) Databricks
4 2 (6.67%) Google
4 2 (6.67%) Workday
5 1 (3.33%) Cisco
5 1 (3.33%) ION Trading
5 1 (3.33%) MuleSoft
5 1 (3.33%) Palo Alto
5 1 (3.33%) Portware
5 1 (3.33%) Pure Storage
5 1 (3.33%) Salesforce
5 1 (3.33%) VMware