Azure Engineer Contracts with Hybrid/Remote/WFH Options

Microsoft Azure Engineer
UK > Work from Home

The median Microsoft Azure Engineer daily rate for remote or hybrid work is £471, according to job vacancies posted in the 6 months leading up to 25 June 2025.

The table below provides contractor rate benchmarking and summary statistics, comparing them to the same period in the previous two years.

6 months to
25 Jun 2025
Same period 2024 Same period 2023
Rank 169 163 126
Rank change year-on-year -6 -37 +13
Contract jobs requiring an Azure Engineer 141 201 458
As % of all contract jobs with a WFH option 1.44% 1.37% 1.93%
As % of the Job Titles category 1.53% 1.46% 2.02%
Number of daily rates quoted 122 157 375
10th Percentile £375 £413 £413
25th Percentile £403 £463 £475
Median daily rate (50th Percentile) £471 £525 £550
Median % change year-on-year -10.33% -4.55% -
75th Percentile £547 £608 £650
90th Percentile £603 £646 £700
UK median daily rate £478 £550 £550
% change year-on-year -13.18% - -
Number of hourly rates quoted 1 0 1
10th Percentile - - -
25th Percentile £67.50 - £70.50
Median hourly rate £70.00 - £71.00
75th Percentile £72.50 - £71.50
90th Percentile - - -
UK median hourly rate £70.00 £110.00 £71.00
% change year-on-year -36.36% +54.93% -9.84%

All Contract IT Job Vacancies
Work from Home

For comparison with the information above, the following table provides summary statistics for all contract IT job vacancies with WFH or hybrid options. Most job vacancies include a discernible job title that can be normalized. As such, the figures in the second row provide an indication of the number of contract jobs in our overall sample.

Contract vacancies in Work from Home with a recognized job title 9,217 13,781 22,627
% of contract IT jobs with a recognized job title 93.95% 93.62% 95.12%
Number of daily rates quoted 6,196 9,292 16,031
10th Percentile £325 £325 £356
25th Percentile £413 £425 £440
Median daily rate (50th Percentile) £513 £525 £538
Median % change year-on-year -2.38% -2.33% +2.38%
75th Percentile £638 £631 £650
90th Percentile £763 £750 £750
UK median daily rate £500 £525 £538
% change year-on-year -4.76% -2.33% +1.42%
Number of hourly rates quoted 245 553 533
10th Percentile £13.91 £14.27 £16.98
25th Percentile £16.00 £22.50 £24.73
Median hourly rate £34.48 £43.00 £50.00
Median % change year-on-year -19.81% -14.00% +25.00%
75th Percentile £65.25 £65.00 £66.00
90th Percentile £75.00 £75.00 £75.00
UK median hourly rate £27.13 £37.50 £43.00
% change year-on-year -27.67% -12.79% +68.63%

Azure Engineer
Trend for Jobs with a WFH Option

Job vacancies with remote working options which featured Azure Engineer in the job title as a proportion of all IT jobs advertised.
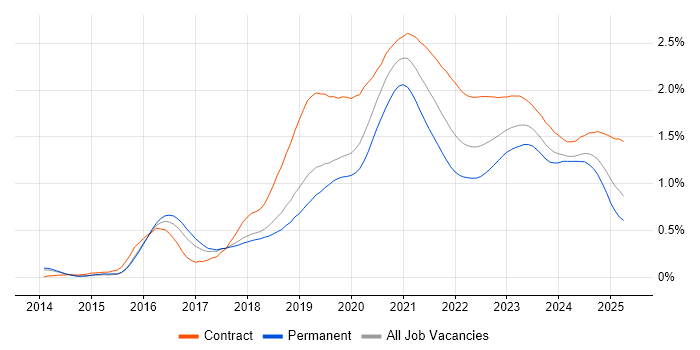
Azure Engineer trend for jobs with Hybrid/Remote/WFH options

Azure Engineer
Daily Rate Trend for Jobs with a WFH Option

3-month moving average daily rate quoted in job vacancies with remote working options citing Azure Engineer.

Azure Engineer daily rate for jobs with a WFH option

Azure Engineer
Daily Rate Histogram for Jobs with a WFH Option

Daily rate distribution for jobs with remote working options citing Azure Engineer over the 6 months to 25 June 2025.

Azure Engineer daily rate histogram for jobs with a WFH option

Azure Engineer
Hourly Rate Trend for Jobs with a WFH Option

3-month moving average hourly rate quoted in job vacancies with remote working options citing Azure Engineer.

Azure Engineer hourly rate for jobs with a WFH option

Azure Engineer Skill Set
Top 30 Co-occurring Skills and Capabilities in Job Vacancies with WFH Options

For the 6 months to 25 June 2025, Azure Engineer contract job roles required the following skills and capabilities in order of popularity. The figures indicate the absolute number co-occurrences and as a proportion of all contract jobs with a WFH option featuring Azure Engineer in the job title.

1 141 (100.00%) Azure
2 68 (48.23%) DevOps
3 54 (38.30%) Terraform
4 52 (36.88%) Azure DevOps
5 43 (30.50%) CI/CD
6 42 (29.79%) Security Cleared
7 41 (29.08%) Infrastructure as Code
8 40 (28.37%) SQL
8 40 (28.37%) Microsoft
9 39 (27.66%) SC Cleared
10 38 (26.95%) PowerShell
11 37 (26.24%) Python
12 30 (21.28%) Databricks
13 27 (19.15%) Windows
13 27 (19.15%) Migration
14 26 (18.44%) Azure Data Factory
14 26 (18.44%) Azure Synapse Analytics
15 24 (17.02%) Social Skills
15 24 (17.02%) Data Engineering
15 24 (17.02%) Agile
15 24 (17.02%) Kubernetes
16 22 (15.60%) Power Platform
17 21 (14.89%) Containerisation
17 21 (14.89%) ETL
17 21 (14.89%) Firewall
18 20 (14.18%) DNS
18 20 (14.18%) Analytics
19 19 (13.48%) Bash
19 19 (13.48%) Power BI
20 18 (12.77%) Azure Monitor

Azure Engineer Skill Set
Co-occurring Skills and Capabilities with WFH Options by Category

The follow tables expand on the table above by listing co-occurrences grouped by category. The same employment type, locality and period is covered with up to 20 co-occurrences shown in each of the following categories:

Application Platforms
1 6 (4.26%) SharePoint
2 4 (2.84%) Confluence
3 2 (1.42%) ArcGIS
3 2 (1.42%) Microsoft Exchange
4 1 (0.71%) Apache Spark
4 1 (0.71%) Drupal
Business Applications
1 1 (0.71%) Dynamics AX
1 1 (0.71%) Dynamics CRM
Cloud Services
1 141 (100.00%) Azure
2 52 (36.88%) Azure DevOps
3 26 (18.44%) Azure Data Factory
3 26 (18.44%) Azure Synapse Analytics
4 22 (15.60%) Power Platform
5 18 (12.77%) Azure Monitor
6 17 (12.06%) GitHub
7 16 (11.35%) Entra ID
8 15 (10.64%) Azure AKS
9 13 (9.22%) Azure Sentinel
10 11 (7.80%) AWS
10 11 (7.80%) Microsoft 365
10 11 (7.80%) Microsoft Purview
11 9 (6.38%) Azure ExpressRoute
12 8 (5.67%) GitHub Actions
13 7 (4.96%) IaaS
14 6 (4.26%) AWS CloudFormation
14 6 (4.26%) Azure Key Vault
14 6 (4.26%) Azure Storage
14 6 (4.26%) Dynamics 365
Communications & Networking
1 21 (14.89%) Firewall
2 20 (14.18%) DNS
3 13 (9.22%) VPN
4 11 (7.80%) Network Security
5 9 (6.38%) DHCP
6 7 (4.96%) NGFW
7 6 (4.26%) SSL
7 6 (4.26%) TCP/IP
8 4 (2.84%) SAN
8 4 (2.84%) VLAN
9 2 (1.42%) FTP
9 2 (1.42%) HTTP
9 2 (1.42%) SMTP
10 1 (0.71%) Intrusion Detection
10 1 (0.71%) WAN
Database & Business Intelligence
1 19 (13.48%) Power BI
2 12 (8.51%) Data Lake
3 11 (7.80%) Data Warehouse
4 9 (6.38%) Azure SQL Database
5 6 (4.26%) Delta Lake
6 5 (3.55%) Metadata
6 5 (3.55%) SQL Server
7 3 (2.13%) Big Data
7 3 (2.13%) Neo4j
8 2 (1.42%) Hadoop
8 2 (1.42%) MongoDB
8 2 (1.42%) Relational Database
9 1 (0.71%) Azure SQL Data Warehouse
9 1 (0.71%) NoSQL
9 1 (0.71%) SQL Server Analysis Services
9 1 (0.71%) SQL Server Integration Services
9 1 (0.71%) SQL Server Reporting Services
9 1 (0.71%) Star Schema
Development Applications
1 7 (4.96%) Jenkins
1 7 (4.96%) SonarQube
2 6 (4.26%) Git
2 6 (4.26%) JIRA
3 5 (3.55%) GitLab
4 2 (1.42%) Team Foundation Server
5 1 (0.71%) Artifactory
5 1 (0.71%) JMeter
5 1 (0.71%) Postman
5 1 (0.71%) Selenium
General
1 24 (17.02%) Social Skills
2 17 (12.06%) Finance
2 17 (12.06%) Public Sector
3 10 (7.09%) Banking
4 4 (2.84%) Analytical Skills
4 4 (2.84%) Law
5 3 (2.13%) Inclusion and Diversity
6 2 (1.42%) Retail
7 1 (0.71%) iGaming
7 1 (0.71%) Local Government
7 1 (0.71%) Manufacturing
7 1 (0.71%) Police
Libraries, Frameworks & Software Standards
1 13 (9.22%) ARM Templates
1 13 (9.22%) PySpark
2 11 (7.80%) ADO
3 9 (6.38%) .NET
4 8 (5.67%) JSON
5 7 (4.96%) YAML
6 3 (2.13%) .NET Core
6 3 (2.13%) Plotly
6 3 (2.13%) React
7 2 (1.42%) Entity Framework
7 2 (1.42%) OpenTelemetry
7 2 (1.42%) XML
8 1 (0.71%) .NET Framework
8 1 (0.71%) ASP.NET
8 1 (0.71%) ASP.NET Web API
8 1 (0.71%) Autofac
8 1 (0.71%) Dapper ORM
8 1 (0.71%) REST
8 1 (0.71%) StructureMap
8 1 (0.71%) Web Services
Miscellaneous
1 7 (4.96%) Anti-Spyware
2 4 (2.84%) Onboarding
2 4 (2.84%) Self-Motivation
3 3 (2.13%) Legacy Systems
4 2 (1.42%) Data Structures
4 2 (1.42%) Distributed Systems
4 2 (1.42%) Hybrid Cloud
4 2 (1.42%) Legacy Applications
4 2 (1.42%) Legacy Code
4 2 (1.42%) NHS
4 2 (1.42%) Reference Data
4 2 (1.42%) Replication
4 2 (1.42%) Security Posture
5 1 (0.71%) Clustering
5 1 (0.71%) Enterprise Software
5 1 (0.71%) Management Information System
5 1 (0.71%) Mobile App
5 1 (0.71%) N-Tier
5 1 (0.71%) PKI
5 1 (0.71%) Wiki
Operating Systems
1 27 (19.15%) Windows
2 12 (8.51%) Linux
3 7 (4.96%) Windows Server
4 5 (3.55%) Red Hat Enterprise Linux
5 4 (2.84%) Windows Server 2003
6 2 (1.42%) Ubuntu
6 2 (1.42%) VMS
7 1 (0.71%) Windows Server 2016
7 1 (0.71%) Windows Server 2019
Processes & Methodologies
1 68 (48.23%) DevOps
2 43 (30.50%) CI/CD
3 41 (29.08%) Infrastructure as Code
4 27 (19.15%) Migration
5 24 (17.02%) Agile
5 24 (17.02%) Data Engineering
6 21 (14.89%) Containerisation
6 21 (14.89%) ETL
7 20 (14.18%) Analytics
8 17 (12.06%) Data Modelling
9 15 (10.64%) Cloud Security
9 15 (10.64%) Data Ingestion
9 15 (10.64%) Infrastructure Engineering
10 14 (9.93%) Business Intelligence
10 14 (9.93%) Data Pipeline
11 13 (9.22%) Problem-Solving
12 11 (7.80%) Infrastructure Automation
12 11 (7.80%) Mentoring
13 10 (7.09%) DevSecOps
14 9 (6.38%) Machine Learning
Programming Languages
1 40 (28.37%) SQL
2 38 (26.95%) PowerShell
3 37 (26.24%) Python
4 19 (13.48%) Bash
5 13 (9.22%) Bicep
6 10 (7.09%) C#
7 6 (4.26%) Scala
8 3 (2.13%) JavaScript
9 2 (1.42%) Kusto Query Language
9 2 (1.42%) T-SQL
10 1 (0.71%) Data Analysis Expressions
10 1 (0.71%) VB
10 1 (0.71%) VBScript
Qualifications
1 42 (29.79%) Security Cleared
2 39 (27.66%) SC Cleared
3 15 (10.64%) Azure Certification
4 7 (4.96%) Microsoft Certification
5 3 (2.13%) Degree
5 3 (2.13%) DV Cleared
6 2 (1.42%) BPSS Clearance
6 2 (1.42%) CISSP
7 1 (0.71%) Computer Science Degree
7 1 (0.71%) ITIL Foundation Certificate
7 1 (0.71%) MCPD
7 1 (0.71%) MCSD
Quality Assurance & Compliance
1 12 (8.51%) Data Quality
2 8 (5.67%) GDPR
3 6 (4.26%) HIPAA
4 5 (3.55%) PCI DSS
5 4 (2.84%) SLA
6 3 (2.13%) NIST
7 2 (1.42%) Accessibility
8 1 (0.71%) QA
System Software
1 17 (12.06%) Active Directory
2 16 (11.35%) Docker
3 10 (7.09%) vSphere
4 9 (6.38%) Virtual Machines
5 5 (3.55%) Hyper-V
5 5 (3.55%) VMware Infrastructure
6 4 (2.84%) DFS Replication
7 2 (1.42%) Virtual Desktop
8 1 (0.71%) BitLocker
Systems Management
1 54 (38.30%) Terraform
2 24 (17.02%) Kubernetes
3 9 (6.38%) Microsoft Intune
4 7 (4.96%) Ansible
5 5 (3.55%) SCCM
6 4 (2.84%) HP Fortify
6 4 (2.84%) Nessus
6 4 (2.84%) Tivoli
7 2 (1.42%) Active Directory Federation Services
7 2 (1.42%) Grafana
7 2 (1.42%) Puppet
8 1 (0.71%) Argo
8 1 (0.71%) FortiGate
8 1 (0.71%) Progress Chef
8 1 (0.71%) QRadar
8 1 (0.71%) SCOM
8 1 (0.71%) Single Sign-On
8 1 (0.71%) WSUS
Vendors
1 40 (28.37%) Microsoft
2 30 (21.28%) Databricks
3 11 (7.80%) VMware
4 8 (5.67%) CheckPoint
5 7 (4.96%) Infoblox
5 7 (4.96%) Palo Alto
6 6 (4.26%) Qualys
7 5 (3.55%) Informatica
7 5 (3.55%) Zscaler
8 4 (2.84%) Citrix
8 4 (2.84%) SolarWinds
8 4 (2.84%) Veeam
9 3 (2.13%) ServiceNow
9 3 (2.13%) Splunk
10 2 (1.42%) Atlassian
10 2 (1.42%) Darktrace
10 2 (1.42%) NetApp
11 1 (0.71%) Dynatrace
11 1 (0.71%) LogicMonitor
11 1 (0.71%) Mellanox