End-to-End Testing Contracts with Work from Home Options

End-to-End Testing
UK > Work from Home

The table below provides summary statistics for contract job vacancies with an option to work from home (WFH) and a requirement for End-to-End Testing skills. Included is a benchmarking guide to the contractor rates offered in vacancies that have cited End-to-End Testing over the 6 months to 28 April 2024 with a comparison to the same period in the previous 2 years.

6 months to
28 Apr 2024
Same period 2023 Same period 2022
Rank 222 329 297
Rank change year-on-year +107 -32 +14
Contract jobs citing End-to-End Testing 126 143 373
As % of all contract jobs with a WFH option 0.82% 0.55% 0.84%
As % of the Processes & Methodologies category 0.94% 0.62% 0.92%
Number of daily rates quoted 91 97 280
10th Percentile £363 £325 £350
25th Percentile £425 £380 £420
Median daily rate (50th Percentile) £500 £500 £500
Median % change year-on-year - - +13.64%
75th Percentile £627 £600 £613
90th Percentile £738 £761 £680
UK median daily rate £500 £550 £500
% change year-on-year -9.09% +10.00% +17.65%
Number of hourly rates quoted 0 0 2
10th Percentile - - £26.00
25th Percentile - - £27.50
Median hourly rate - - £30.00
75th Percentile - - £32.50
90th Percentile - - £34.00
UK median hourly rate £26.03 £57.00 £35.00
% change year-on-year -54.33% +62.86% -

All Process and Methodology Skills
Work from Home

End-to-End Testing is in the Processes and Methodologies category. The following table is for comparison with the above and provides summary statistics for all contract job vacancies with a WFH option and a requirement for process or methodology skills.

Contract vacancies with a requirement for process or methodology skills 13,424 23,231 40,628
As % of all contract jobs with a WFH option 87.86% 89.84% 91.13%
Number of daily rates quoted 8,959 16,419 29,475
10th Percentile £325 £363 £360
25th Percentile £425 £450 £431
Median daily rate (50th Percentile) £525 £540 £525
Median % change year-on-year -2.78% +2.86% +9.38%
75th Percentile £638 £650 £625
90th Percentile £750 £750 £715
UK median daily rate £525 £550 £525
% change year-on-year -4.55% +4.76% +8.25%
Number of hourly rates quoted 568 532 547
10th Percentile £15.12 £19.00 £13.50
25th Percentile £24.25 £30.54 £19.89
Median hourly rate £40.28 £55.00 £35.00
Median % change year-on-year -26.76% +57.14% +34.62%
75th Percentile £60.00 £68.75 £55.00
90th Percentile £75.25 £80.23 £67.20
UK median hourly rate £35.00 £37.30 £25.00
% change year-on-year -6.17% +49.20% -

End-to-End Testing
Trend for Jobs with a WFH Option

Job vacancies with a work from home option citing End-to-End Testing as a proportion of all IT jobs advertised.
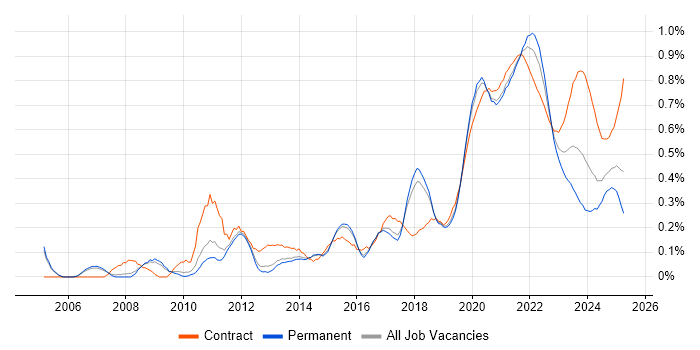
End-to-End Testing trend for jobs with a WFH option

End-to-End Testing
Daily Rate Trend for Jobs with a WFH Option

3-month moving average daily rate quoted in job vacancies with a work from home option citing End-to-End Testing.

End-to-End Testing daily rate for jobs with a WFH option

End-to-End Testing
Daily Rate Histogram for Jobs with a WFH Option

Daily rate distribution for jobs with a work from home option citing End-to-End Testing over the 6 months to 28 April 2024.

End-to-End Testing daily rate histogram for jobs with a WFH option

End-to-End Testing
Hourly Rate Trend for Jobs with a WFH Option

3-month moving average hourly rate quoted in job vacancies with a work from home option citing End-to-End Testing.

End-to-End Testing hourly rate for jobs with a WFH option

End-to-End Testing
Co-occurring Skills and Capabilities with WFH Options by Category

The follow tables expand on the table above by listing co-occurrences grouped by category. The same employment type, locality and period is covered with up to 20 co-occurrences shown in each of the following categories:

Application Platforms
1 7 (5.56%) Confluence
2 5 (3.97%) CMS
3 3 (2.38%) Umbraco
4 2 (1.59%) Apache Airflow
4 2 (1.59%) Apache Spark
4 2 (1.59%) CICS
4 2 (1.59%) Headless CMS
4 2 (1.59%) IIS
4 2 (1.59%) JBoss
Business Applications
1 11 (8.73%) Dynamics CRM
2 9 (7.14%) Oracle EBS
3 7 (5.56%) Oracle AGIS
3 7 (5.56%) Oracle Assets
3 7 (5.56%) Oracle General Ledger
3 7 (5.56%) Oracle Payables
4 2 (1.59%) Oracle Receivables
4 2 (1.59%) SAP S/4HANA
5 1 (0.79%) Dynamics AX
5 1 (0.79%) MIS ActiveH
5 1 (0.79%) NEC Housing
Cloud Services
1 33 (26.19%) AWS
2 17 (13.49%) Azure
3 15 (11.90%) Dynamics 365
4 7 (5.56%) Azure DevOps
5 6 (4.76%) Amazon EC2
6 5 (3.97%) Serverless
7 4 (3.17%) Amazon EKS
7 4 (3.17%) Amazon S3
7 4 (3.17%) Amazon SQS
7 4 (3.17%) AWS Lambda
7 4 (3.17%) GCP
8 2 (1.59%) Amazon CloudWatch
8 2 (1.59%) Apigee
8 2 (1.59%) AWS CloudFormation
8 2 (1.59%) Datadog
8 2 (1.59%) GitHub
8 2 (1.59%) Route 53
8 2 (1.59%) SaaS
8 2 (1.59%) SuccessFactors
8 2 (1.59%) Virtual Private Cloud
Communications & Networking
1 4 (3.17%) TCP/IP
2 2 (1.59%) SSL
3 1 (0.79%) DNS
3 1 (0.79%) Internet
3 1 (0.79%) NetScaler
Database & Business Intelligence
1 13 (10.32%) NoSQL
2 10 (7.94%) Relational Database
3 4 (3.17%) DB2
3 4 (3.17%) MongoDB
3 4 (3.17%) SQL Server
4 3 (2.38%) Data Warehouse
4 3 (2.38%) MySQL
4 3 (2.38%) PostgreSQL
5 2 (1.59%) Amazon Athena
5 2 (1.59%) Amazon Redshift
5 2 (1.59%) Apache Cassandra
5 2 (1.59%) Apache Hive
5 2 (1.59%) Elasticsearch
5 2 (1.59%) Hadoop
5 2 (1.59%) IDMS
Development Applications
1 19 (15.08%) JIRA
2 14 (11.11%) Jenkins
3 12 (9.52%) Git
4 10 (7.94%) Selenium
5 9 (7.14%) Cucumber
6 7 (5.56%) Bitbucket
6 7 (5.56%) Cypress.io
7 5 (3.97%) TestNG
8 4 (3.17%) GitLab
8 4 (3.17%) Maven
9 3 (2.38%) Artifactory
9 3 (2.38%) JMeter
9 3 (2.38%) JUnit
9 3 (2.38%) LoadRunner
9 3 (2.38%) REST Assured
9 3 (2.38%) SpecFlow
9 3 (2.38%) Storybook
9 3 (2.38%) TestRail
9 3 (2.38%) webpack
10 2 (1.59%) Visual Studio
General
1 28 (22.22%) Social Skills
2 24 (19.05%) Finance
3 17 (13.49%) Public Sector
4 16 (12.70%) Marketing
5 14 (11.11%) Analytical Skills
6 7 (5.56%) Front Office
6 7 (5.56%) General Ledger
7 6 (4.76%) Banking
7 6 (4.76%) Telecoms
8 5 (3.97%) Electronics
8 5 (3.97%) Manufacturing
9 3 (2.38%) Investment Banking
9 3 (2.38%) Retail
9 3 (2.38%) Tech for Good
10 2 (1.59%) Back Office
10 2 (1.59%) Corporate Banking
10 2 (1.59%) Military
10 2 (1.59%) Retail Banking
11 1 (0.79%) Automotive
11 1 (0.79%) Pharmaceutical
Job Titles
1 32 (25.40%) Developer
2 20 (15.87%) Analyst
3 15 (11.90%) Test Analyst
4 13 (10.32%) Test Manager
5 12 (9.52%) Consultant
6 11 (8.73%) Architect
6 11 (8.73%) Dynamics 365 Consultant
7 9 (7.14%) Software Developer
7 9 (7.14%) Test Engineer
8 8 (6.35%) Lead
8 8 (6.35%) Tester
9 7 (5.56%) Oracle Architect
9 7 (5.56%) Oracle Solutions Architect
9 7 (5.56%) React Developer
9 7 (5.56%) Software Engineer
9 7 (5.56%) Solutions Architect
10 6 (4.76%) Senior
11 5 (3.97%) Electronic Trading Developer
11 5 (3.97%) Front-End Developer (Client-Side Developer)
11 5 (3.97%) Test Automation Engineer
Libraries, Frameworks & Software Standards
1 18 (14.29%) RESTful
2 16 (12.70%) React
3 12 (9.52%) WebSockets
4 11 (8.73%) FastAPI
5 8 (6.35%) CSS
5 8 (6.35%) Redux
5 8 (6.35%) REST
6 6 (4.76%) Node.js
7 5 (3.97%) .NET
7 5 (3.97%) GraphQL
7 5 (3.97%) Reactive Extensions
8 4 (3.17%) HTML
8 4 (3.17%) Kafka
8 4 (3.17%) OAuth
8 4 (3.17%) Playwright
8 4 (3.17%) Web Services
9 3 (2.38%) ASP.NET MVC
9 3 (2.38%) Next.js
9 3 (2.38%) Spring
9 3 (2.38%) Spring Boot
Miscellaneous
1 11 (8.73%) Legacy Systems
2 6 (4.76%) Data Structures
3 5 (3.97%) Management Information System
4 4 (3.17%) Public Cloud
5 3 (2.38%) Distributed Systems
5 3 (2.38%) Mobile App
5 3 (2.38%) Private Cloud
6 2 (1.59%) Data Centre
6 2 (1.59%) Greenfield Project
6 2 (1.59%) Mainframe
6 2 (1.59%) VSAM
7 1 (0.79%) Cloud Native
7 1 (0.79%) Enterprise Software
7 1 (0.79%) Genomics
7 1 (0.79%) IoT
7 1 (0.79%) Market Risk
7 1 (0.79%) Product Ownership
7 1 (0.79%) Reference Data
7 1 (0.79%) Virtual Team
7 1 (0.79%) W3C
Operating Systems
1 11 (8.73%) Linux
2 6 (4.76%) Windows
3 4 (3.17%) Unix
4 3 (2.38%) Embedded Linux
5 2 (1.59%) AIX
5 2 (1.59%) Android
5 2 (1.59%) Apple iOS
5 2 (1.59%) Solaris
6 1 (0.79%) Windows 10
6 1 (0.79%) Windows Server 2012
6 1 (0.79%) Windows Server 2016
Processes & Methodologies
1 54 (42.86%) Agile
2 43 (34.13%) Test Automation
3 29 (23.02%) User Acceptance Testing
4 27 (21.43%) Test Scripting
5 25 (19.84%) CI/CD
6 23 (18.25%) Integration Testing
6 23 (18.25%) Problem-Solving
6 23 (18.25%) Scenario Testing
7 22 (17.46%) System Testing
8 18 (14.29%) DevOps
8 18 (14.29%) Migration
8 18 (14.29%) Software Testing
9 17 (13.49%) Test Strategy
9 17 (13.49%) Unit Testing
10 16 (12.70%) Test Management
11 15 (11.90%) Analytics
11 15 (11.90%) API Development
12 14 (11.11%) Continuous Integration
12 14 (11.11%) Software Engineering
13 13 (10.32%) Data Migration
Programming Languages
1 35 (27.78%) SQL
2 32 (25.40%) Python
3 21 (16.67%) Java
3 21 (16.67%) TypeScript
4 16 (12.70%) JavaScript
5 12 (9.52%) C#
6 5 (3.97%) C++
7 4 (3.17%) PowerShell
8 3 (2.38%) Kotlin
8 3 (2.38%) Scala
9 2 (1.59%) Assembly Language
9 2 (1.59%) Bash
9 2 (1.59%) C
9 2 (1.59%) COBOL
9 2 (1.59%) Groovy
9 2 (1.59%) JCL
9 2 (1.59%) Perl
9 2 (1.59%) Ruby
10 1 (0.79%) Jython
10 1 (0.79%) Shell Script
Qualifications
1 31 (24.60%) Security Cleared
2 26 (20.63%) SC Cleared
3 18 (14.29%) ISTQB
4 9 (7.14%) Degree
5 7 (5.56%) DV Cleared
6 3 (2.38%) ISEB
6 3 (2.38%) ISTQB Foundation Certification
7 2 (1.59%) PMI Certification
7 2 (1.59%) PMP
8 1 (0.79%) HNC
8 1 (0.79%) ISTQB Advanced Certification
8 1 (0.79%) ITIL Foundation Certificate
8 1 (0.79%) Master's Degree
Quality Assurance & Compliance
1 21 (16.67%) QA
2 7 (5.56%) GAAP
3 5 (3.97%) Accessibility
4 3 (2.38%) PMO
5 2 (1.59%) Def Stans
6 1 (0.79%) Data Quality
System Software
1 8 (6.35%) Docker
2 3 (2.38%) Virtual Machines
2 3 (2.38%) VirtualBox
3 1 (0.79%) Active Directory
3 1 (0.79%) Microsoft App-V
3 1 (0.79%) VMware ESXi
3 1 (0.79%) VMware Infrastructure
3 1 (0.79%) XenApp
3 1 (0.79%) XenDesktop
Systems Management
1 7 (5.56%) Kubernetes
2 4 (3.17%) Ansible
2 4 (3.17%) Grafana
2 4 (3.17%) Terraform
3 2 (1.59%) HP ALM
3 2 (1.59%) HP Quality Center
3 2 (1.59%) Nagios
3 2 (1.59%) Progress Chef
3 2 (1.59%) Prometheus
3 2 (1.59%) Puppet
3 2 (1.59%) Tivoli
3 2 (1.59%) Zipkin
4 1 (0.79%) Microsoft Intune
4 1 (0.79%) SysTrack
Vendors
1 18 (14.29%) Oracle
2 10 (7.94%) SAP
3 8 (6.35%) IBM
3 8 (6.35%) Microsoft
3 8 (6.35%) OpenAI
4 5 (3.97%) HP
5 4 (3.17%) Google
5 4 (3.17%) ServiceNow
5 4 (3.17%) Splunk
6 3 (2.38%) Salesforce
6 3 (2.38%) VMware
7 2 (1.59%) AppDynamics
7 2 (1.59%) Ariba
7 2 (1.59%) Confluent
7 2 (1.59%) Dell
7 2 (1.59%) F5
7 2 (1.59%) Informatica
7 2 (1.59%) New Relic
7 2 (1.59%) StreamSets
8 1 (0.79%) Workday