Fintech Contracts with Work from Home Options

Financial Technology (FinTech)
UK > Work from Home

The table below provides summary statistics for contract job vacancies with an option to work from home (WFH) and a requirement for Fintech skills. Included is a benchmarking guide to the contractor rates offered in vacancies that have cited Fintech over the 6 months to 4 May 2024 with a comparison to the same period in the previous 2 years.

6 months to
4 May 2024
Same period 2023 Same period 2022
Rank 139 176 192
Rank change year-on-year +37 +16 +63
Contract jobs citing Fintech 221 360 648
As % of all contract jobs with a WFH option 1.46% 1.41% 1.45%
As % of the Processes & Methodologies category 1.66% 1.57% 1.59%
Number of daily rates quoted 190 283 540
10th Percentile £400 £413 £424
25th Percentile £503 £463 £475
Median daily rate (50th Percentile) £650 £600 £600
Median % change year-on-year +8.33% - +20.00%
75th Percentile £750 £688 £677
90th Percentile £800 £750 £750
UK median daily rate £650 £593 £600
% change year-on-year +9.70% -1.25% +14.29%
Number of hourly rates quoted 2 0 2
10th Percentile £55.13 - £36.00
25th Percentile £55.31 - £37.50
Median hourly rate £56.25 - £40.00
75th Percentile £57.81 - £42.50
90th Percentile £58.38 - £44.00
UK median hourly rate £55.00 - £40.00
% change year-on-year - - -38.46%

All Process and Methodology Skills
Work from Home

Fintech is in the Processes and Methodologies category. The following table is for comparison with the above and provides summary statistics for all contract job vacancies with a WFH option and a requirement for process or methodology skills.

Contract vacancies with a requirement for process or methodology skills 13,316 22,957 40,627
As % of all contract jobs with a WFH option 87.90% 89.76% 91.11%
Number of daily rates quoted 8,913 16,228 29,490
10th Percentile £325 £363 £363
25th Percentile £425 £450 £431
Median daily rate (50th Percentile) £525 £540 £525
Median % change year-on-year -2.78% +2.86% +8.25%
75th Percentile £638 £650 £626
90th Percentile £750 £750 £725
UK median daily rate £525 £550 £530
% change year-on-year -4.55% +3.77% +8.72%
Number of hourly rates quoted 575 528 539
10th Percentile £15.17 £18.93 £13.70
25th Percentile £24.63 £30.00 £19.96
Median hourly rate £42.50 £55.00 £35.00
Median % change year-on-year -22.73% +57.14% +40.00%
75th Percentile £60.00 £68.75 £55.13
90th Percentile £75.15 £80.25 £67.56
UK median hourly rate £35.95 £36.00 £25.00
% change year-on-year -0.14% +44.00% +2.04%

Fintech
Trend for Jobs with a WFH Option

Job vacancies with a work from home option citing Fintech as a proportion of all IT jobs advertised.
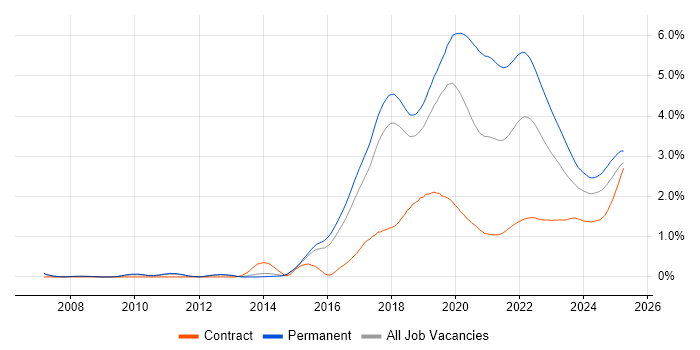
Fintech trend for jobs with a WFH option

Fintech
Daily Rate Trend for Jobs with a WFH Option

3-month moving average daily rate quoted in job vacancies with a work from home option citing Fintech.

Fintech daily rate for jobs with a WFH option

Fintech
Daily Rate Histogram for Jobs with a WFH Option

Daily rate distribution for jobs with a work from home option citing Fintech over the 6 months to 4 May 2024.

Fintech daily rate histogram for jobs with a WFH option

Fintech
Hourly Rate Trend for Jobs with a WFH Option

3-month moving average hourly rate quoted in job vacancies with a work from home option citing Fintech.

Fintech hourly rate for jobs with a WFH option

Fintech
Co-occurring Skills and Capabilities with WFH Options by Category

The follow tables expand on the table above by listing co-occurrences grouped by category. The same employment type, locality and period is covered with up to 20 co-occurrences shown in each of the following categories:

Application Platforms
1 11 (4.98%) Apache Airflow
2 10 (4.52%) Apache
3 4 (1.81%) Microsoft Exchange
3 4 (1.81%) SharePoint
4 3 (1.36%) CMS
4 3 (1.36%) Confluence
4 3 (1.36%) Headless CMS
5 2 (0.90%) Apache Spark
5 2 (0.90%) nginx
6 1 (0.45%) MQSeries
Applications
1 1 (0.45%) Microsoft Excel
Business Applications
1 5 (2.26%) Distributed Ledger
1 5 (2.26%) Loan IQ
2 1 (0.45%) Oracle Receivables
Cloud Services
1 78 (35.29%) AWS
2 29 (13.12%) GCP
3 18 (8.14%) Azure
4 6 (2.71%) Twilio
5 5 (2.26%) dbt
5 5 (2.26%) Microsoft 365
6 4 (1.81%) Figma
6 4 (1.81%) OneDrive
6 4 (1.81%) SaaS
7 3 (1.36%) Amazon CloudWatch
7 3 (1.36%) GitHub
8 2 (0.90%) Amazon EKS
8 2 (0.90%) Azure Cosmos DB
8 2 (0.90%) Azure DevOps
8 2 (0.90%) Bitrise
8 2 (0.90%) Cloud Computing
8 2 (0.90%) Serverless
8 2 (0.90%) WhatsApp
9 1 (0.45%) Amazon S3
9 1 (0.45%) PaaS
Communications & Networking
1 4 (1.81%) Firewall
1 4 (1.81%) VPN
2 2 (0.90%) Network Security
2 2 (0.90%) TCP/IP
3 1 (0.45%) HTTP
3 1 (0.45%) SSH
Database & Business Intelligence
1 31 (14.03%) Apache Cassandra
2 10 (4.52%) Apache Ignite
3 8 (3.62%) Data Warehouse
4 7 (3.17%) PostgreSQL
4 7 (3.17%) SQL Server Integration Services
4 7 (3.17%) SQL Server Reporting Services
5 6 (2.71%) Amazon Athena
5 6 (2.71%) Big Data
6 5 (2.26%) Apache Arrow
6 5 (2.26%) Dremio
7 3 (1.36%) MongoDB
8 2 (0.90%) Amazon Aurora
8 2 (0.90%) NoSQL
8 2 (0.90%) Relational Database
9 1 (0.45%) Amazon RDS
9 1 (0.45%) Amazon Redshift
9 1 (0.45%) DynamoDB
9 1 (0.45%) Elasticsearch
9 1 (0.45%) Looker
9 1 (0.45%) Oracle ODI
Development Applications
1 6 (2.71%) Git
2 3 (1.36%) Appium
2 3 (1.36%) Postman
3 2 (0.90%) Android Studio
3 2 (0.90%) Fiddler
3 2 (0.90%) git-flow
3 2 (0.90%) Jenkins
3 2 (0.90%) JIRA
3 2 (0.90%) SoapUI
3 2 (0.90%) XCTest
3 2 (0.90%) XCUITest
4 1 (0.45%) Octopus Deploy
4 1 (0.45%) Oracle APEX
4 1 (0.45%) PyCharm
4 1 (0.45%) Selenium
4 1 (0.45%) SonarQube
4 1 (0.45%) Storybook
4 1 (0.45%) TeamCity
General
1 109 (49.32%) Finance
2 40 (18.10%) Social Skills
3 33 (14.93%) Front Office
4 24 (10.86%) Banking
5 13 (5.88%) Analytical Skills
6 10 (4.52%) Financial Institution
7 9 (4.07%) Presentation Skills
8 8 (3.62%) Investment Banking
9 6 (2.71%) Inclusion and Diversity
10 5 (2.26%) Retail Banking
11 4 (1.81%) Corporate Banking
11 4 (1.81%) Retail
12 2 (0.90%) Back Office
12 2 (0.90%) Influencing Skills
12 2 (0.90%) Marketing
12 2 (0.90%) Public Sector
12 2 (0.90%) Publishing
13 1 (0.45%) Military
13 1 (0.45%) Organisational Skills
13 1 (0.45%) Social Housing
Job Titles
1 91 (41.18%) Developer
2 62 (28.05%) Software Engineer
3 42 (19.00%) Senior
4 27 (12.22%) React Developer
5 20 (9.05%) Architect
6 19 (8.60%) Developer/Software Engineer
7 17 (7.69%) Senior Software Engineer
8 13 (5.88%) Solutions Architect
9 12 (5.43%) Full Stack Developer
10 9 (4.07%) C# Developer
10 9 (4.07%) Front-End Developer (Client-Side Developer)
10 9 (4.07%) Full Stack Engineer
10 9 (4.07%) Full Stack Software Engineer
10 9 (4.07%) Senior Developer
11 8 (3.62%) AWS Engineer
12 7 (3.17%) AWS Developer
12 7 (3.17%) Consultant
12 7 (3.17%) Java Developer
12 7 (3.17%) Python Developer
13 6 (2.71%) C# Software Engineer
Libraries, Frameworks & Software Standards
1 37 (16.74%) React
2 34 (15.38%) Kafka
3 24 (10.86%) Node.js
4 19 (8.60%) Redux
5 16 (7.24%) GraphQL
6 10 (4.52%) .NET
6 10 (4.52%) gRPC
6 10 (4.52%) Protocol Buffers
7 9 (4.07%) Material-UI
8 7 (3.17%) CSS
8 7 (3.17%) React Native
9 6 (2.71%) Jest
9 6 (2.71%) NumPy
9 6 (2.71%) Pandas
10 5 (2.26%) AngularJS
10 5 (2.26%) Next.js
10 5 (2.26%) SciPy
10 5 (2.26%) Vue
11 4 (1.81%) REST
11 4 (1.81%) RESTful
Miscellaneous
1 21 (9.50%) Greenfield Project
2 19 (8.60%) Fixed Income
3 10 (4.52%) Mobile App
4 6 (2.71%) Blockchain
5 5 (2.26%) Foreign Exchange (FX)
6 4 (1.81%) Legacy Systems
7 3 (1.36%) PKI
7 3 (1.36%) Product Ownership
7 3 (1.36%) Team-Oriented Environment
8 2 (0.90%) Algorithms
8 2 (0.90%) Blog
8 2 (0.90%) Hedge funds
8 2 (0.90%) Mobile Banking
8 2 (0.90%) Virtual Team
9 1 (0.45%) CBDC
9 1 (0.45%) Equities
9 1 (0.45%) Replication
9 1 (0.45%) Self-Motivation
9 1 (0.45%) Web3
9 1 (0.45%) Wiki
Operating Systems
1 9 (4.07%) Android
2 7 (3.17%) Apple iOS
3 6 (2.71%) Windows
4 3 (1.36%) Linux
5 2 (0.90%) VMS
5 2 (0.90%) Windows 10
5 2 (0.90%) Windows Server
6 1 (0.45%) Red Hat Enterprise Linux
Processes & Methodologies
1 93 (42.08%) Software Engineering
2 81 (36.65%) Agile
3 45 (20.36%) User Experience
4 33 (14.93%) UX Design
5 32 (14.48%) UX Research
6 30 (13.57%) User Research
7 23 (10.41%) Problem-Solving
8 21 (9.50%) DevOps
9 19 (8.60%) Asset Management
9 19 (8.60%) Investment Management
9 19 (8.60%) Performance Attribution
10 18 (8.14%) Full Stack Development
11 16 (7.24%) CI/CD
12 13 (5.88%) Computer Science
13 11 (4.98%) Front End Development
13 11 (4.98%) Low Latency
14 10 (4.52%) Software Testing
15 9 (4.07%) Data Modelling
15 9 (4.07%) Presales
15 9 (4.07%) SDLC
Programming Languages
1 38 (17.19%) TypeScript
2 37 (16.74%) Go
3 36 (16.29%) Python
4 31 (14.03%) Java
4 31 (14.03%) JavaScript
5 25 (11.31%) C#
6 18 (8.14%) SQL
7 16 (7.24%) Kotlin
8 7 (3.17%) Scala
9 6 (2.71%) PHP
10 3 (1.36%) Swift
11 2 (0.90%) Perl
11 2 (0.90%) PowerShell
11 2 (0.90%) R
12 1 (0.45%) Bash
12 1 (0.45%) Groovy
12 1 (0.45%) PL/SQL
12 1 (0.45%) Ruby
12 1 (0.45%) VB.NET
Qualifications
1 20 (9.05%) Degree
2 11 (4.98%) Computer Science Degree
3 7 (3.17%) SC Cleared
3 7 (3.17%) Security Cleared
4 4 (1.81%) Master's Degree
4 4 (1.81%) Microsoft Certification
4 4 (1.81%) PhD
5 3 (1.36%) MBA
6 2 (0.90%) BPSS Clearance
6 2 (0.90%) CCNA
6 2 (0.90%) CCNP
6 2 (0.90%) Cisco Certification
6 2 (0.90%) MCSA
Quality Assurance & Compliance
1 7 (3.17%) QA
2 4 (1.81%) ISO/IEC 27001
2 4 (1.81%) PCI DSS
3 2 (0.90%) Accessibility
3 2 (0.90%) GRC
3 2 (0.90%) NIST
System Software
1 34 (15.38%) Docker
2 2 (0.90%) Squid
2 2 (0.90%) Virtual Servers
3 1 (0.45%) Active Directory
3 1 (0.45%) Hyper-V
Systems Management
1 41 (18.55%) Kubernetes
2 7 (3.17%) Terraform
3 2 (0.90%) Ansible
3 2 (0.90%) HAProxy
3 2 (0.90%) SCCM
4 1 (0.45%) Grafana
4 1 (0.45%) Jamf Pro
4 1 (0.45%) Kibana
4 1 (0.45%) logstash
4 1 (0.45%) Progress Chef
4 1 (0.45%) Prometheus
4 1 (0.45%) Puppet
Vendors
1 7 (3.17%) Google
1 7 (3.17%) Microsoft
2 4 (1.81%) ION Trading
3 3 (1.36%) Apple
3 3 (1.36%) Oracle
4 2 (0.90%) Cisco
4 2 (0.90%) CyberArk
4 2 (0.90%) Fortinet
4 2 (0.90%) Palo Alto
4 2 (0.90%) Salesforce
5 1 (0.45%) Atlassian
5 1 (0.45%) Checkmarx
5 1 (0.45%) Dynatrace
5 1 (0.45%) Freshdesk
5 1 (0.45%) HubSpot
5 1 (0.45%) IBM
5 1 (0.45%) Ping Identity
5 1 (0.45%) Solace
5 1 (0.45%) Splunk
5 1 (0.45%) TIBCO