Hybrid/Remote Fintech Job Trends

Financial Technology (FinTech)
UK > Work from Home

The table below provides summary statistics and salary benchmarking for remote or hybrid work requiring Fintech skills. It covers permanent job vacancies from the 6 months leading up to 8 November 2025, with comparisons to the same periods in the previous two years.

6 months to
8 Nov 2025
Same period 2024 Same period 2023
Rank 150 108 95
Rank change year-on-year -42 -13 -33
Permanent jobs citing Fintech 322 554 724
As % of all permanent jobs with remote/hybrid work options 2.02% 2.79% 3.28%
As % of the Processes & Methodologies category 2.18% 3.16% 3.45%
Number of salaries quoted 269 460 663
10th Percentile £45,000 £55,000 £51,500
25th Percentile £55,000 £71,250 £62,500
Median annual salary (50th Percentile) £90,000 £85,000 £85,000
Median % change year-on-year +5.88% - +17.24%
75th Percentile £130,000 £108,750 £100,625
90th Percentile £137,500 £120,000 £129,500
UK median annual salary £78,500 £85,000 £85,000
% change year-on-year -7.65% - +17.24%

All Process and Methodology Skills
Work from Home

Fintech falls under the Processes and Methodologies category. For comparison with the information above, the following table provides summary statistics for all permanent job vacancies with remote or hybrid options requiring process or methodology skills.

Permanent vacancies with a requirement for process or methodology skills 14,749 17,546 20,993
As % of all permanent jobs with a WFH option 92.38% 88.33% 95.02%
Number of salaries quoted 8,703 10,436 17,007
10th Percentile £29,300 £36,000 £37,000
25th Percentile £40,000 £46,250 £47,000
Median annual salary (50th Percentile) £57,500 £62,500 £62,500
Median % change year-on-year -8.00% - -
75th Percentile £77,500 £81,250 £80,500
90th Percentile £98,000 £100,000 £97,500
UK median annual salary £54,000 £60,000 £60,000
% change year-on-year -10.00% - -

Fintech
Job Vacancy Trend for Remote/Hybrid Jobs

Historical trend showing the proportion of permanent IT job postings citing Fintech and offering remote or hybrid work options relative to all permanent IT jobs advertised.
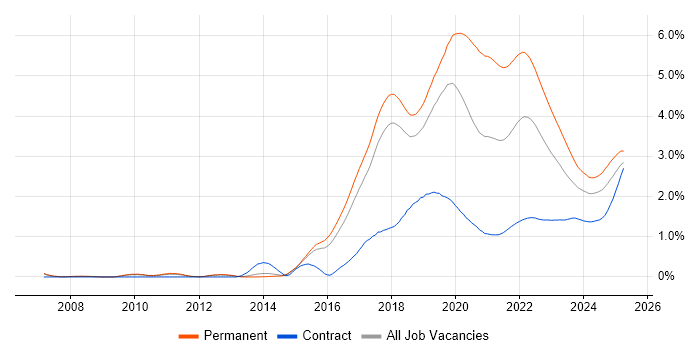
Fintech job vacancy trend for remote/hybrid jobs

Fintech
Salary Trend for Remote/Hybrid Jobs

Salary distribution trend for jobs with remote/hybrid work options citing Fintech.

Salary distribution trend for jobs with remote/hybrid work options citing Fintech

Fintech
Salary Histogram for Remote/Hybrid Jobs

Salary distribution for jobs with remote/hybrid work options citing Fintech over the 6 months to 8 November 2025.

Fintech salary histogram for jobs with remote/hybrid work options

Fintech
Co-Occurring Skills & Capabilities in Remote/Hybrid Jobs by Category

The following tables expand on the one above by listing co-occurrences grouped by category. They cover the same employment type, locality and period, with up to 20 co-occurrences shown in each category:

Application Platforms
1 65 (20.19%) Apache Airflow
2 12 (3.73%) Microsoft Exchange
3 8 (2.48%) IIS
4 3 (0.93%) Apache
5 2 (0.62%) Apache Spark
6 1 (0.31%) Confluence
Applications
1 11 (3.42%) Microsoft Excel
2 5 (1.55%) Microsoft Office
3 2 (0.62%) Adobe Creative Suite
3 2 (0.62%) Adobe XD
3 2 (0.62%) Sketch
4 1 (0.31%) Microsoft PowerPoint
Business Applications
1 1 (0.31%) Magento
1 1 (0.31%) Shopify
Cloud Services
1 140 (43.48%) AWS
2 93 (28.88%) GCP
3 66 (20.50%) dbt
4 61 (18.94%) SaaS
5 42 (13.04%) Azure
6 15 (4.66%) GitHub
7 13 (4.04%) Power Platform
8 8 (2.48%) Amazon EKS
9 5 (1.55%) Azure Cosmos DB
9 5 (1.55%) Microsoft 365
9 5 (1.55%) PaaS
10 4 (1.24%) Azure Event Grid
10 4 (1.24%) Figma
10 4 (1.24%) Intacct
10 4 (1.24%) Workato
11 3 (0.93%) Amazon CloudWatch
11 3 (0.93%) Google Analytics
11 3 (0.93%) Google Kubernetes Engine
12 2 (0.62%) Supabase
12 2 (0.62%) Vercel
Communications & Networking
1 1 (0.31%) Firewall
1 1 (0.31%) HTTP
1 1 (0.31%) TCP/IP
Database & Business Intelligence
1 80 (24.84%) PostgreSQL
2 64 (19.88%) Amazon Athena
3 63 (19.57%) Apache Arrow
3 63 (19.57%) Apache Iceberg
3 63 (19.57%) Dremio
4 17 (5.28%) SQL Server
5 15 (4.66%) MongoDB
6 13 (4.04%) Power BI
7 12 (3.73%) Data Hub
7 12 (3.73%) SQL CLR
8 7 (2.17%) Azure SQL Database
8 7 (2.17%) Elasticsearch
9 6 (1.86%) SQL Server Reporting Services
10 4 (1.24%) Metadata
10 4 (1.24%) SQL Server Analysis Services
11 3 (0.93%) Apache Ignite
11 3 (0.93%) Relational Database
11 3 (0.93%) Tableau
12 2 (0.62%) NoSQL
12 2 (0.62%) Redis
Development Applications
1 8 (2.48%) Cypress.io
2 7 (2.17%) Git
2 7 (2.17%) Selenium
3 4 (1.24%) JIRA
4 3 (0.93%) Jenkins
5 2 (0.62%) Appium
5 2 (0.62%) CircleCI
5 2 (0.62%) GitLab
5 2 (0.62%) Postman
5 2 (0.62%) TeamCity
6 1 (0.31%) Cucumber
6 1 (0.31%) NUnit
6 1 (0.31%) PHPUnit
6 1 (0.31%) SoapUI
6 1 (0.31%) Storybook
6 1 (0.31%) Visual Studio
6 1 (0.31%) Xcode
6 1 (0.31%) XCUITest
General
1 241 (74.84%) Finance
2 84 (26.09%) Social Skills
3 78 (24.22%) Front Office
4 57 (17.70%) Banking
5 40 (12.42%) Financial Institution
6 38 (11.80%) Analytical Skills
7 21 (6.52%) Back Office
8 19 (5.90%) Marketing
9 18 (5.59%) Law
10 16 (4.97%) Inclusion and Diversity
11 15 (4.66%) Retail
12 11 (3.42%) Organisational Skills
13 10 (3.11%) Influencing Skills
13 10 (3.11%) Legal
13 10 (3.11%) Presentation Skills
14 3 (0.93%) Advertising
14 3 (0.93%) Polish Language
15 2 (0.62%) Automotive
15 2 (0.62%) Investment Banking
15 2 (0.62%) Multimedia
Job Titles
1 108 (33.54%) Software Engineer
2 105 (32.61%) Developer
3 74 (22.98%) Developer/Software Engineer
4 63 (19.57%) AWS Developer
4 63 (19.57%) AWS Engineer
4 63 (19.57%) AWS Software Engineer
5 61 (18.94%) Python Engineer
5 61 (18.94%) Python Software Engineer
6 53 (16.46%) Python Developer
7 47 (14.60%) Senior
8 21 (6.52%) Lead
9 16 (4.97%) Senior Software Engineer
10 15 (4.66%) Analyst
10 15 (4.66%) Java Engineer
11 14 (4.35%) Java Developer
12 12 (3.73%) Java Software Engineer
13 11 (3.42%) Senior Developer
14 10 (3.11%) Java Software Developer
15 9 (2.80%) Architect
15 9 (2.80%) Head of Development
Libraries, Frameworks & Software Standards
1 108 (33.54%) React
2 85 (26.40%) Node.js
3 79 (24.53%) AngularJS
4 78 (24.22%) Vue
5 64 (19.88%) Pandas
6 63 (19.57%) NumPy
6 63 (19.57%) SciPy
7 29 (9.01%) .NET
8 19 (5.90%) .NET Core
8 19 (5.90%) .NET Framework
9 17 (5.28%) Spring Boot
10 16 (4.97%) REST
10 16 (4.97%) Spring
11 15 (4.66%) Entity Framework
12 14 (4.35%) Kafka
13 12 (3.73%) Next.js
14 11 (3.42%) Redux
15 9 (2.80%) CSS
15 9 (2.80%) Middleware
16 8 (2.48%) RESTful
Miscellaneous
1 78 (24.22%) Equities
1 78 (24.22%) Foreign Exchange (FX)
2 75 (23.29%) Fixed Income
3 20 (6.21%) Cloud Native
4 15 (4.66%) Distributed Systems
5 13 (4.04%) Private Cloud
6 12 (3.73%) Onboarding
6 12 (3.73%) Product Ownership
7 8 (2.48%) Blog
7 8 (2.48%) Team-Oriented Environment
8 7 (2.17%) Algorithms
9 6 (1.86%) Hedge funds
9 6 (1.86%) Mobile App
9 6 (1.86%) Reinsurance
10 5 (1.55%) Augmented Reality
10 5 (1.55%) Low-Code
10 5 (1.55%) Self-Motivation
11 4 (1.24%) Cyberattack
11 4 (1.24%) Distributed Denial-of-Service
11 4 (1.24%) Insider Threat
Operating Systems
1 18 (5.59%) Windows
2 16 (4.97%) Linux
3 8 (2.48%) Windows Server
4 5 (1.55%) Apple iOS
4 5 (1.55%) Red Hat Enterprise Linux
5 4 (1.24%) Mac OS
6 2 (0.62%) Android
6 2 (0.62%) CentOS
Processes & Methodologies
1 141 (43.79%) Agile
2 140 (43.48%) Software Engineering
3 81 (25.16%) Asset Management
4 78 (24.22%) Risk Management
5 76 (23.60%) Investment Management
6 63 (19.57%) Order Management
6 63 (19.57%) Performance Attribution
7 49 (15.22%) Problem-Solving
8 45 (13.98%) AI
9 40 (12.42%) Microservices
10 39 (12.11%) Analytics
10 39 (12.11%) Decision-Making
11 37 (11.49%) CI/CD
12 34 (10.56%) Continuous Improvement
12 34 (10.56%) Roadmaps
13 30 (9.32%) TDD
14 29 (9.01%) Full-Stack Development
15 28 (8.70%) Collaborative Culture
16 26 (8.07%) Stakeholder Management
17 24 (7.45%) Event-Driven
Programming Languages
1 102 (31.68%) TypeScript
2 96 (29.81%) Python
3 95 (29.50%) JavaScript
4 52 (16.15%) SQL
5 44 (13.66%) Java
6 29 (9.01%) C#
7 9 (2.80%) Go
8 8 (2.48%) Kotlin
8 8 (2.48%) PHP
9 7 (2.17%) T-SQL
10 4 (1.24%) C++
10 4 (1.24%) Swift
11 3 (0.93%) VBA
12 2 (0.62%) Bash
12 2 (0.62%) C
12 2 (0.62%) Ruby
12 2 (0.62%) Rust
13 1 (0.31%) Apex Code
13 1 (0.31%) PowerShell
13 1 (0.31%) SOQL
Qualifications
1 35 (10.87%) Degree
2 11 (3.42%) Computer Science Degree
3 6 (1.86%) Master's Degree
4 4 (1.24%) Azure Certification
4 4 (1.24%) CISA
4 4 (1.24%) CREST Certified
4 4 (1.24%) OSCE
4 4 (1.24%) OSCP
5 3 (0.93%) ACCA
5 3 (0.93%) CIMA
6 2 (0.62%) AWS Certification
6 2 (0.62%) AWS Certified Solutions Architect
6 2 (0.62%) Numerate Degree
7 1 (0.31%) AWS Certified Cloud Practitioner
7 1 (0.31%) MCSA
7 1 (0.31%) MCSE
7 1 (0.31%) Microsoft Certification
7 1 (0.31%) PhD
Quality Assurance & Compliance
1 12 (3.73%) QA
2 7 (2.17%) GDPR
3 5 (1.55%) ISO/IEC 27001
3 5 (1.55%) Sarbanes-Oxley
4 4 (1.24%) Actionable Recommendations
4 4 (1.24%) EU AI Act
4 4 (1.24%) SLA
5 3 (0.93%) PCI DSS
6 2 (0.62%) Accessibility
6 2 (0.62%) Data Quality
6 2 (0.62%) PMO
7 1 (0.31%) Cyber Essentials
System Software
1 20 (6.21%) Docker
2 12 (3.73%) VMware Infrastructure
Systems Management
1 23 (7.14%) Kubernetes
2 9 (2.80%) Terraform
3 4 (1.24%) Failover Clustering
3 4 (1.24%) Grafana
4 3 (0.93%) Ansible
4 3 (0.93%) Control-M
5 1 (0.31%) Kibana
5 1 (0.31%) Prometheus
Vendors
1 24 (7.45%) Microsoft
2 13 (4.04%) VMware
3 9 (2.80%) Google
4 4 (1.24%) Concur
4 4 (1.24%) Sage
4 4 (1.24%) Solace
5 3 (0.93%) Bloomberg
5 3 (0.93%) Calypso
6 2 (0.62%) Adobe
6 2 (0.62%) Ahrefs
6 2 (0.62%) CyberSource
6 2 (0.62%) Red Hat
6 2 (0.62%) Screaming Frog
6 2 (0.62%) ServiceNow
6 2 (0.62%) Solarflare
7 1 (0.31%) Amplitude
7 1 (0.31%) Extreme Networks
7 1 (0.31%) OpenAI
7 1 (0.31%) Revolut
7 1 (0.31%) Splunk