Integration Testing Contracts with Hybrid/Remote/WFH Options

Integration Testing
UK > Work from Home

The table below provides summary statistics for remote or hybrid contract work requiring Integration Testing skills. It includes a benchmarking guide to the contractor rates offered in vacancies that cited Integration Testing over the 6 months leading up to 8 July 2025, comparing them to the same period in the previous two years.

6 months to
8 Jul 2025
Same period 2024 Same period 2023
Rank 217 270 259
Rank change year-on-year +53 -11 +73
Contract jobs citing Integration Testing 98 82 213
As % of all contract jobs with a WFH option 0.96% 0.56% 0.87%
As % of the Processes & Methodologies category 1.05% 0.65% 0.98%
Number of daily rates quoted 62 65 141
10th Percentile £350 £355 £313
25th Percentile £413 £425 £363
Median daily rate (50th Percentile) £475 £500 £500
Median % change year-on-year -5.00% - -1.96%
75th Percentile £619 £650 £600
90th Percentile £638 £735 £719
UK median daily rate £468 £525 £525
% change year-on-year -10.95% - +2.94%
Number of hourly rates quoted 4 0 13
10th Percentile - - £63.25
25th Percentile £52.50 - £70.00
Median hourly rate £58.75 - £72.50
75th Percentile £63.75 - £75.00
90th Percentile - - -
UK median hourly rate £57.50 £57.50 £70.00
% change year-on-year - -17.86% +16.67%

All Process and Methodology Skills
Work from Home

Integration Testing falls under the Processes and Methodologies category. For comparison with the information above, the following table provides summary statistics for all contract job vacancies with remote or hybrid options requiring process or methodology skills.

Contract vacancies with a requirement for process or methodology skills 9,347 12,702 21,816
As % of all contract jobs with a WFH option 91.74% 87.36% 89.49%
Number of daily rates quoted 6,334 8,549 15,395
10th Percentile £325 £325 £359
25th Percentile £413 £425 £450
Median daily rate (50th Percentile) £513 £525 £540
Median % change year-on-year -2.38% -2.78% +0.47%
75th Percentile £638 £638 £650
90th Percentile £750 £750 £750
UK median daily rate £505 £525 £550
% change year-on-year -3.81% -4.55% +0.92%
Number of hourly rates quoted 264 549 528
10th Percentile £12.73 £14.98 £18.50
25th Percentile £19.00 £24.00 £25.99
Median hourly rate £34.83 £42.50 £52.50
Median % change year-on-year -18.06% -19.05% +25.00%
75th Percentile £65.00 £60.00 £68.75
90th Percentile £75.00 £74.10 £80.25
UK median hourly rate £25.15 £37.50 £39.92
% change year-on-year -32.93% -6.05% +53.52%

Integration Testing
Trend for Jobs with a WFH Option

Job vacancies with remote working options citing Integration Testing as a proportion of all IT jobs advertised.
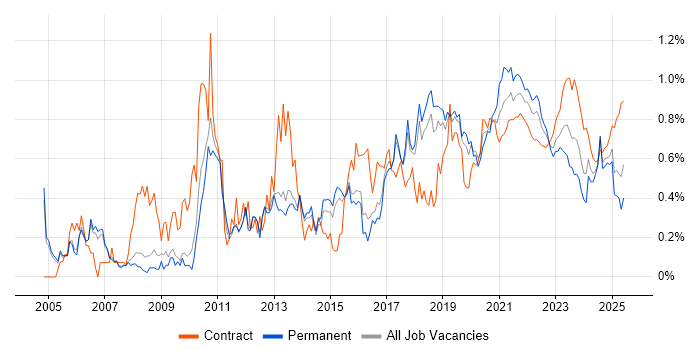
Integration Testing trend for jobs with Hybrid/Remote/WFH options

Integration Testing
Daily Rate Trend for Jobs with a WFH Option

3-month moving average daily rate quoted in job vacancies with remote working options citing Integration Testing.

Integration Testing daily rate for jobs with a WFH option

Integration Testing
Daily Rate Histogram for Jobs with a WFH Option

Daily rate distribution for jobs with remote working options citing Integration Testing over the 6 months to 8 July 2025.

Integration Testing daily rate histogram for jobs with a WFH option

Integration Testing
Hourly Rate Trend for Jobs with a WFH Option

3-month moving average hourly rate quoted in job vacancies with remote working options citing Integration Testing.

Integration Testing hourly rate for jobs with a WFH option

Integration Testing
Co-occurring Skills and Capabilities with WFH Options by Category

The follow tables expand on the table above by listing co-occurrences grouped by category. The same employment type, locality and period is covered with up to 20 co-occurrences shown in each of the following categories:

Application Platforms
1 5 (5.10%) Confluence
2 3 (3.06%) Adobe Experience Manager
2 3 (3.06%) Documentum
3 2 (2.04%) MQSeries
4 1 (1.02%) Apache
4 1 (1.02%) JBoss
4 1 (1.02%) Mule
4 1 (1.02%) OpenROAD
4 1 (1.02%) Oracle Service Bus
4 1 (1.02%) Oracle SOA Suite
4 1 (1.02%) SharePoint
Applications
1 1 (1.02%) Microsoft Excel
1 1 (1.02%) Microsoft PowerPoint
1 1 (1.02%) MS Visio
Business Applications
1 7 (7.14%) SAP S/4HANA
2 5 (5.10%) SAP MDG
3 3 (3.06%) Oracle BPM
3 3 (3.06%) SAP PLM
3 3 (3.06%) SAP VC
4 2 (2.04%) Aladdin
4 2 (2.04%) Misys Midas
4 2 (2.04%) Oracle Financials
4 2 (2.04%) Payment Gateway
4 2 (2.04%) SimCorp Dimension
5 1 (1.02%) Murex MxG2000
5 1 (1.02%) Oracle EBS
5 1 (1.02%) SAP IBP
5 1 (1.02%) SAP MDM
5 1 (1.02%) SAP Travel Management
Cloud Services
1 20 (20.41%) Azure
2 15 (15.31%) AWS
3 14 (14.29%) Azure DevOps
4 4 (4.08%) Amazon S3
4 4 (4.08%) OCI
5 3 (3.06%) Amazon ECS
5 3 (3.06%) Amazon Kinesis
5 3 (3.06%) Amazon SQS
5 3 (3.06%) AWS CloudFormation
5 3 (3.06%) AWS Fargate
5 3 (3.06%) AWS Lambda
5 3 (3.06%) GitHub
5 3 (3.06%) SaaS
5 3 (3.06%) Serverless
5 3 (3.06%) SuccessFactors
6 2 (2.04%) Amazon CloudWatch
6 2 (2.04%) Amazon EC2
6 2 (2.04%) AWS CodeBuild
6 2 (2.04%) GitHub Actions
7 1 (1.02%) Cloud Computing
Communications & Networking
1 3 (3.06%) 4G
1 3 (3.06%) 5G
1 3 (3.06%) Firewall
2 2 (2.04%) HTTP
3 1 (1.02%) Internet
3 1 (1.02%) SNMP
3 1 (1.02%) Software-Defined Radio
3 1 (1.02%) SSL
Database & Business Intelligence
1 5 (5.10%) PostgreSQL
2 4 (4.08%) MongoDB
3 3 (3.06%) DynamoDB
3 3 (3.06%) Relational Database
4 2 (2.04%) Amazon Athena
4 2 (2.04%) Amazon RDS
4 2 (2.04%) Apache Iceberg
4 2 (2.04%) MS Access
4 2 (2.04%) Oracle Reports
5 1 (1.02%) Apache Cassandra
5 1 (1.02%) DB2
5 1 (1.02%) Delta Lake
5 1 (1.02%) MariaDB
5 1 (1.02%) MySQL
5 1 (1.02%) NoSQL
5 1 (1.02%) Oracle Database
5 1 (1.02%) Oracle ODI
5 1 (1.02%) RDBMS
5 1 (1.02%) Star Schema
5 1 (1.02%) Tableau
Development Applications
1 14 (14.29%) JIRA
2 9 (9.18%) Jenkins
2 9 (9.18%) Selenium
3 8 (8.16%) GitLab
4 7 (7.14%) Appium
4 7 (7.14%) Git
4 7 (7.14%) SpecFlow
5 6 (6.12%) CircleCI
6 5 (5.10%) Gatling
6 5 (5.10%) TestComplete
7 4 (4.08%) Cucumber
7 4 (4.08%) Cypress.io
7 4 (4.08%) HP UFT
7 4 (4.08%) JMeter
7 4 (4.08%) JUnit
7 4 (4.08%) NeoLoad
8 3 (3.06%) Maven
9 2 (2.04%) Bitbucket
9 2 (2.04%) LoadRunner
9 2 (2.04%) Team Foundation Server
General
1 34 (34.69%) Social Skills
2 15 (15.31%) Finance
3 14 (14.29%) Analytical Skills
4 8 (8.16%) Banking
4 8 (8.16%) Public Sector
5 5 (5.10%) Inclusion and Diversity
6 4 (4.08%) Military
7 3 (3.06%) Front Office
7 3 (3.06%) Marketing
7 3 (3.06%) Pharmaceutical
7 3 (3.06%) Presentation Skills
8 2 (2.04%) Organisational Skills
8 2 (2.04%) Private Banking
9 1 (1.02%) Aviation
9 1 (1.02%) Back Office
9 1 (1.02%) Documentation Skills
9 1 (1.02%) Influencing Skills
9 1 (1.02%) Investment Banking
9 1 (1.02%) Retail
9 1 (1.02%) Telecoms
Job Titles
1 24 (24.49%) Developer
2 22 (22.45%) Analyst
3 12 (12.24%) Test Analyst
4 10 (10.20%) Test Manager
4 10 (10.20%) Tester
5 9 (9.18%) Consultant
5 9 (9.18%) Software Developer
6 7 (7.14%) Lead
6 7 (7.14%) Senior
6 7 (7.14%) Test Engineer
7 5 (5.10%) Artificial Intelligence Specialist
7 5 (5.10%) SAP Consultant
7 5 (5.10%) Software Test Engineer
8 4 (4.08%) Automation Tester
8 4 (4.08%) Business Analyst
8 4 (4.08%) Developer in Test
8 4 (4.08%) Java Automation Tester
8 4 (4.08%) Java Developer
8 4 (4.08%) SC Cleared Test Analyst
8 4 (4.08%) Senior Analyst
Libraries, Frameworks & Software Standards
1 12 (12.24%) Playwright
2 6 (6.12%) .NET
2 6 (6.12%) Spring
3 5 (5.10%) FastAPI
3 5 (5.10%) Kafka
3 5 (5.10%) Spring Boot
4 4 (4.08%) Play Framework
4 4 (4.08%) Web Services
4 4 (4.08%) XML
5 3 (3.06%) Jest
5 3 (3.06%) Oracle Fusion
5 3 (3.06%) REST
5 3 (3.06%) Swagger
6 2 (2.04%) CSS
6 2 (2.04%) Elastic Stack
6 2 (2.04%) JSON
6 2 (2.04%) OpenAPI
6 2 (2.04%) React
6 2 (2.04%) RESTful
6 2 (2.04%) Spring Batch
Miscellaneous
1 5 (5.10%) Derivative
2 4 (4.08%) Onboarding
3 3 (3.06%) Enterprise Software
3 3 (3.06%) Legacy Applications
3 3 (3.06%) Legacy Systems
3 3 (3.06%) PKI
3 3 (3.06%) Product Ownership
3 3 (3.06%) SCADA
4 2 (2.04%) AS400
4 2 (2.04%) EPoS
4 2 (2.04%) Foreign Exchange (FX)
4 2 (2.04%) iSeries
4 2 (2.04%) Self-Motivation
5 1 (1.02%) Credit Risk
5 1 (1.02%) Fixed Income
5 1 (1.02%) FMCG
5 1 (1.02%) Greenfield Project
5 1 (1.02%) Market Risk
5 1 (1.02%) N-Tier
5 1 (1.02%) Virtual Team
Operating Systems
1 9 (9.18%) Windows
2 7 (7.14%) Linux
3 3 (3.06%) AIX
3 3 (3.06%) Oracle Linux
3 3 (3.06%) Windows Server
4 2 (2.04%) Unix
5 1 (1.02%) Red Hat Enterprise Linux
Processes & Methodologies
1 43 (43.88%) Test Automation
2 41 (41.84%) User Acceptance Testing
3 37 (37.76%) Agile
4 27 (27.55%) Unit Testing
5 25 (25.51%) Problem-Solving
5 25 (25.51%) System Integration Testing
6 20 (20.41%) DevOps
7 19 (19.39%) Test Scripting
8 17 (17.35%) CI/CD
8 17 (17.35%) Performance Testing
8 17 (17.35%) Software Testing
9 15 (15.31%) End-to-End Testing
9 15 (15.31%) Migration
9 15 (15.31%) Scrum
10 14 (14.29%) System Testing
10 14 (14.29%) Test Management
10 14 (14.29%) Test Strategy
11 13 (13.27%) Test Planning
11 13 (13.27%) Validation
12 12 (12.24%) Stakeholder Management
Programming Languages
1 22 (22.45%) Python
2 19 (19.39%) Java
3 17 (17.35%) C#
3 17 (17.35%) SQL
4 13 (13.27%) JavaScript
5 9 (9.18%) TypeScript
6 5 (5.10%) C++
6 5 (5.10%) Ruby
7 4 (4.08%) ABAP
7 4 (4.08%) PHP
7 4 (4.08%) Scala
8 2 (2.04%) Bash
8 2 (2.04%) PL/SQL
8 2 (2.04%) PowerShell
8 2 (2.04%) RPG
9 1 (1.02%) Go
9 1 (1.02%) Shell Script
9 1 (1.02%) SOQL
Qualifications
1 27 (27.55%) Security Cleared
2 26 (26.53%) SC Cleared
3 6 (6.12%) Degree
4 3 (3.06%) BPSS Clearance
5 2 (2.04%) ISTQB
6 1 (1.02%) ISEB
6 1 (1.02%) ISTQB Advanced Certification
6 1 (1.02%) ISTQB Foundation Certification
6 1 (1.02%) PMI Certification
6 1 (1.02%) PMP
Quality Assurance & Compliance
1 23 (23.47%) QA
2 3 (3.06%) NCSC
3 2 (2.04%) Accessibility
3 2 (2.04%) Data Quality
3 2 (2.04%) Def Stans
3 2 (2.04%) GDPR
4 1 (1.02%) PMO
4 1 (1.02%) Software Quality Assurance
System Software
1 5 (5.10%) Docker
2 1 (1.02%) Active Directory
2 1 (1.02%) VMware Infrastructure
Systems Management
1 4 (4.08%) HP ALM
1 4 (4.08%) Kubernetes
2 3 (3.06%) Check_MK
2 3 (3.06%) HP Quality Center
3 2 (2.04%) Ansible
3 2 (2.04%) Control-M
3 2 (2.04%) Terraform
4 1 (1.02%) Grafana
4 1 (1.02%) Oracle Enterprise Manager
4 1 (1.02%) Progress Chef
4 1 (1.02%) Prometheus
4 1 (1.02%) Puppet
4 1 (1.02%) Rancher
Vendors
1 16 (16.33%) SAP
2 12 (12.24%) Oracle
3 7 (7.14%) HP
3 7 (7.14%) Microsoft
4 6 (6.12%) IBM
4 6 (6.12%) ServiceNow
5 4 (4.08%) Bloomberg
5 4 (4.08%) Reuters
6 3 (3.06%) Adobe
6 3 (3.06%) CA Agile Central
6 3 (3.06%) Cisco
6 3 (3.06%) Fortinet
6 3 (3.06%) Juniper
6 3 (3.06%) Murex
6 3 (3.06%) Salesforce
6 3 (3.06%) Siebel
6 3 (3.06%) Splunk
6 3 (3.06%) VMware
7 2 (2.04%) Citrix
7 2 (2.04%) SimCorp