Patch Management Job Trends in London

Patch Management
England > London

The table below provides summary statistics and salary benchmarking for jobs advertised in London requiring Patch Management skills. It covers permanent job vacancies from the 6 months leading up to 16 October 2025, with comparisons to the same periods in the previous two years.

6 months to
16 Oct 2025
Same period 2024 Same period 2023
Rank 326 366 392
Rank change year-on-year +40 +26 +232
Permanent jobs citing Patch Management 57 73 79
As % of all permanent jobs in London 0.49% 0.41% 0.39%
As % of the Processes & Methodologies category 0.52% 0.45% 0.41%
Number of salaries quoted 47 60 76
10th Percentile £31,500 £40,000 £42,500
25th Percentile £48,125 £45,938 £55,000
Median annual salary (50th Percentile) £75,000 £70,000 £75,000
Median % change year-on-year +7.14% -6.67% +38.89%
75th Percentile £78,750 £91,563 £86,250
90th Percentile £100,000 £95,000 £96,250
England median annual salary £45,000 £47,500 £55,000
% change year-on-year -5.26% -13.64% +15.79%

All Process and Methodology Skills
London

Patch Management falls under the Processes and Methodologies category. For comparison with the information above, the following table provides summary statistics for all permanent job vacancies requiring process or methodology skills in London.

Permanent vacancies with a requirement for process or methodology skills 10,998 16,062 19,142
As % of all permanent jobs advertised in London 93.77% 89.71% 93.72%
Number of salaries quoted 6,993 9,687 15,589
10th Percentile £37,500 £42,000 £42,000
25th Percentile £52,500 £56,250 £55,000
Median annual salary (50th Percentile) £75,000 £75,000 £75,000
Median % change year-on-year - - +3.45%
75th Percentile £97,500 £97,500 £95,000
90th Percentile £122,500 £120,000 £116,250
England median annual salary £55,000 £60,000 £60,800
% change year-on-year -8.33% -1.32% +1.33%

Patch Management
Job Vacancy Trend in London

Historical trend showing the proportion of permanent IT job postings citing Patch Management relative to all permanent IT jobs advertised in London.
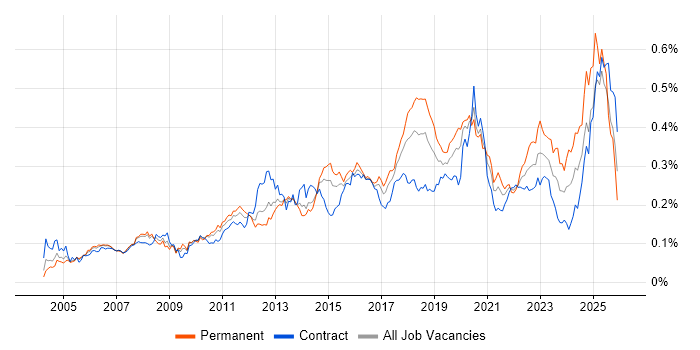
Patch Management job vacancy trend in London

Patch Management
Salary Trend in London

Salary distribution trend for jobs in London citing Patch Management.

Salary distribution trend for jobs in London citing Patch Management

Patch Management
Salary Histogram in London

Salary distribution for jobs citing Patch Management in London over the 6 months to 16 October 2025.

Salary histogram for Patch Management in London

Patch Management
Job Locations in London

The table below looks at the demand and provides a guide to the median salaries quoted in IT jobs citing Patch Management within the London region over the 6 months to 16 October 2025. The 'Rank Change' column provides an indication of the change in demand within each location based on the same 6 month period last year.

Location Rank Change
on Same Period
Last Year
Matching
Permanent
IT Job Ads
Median Salary
Past 6 Months
Median Salary
% Change
on Same Period
Last Year
Live
Jobs
Central London +58 19 £77,500 +10.71% 7
East London - 3 - -
North London - 1 £70,000 -
West London - 1 £45,000 - 1
Patch Management
England

Patch Management
Co-Occurring Skills & Capabilities in London by Category

The following tables expand on the one above by listing co-occurrences grouped by category. They cover the same employment type, locality and period, with up to 20 co-occurrences shown in each category:

Application Platforms
1 19 (33.33%) Microsoft Exchange
2 1 (1.75%) Oracle Workflow
Applications
1 4 (7.02%) Microsoft Excel
1 4 (7.02%) Microsoft PowerPoint
2 2 (3.51%) CINEMA 4D
Cloud Services
1 26 (45.61%) Microsoft 365
2 22 (38.60%) Azure
2 22 (38.60%) Entra ID
3 7 (12.28%) AWS
4 4 (7.02%) Azure Sentinel
5 3 (5.26%) Azure Key Vault
6 2 (3.51%) Adobe Creative Cloud
6 2 (3.51%) Azure Logic Apps
6 2 (3.51%) Nutanix
6 2 (3.51%) OneDrive
6 2 (3.51%) PaaS
7 1 (1.75%) Amazon CloudWatch
7 1 (1.75%) Amazon EC2
7 1 (1.75%) Amazon S3
7 1 (1.75%) AWS Lambda
7 1 (1.75%) Cloud Computing
7 1 (1.75%) Dynamics 365
7 1 (1.75%) Microsoft Purview
7 1 (1.75%) Mimecast
7 1 (1.75%) Tessian
Communications & Networking
1 27 (47.37%) DNS
2 25 (43.86%) WAN
3 24 (42.11%) DHCP
3 24 (42.11%) LAN
3 24 (42.11%) TCP/IP
4 8 (14.04%) Firewall
5 5 (8.77%) Wi-Fi
6 3 (5.26%) NAS
6 3 (5.26%) Network Security
6 3 (5.26%) SAN
6 3 (5.26%) VLAN
7 2 (3.51%) Junos
7 2 (3.51%) NetScaler
7 2 (3.51%) SD-WAN
7 2 (3.51%) Softphone
7 2 (3.51%) Wireless
8 1 (1.75%) DMARC
8 1 (1.75%) IP Telephony
Database & Business Intelligence
1 1 (1.75%) Amazon RDS
1 1 (1.75%) Power BI
1 1 (1.75%) SQL Server
Development Applications
1 5 (8.77%) GitLab
2 1 (1.75%) Artifactory
2 1 (1.75%) Git
2 1 (1.75%) Jenkins
General
1 32 (56.14%) Social Skills
2 30 (52.63%) Finance
3 14 (24.56%) Legal
4 10 (17.54%) Banking
5 6 (10.53%) Analytical Skills
6 2 (3.51%) Advertising
6 2 (3.51%) Law
6 2 (3.51%) Organisational Skills
7 1 (1.75%) Automotive
7 1 (1.75%) Avionics
7 1 (1.75%) Documentation Skills
7 1 (1.75%) Dutch Language
7 1 (1.75%) French Language
7 1 (1.75%) Inclusion and Diversity
Job Titles
1 13 (22.81%) Windows Engineer
2 11 (19.30%) Systems Engineer
3 10 (17.54%) Windows Systems Engineer
4 9 (15.79%) Infrastructure Engineer
5 7 (12.28%) IT Support
6 6 (10.53%) Analyst
7 5 (8.77%) Administrator
7 5 (8.77%) Infrastructure Support
7 5 (8.77%) Linux Administrator
7 5 (8.77%) Linux Systems Administrator
7 5 (8.77%) Security Engineer
7 5 (8.77%) Support Analyst
7 5 (8.77%) Systems Administrator
8 4 (7.02%) Desktop Analyst
8 4 (7.02%) Desktop Support
8 4 (7.02%) Desktop Support Analyst
8 4 (7.02%) IT Engineer
8 4 (7.02%) Systems Manager
8 4 (7.02%) Technical Support
8 4 (7.02%) Wintel Engineer
Libraries, Frameworks & Software Standards
1 3 (5.26%) SOAP
2 2 (3.51%) .NET
3 1 (1.75%) EDI
3 1 (1.75%) REST
3 1 (1.75%) Software Packaging
Miscellaneous
1 13 (22.81%) Enterprise Software
1 13 (22.81%) Hedge funds
2 7 (12.28%) Onboarding
3 6 (10.53%) Virtual Team
4 5 (8.77%) Data Centre
4 5 (8.77%) Hybrid Cloud
4 5 (8.77%) Management Information System
5 4 (7.02%) Security Posture
6 3 (5.26%) CMDB
7 2 (3.51%) CCTV
7 2 (3.51%) Handset
7 2 (3.51%) iPhone
7 2 (3.51%) Video Conferencing
8 1 (1.75%) AS400
8 1 (1.75%) Cyber Threat
8 1 (1.75%) Foreign Exchange (FX)
8 1 (1.75%) Mainframe
8 1 (1.75%) Tandem
8 1 (1.75%) Taxonomies
8 1 (1.75%) VxBlock/Vblock
Operating Systems
1 40 (70.18%) Windows
2 25 (43.86%) Windows Server
3 17 (29.82%) Windows Server 2012
4 12 (21.05%) Linux
5 6 (10.53%) Windows Server 2016
6 5 (8.77%) Red Hat Enterprise Linux
6 5 (8.77%) Windows 10
7 4 (7.02%) Android
7 4 (7.02%) Apple iOS
7 4 (7.02%) Mac OS
7 4 (7.02%) Windows Server 2019
8 2 (3.51%) VMS
Processes & Methodologies
1 19 (33.33%) Infrastructure Engineering
2 18 (31.58%) Collaborative Working
3 17 (29.82%) Batch Scripting
4 15 (26.32%) Systems Engineering
5 14 (24.56%) ITIL
5 14 (24.56%) Task Automation
6 12 (21.05%) Cybersecurity
7 11 (19.30%) Incident Management
7 11 (19.30%) Problem-Solving
8 10 (17.54%) Root Cause Analysis
9 9 (15.79%) Incident Response
9 9 (15.79%) ITSM
9 9 (15.79%) Service Management
10 7 (12.28%) Change Management
10 7 (12.28%) SIEM
11 6 (10.53%) DevOps
11 6 (10.53%) Performance Tuning
11 6 (10.53%) Problem Management
11 6 (10.53%) Process Improvement
11 6 (10.53%) Vulnerability Management
Programming Languages
1 25 (43.86%) PowerShell
2 5 (8.77%) Python
2 5 (8.77%) SQL
3 2 (3.51%) C#
4 1 (1.75%) Bash
4 1 (1.75%) JavaScript
4 1 (1.75%) Perl
Qualifications
1 5 (8.77%) Degree
1 5 (8.77%) Microsoft Certification
2 4 (7.02%) ITIL Foundation Certificate
3 3 (5.26%) Azure Certification
3 3 (5.26%) MCSE
3 3 (5.26%) VMware Certified Professional (VCP)
4 2 (3.51%) DV Cleared
4 2 (3.51%) Network+ Certification
4 2 (3.51%) Security Cleared
5 1 (1.75%) AWS Certification
5 1 (1.75%) CISA
5 1 (1.75%) CISM
5 1 (1.75%) Computer Science Degree
5 1 (1.75%) CRISC
5 1 (1.75%) Linux+ Certification
5 1 (1.75%) Master's Degree
5 1 (1.75%) MCSA
5 1 (1.75%) PMI Certification
5 1 (1.75%) PMP
5 1 (1.75%) SC Cleared
Quality Assurance & Compliance
1 6 (10.53%) SLA
2 5 (8.77%) QA
3 4 (7.02%) ISO/IEC 27001
4 3 (5.26%) GDPR
4 3 (5.26%) NIST
5 1 (1.75%) Cyber Essentials
5 1 (1.75%) Cyber Essentials PLUS
5 1 (1.75%) GRC
5 1 (1.75%) SOC 1
5 1 (1.75%) SOC 2
System Software
1 35 (61.40%) Active Directory
2 17 (29.82%) VMware Infrastructure
3 10 (17.54%) Hyper-V
4 3 (5.26%) VMware ESXi
5 2 (3.51%) Virtual Desktop
6 1 (1.75%) BitLocker
6 1 (1.75%) Docker
6 1 (1.75%) Firmware
6 1 (1.75%) KVM
6 1 (1.75%) vSphere
Systems Management
1 15 (26.32%) Microsoft Intune
2 14 (24.56%) Single Sign-On
3 13 (22.81%) Active Directory Federation Services
4 11 (19.30%) SCCM
5 4 (7.02%) NetBackup
5 4 (7.02%) SCOM
5 4 (7.02%) WSUS
6 3 (5.26%) Ansible
6 3 (5.26%) ZENworks
7 1 (1.75%) CASB
7 1 (1.75%) FortiGate
7 1 (1.75%) Jamf Pro
7 1 (1.75%) Puppet
7 1 (1.75%) QRadar
7 1 (1.75%) RSA Archer
7 1 (1.75%) vCenter Server
Vendors
1 38 (66.67%) Microsoft
2 18 (31.58%) VMware
3 13 (22.81%) Bloomberg
3 13 (22.81%) Reuters
4 10 (17.54%) ServiceNow
5 9 (15.79%) Citrix
6 7 (12.28%) SolarWinds
7 5 (8.77%) Veeam
8 3 (5.26%) Cisco
8 3 (5.26%) CrowdStrike
8 3 (5.26%) Juniper
8 3 (5.26%) Meraki
8 3 (5.26%) Qualys
9 2 (3.51%) Adobe
9 2 (3.51%) Commvault
9 2 (3.51%) CyberArk
9 2 (3.51%) HP
9 2 (3.51%) NetApp
10 1 (1.75%) Palo Alto
10 1 (1.75%) Thales