Shell Script Jobs in London

Shell Scripting (Shell Programming)
England > London

The table below provides summary statistics for permanent job vacancies advertised in London requiring Shell Script skills. It includes a benchmarking guide to the annual salaries offered in vacancies that cited Shell Script over the 6 months leading up to 26 October 2024, comparing them to the same period in the previous two years.

6 months to
26 Oct 2024
Same period 2023 Same period 2022
Rank 271 368 454
Rank change year-on-year +97 +86 -65
Permanent jobs citing Shell Script 205 113 393
As % of all permanent jobs advertised in London 1.09% 0.56% 0.69%
As % of the Programming Languages category 2.67% 1.24% 1.28%
Number of salaries quoted 45 97 192
10th Percentile £50,000 £56,500 £42,597
25th Percentile £60,000 £66,250 £53,063
Median annual salary (50th Percentile) £82,500 £75,000 £70,000
Median % change year-on-year +10.00% +7.14% -
75th Percentile £107,500 £90,000 £90,000
90th Percentile £116,250 £121,750 £122,500
England median annual salary £72,500 £68,000 £60,000
% change year-on-year +6.62% +13.33% -4.00%

All Programming Languages
London

Shell Script falls under the Programming Languages category. For comparison with the information above, the following table provides summary statistics for all permanent job vacancies requiring coding skills in London.

Permanent vacancies with a requirement for coding skills 7,673 9,111 30,657
As % of all permanent jobs advertised in London 40.75% 44.99% 53.67%
Number of salaries quoted 4,878 7,860 17,116
10th Percentile £50,000 £50,000 £46,250
25th Percentile £62,500 £61,250 £57,500
Median annual salary (50th Percentile) £82,500 £80,000 £75,000
Median % change year-on-year +3.13% +6.67% +3.45%
75th Percentile £108,750 £100,000 £96,250
90th Percentile £130,000 £125,000 £118,750
England median annual salary £65,000 £65,000 £65,000
% change year-on-year - - +8.33%

Shell Script
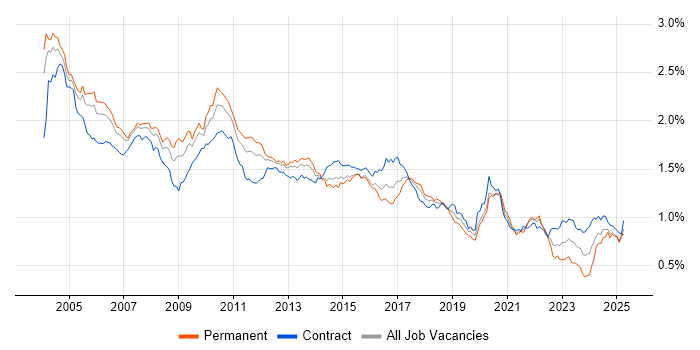
Job Vacancy Trend in London

Job postings citing Shell Script as a proportion of all IT jobs advertised in London.

Job vacancy trend for Shell Script in London

Shell Script
Salary Trend in London

3-month moving average salary quoted in jobs citing Shell Script in London.

Salary trend for Shell Script in London

Shell Script
Salary Histogram in London

Salary distribution for jobs citing Shell Script in London over the 6 months to 26 October 2024.

Salary histogram for Shell Script in London

Shell Script
Job Locations in London

The table below looks at the demand and provides a guide to the median salaries quoted in IT jobs citing Shell Script within the London region over the 6 months to 26 October 2024. The 'Rank Change' column provides an indication of the change in demand within each location based on the same 6 month period last year.

Location Rank Change
on Same Period
Last Year
Matching
Permanent
IT Job Ads
Median Salary
Past 6 Months
Median Salary
% Change
on Same Period
Last Year
Live
Jobs
Central London +35 72 £105,000 +10.53% 3
South London - 7 - -
West London -23 6 - -
Shell Script
England

Shell Script
Co-occurring Skills and Capabilities in London by Category

The follow tables expand on the table above by listing co-occurrences grouped by category. The same employment type, locality and period is covered with up to 20 co-occurrences shown in each of the following categories:

Application Platforms
1 13 (6.34%) Confluence
2 12 (5.85%) Apache
3 10 (4.88%) Oracle Collaboration Suite
4 6 (2.93%) IIS
4 6 (2.93%) Tomcat
5 2 (0.98%) Apache Airflow
5 2 (0.98%) Apache Spark
6 1 (0.49%) nginx
6 1 (0.49%) OpenStack
Applications
1 11 (5.37%) Microsoft Office
2 1 (0.49%) Adobe Creative Suite
2 1 (0.49%) InDesign
2 1 (0.49%) Photoshop
Business Applications
1 6 (2.93%) NEC Housing
2 2 (0.98%) Fidessa
3 1 (0.49%) FLEXCUBE
3 1 (0.49%) Oracle BPM
3 1 (0.49%) R3 Corda
Cloud Services
1 25 (12.20%) AWS
1 25 (12.20%) Azure
2 9 (4.39%) Azure DevOps
3 8 (3.90%) Amazon EKS
3 8 (3.90%) Serverless
4 7 (3.41%) Amazon EC2
4 7 (3.41%) Amazon ECS
4 7 (3.41%) GCP
5 6 (2.93%) Power Platform
6 3 (1.46%) Amazon SageMaker
6 3 (1.46%) Cloud Computing
7 2 (0.98%) Azure Cosmos DB
8 1 (0.49%) Amazon S3
8 1 (0.49%) AWS CloudFormation
8 1 (0.49%) AWS Lambda
8 1 (0.49%) dbt
8 1 (0.49%) Fivetran
8 1 (0.49%) Google Kubernetes Engine
8 1 (0.49%) Matillion
8 1 (0.49%) Snowflake
Communications & Networking
1 132 (64.39%) Broadband
2 11 (5.37%) 3GPP
3 7 (3.41%) DNS
4 6 (2.93%) TCP/IP
5 4 (1.95%) SAN
5 4 (1.95%) SSH
6 3 (1.46%) DHCP
6 3 (1.46%) tcpdump
6 3 (1.46%) Wireshark
7 2 (0.98%) FIX Connectivity
8 1 (0.49%) ATM
8 1 (0.49%) DAB
8 1 (0.49%) Internet
Database & Business Intelligence
1 13 (6.34%) SQL Server
2 12 (5.85%) PostgreSQL
3 10 (4.88%) MySQL
4 8 (3.90%) Tableau
5 7 (3.41%) Oracle Database
5 7 (3.41%) Relational Database
6 6 (2.93%) Data Warehouse
6 6 (2.93%) NoSQL
6 6 (2.93%) Power BI
6 6 (2.93%) RDBMS
7 3 (1.46%) Data Lake
7 3 (1.46%) KDB
7 3 (1.46%) MongoDB
8 2 (0.98%) Big Data
8 2 (0.98%) Hadoop
8 2 (0.98%) Snowflake Schema
9 1 (0.49%) Amazon RDS
9 1 (0.49%) Azure SQL Database
9 1 (0.49%) DynamoDB
Development Applications
1 24 (11.71%) Jenkins
2 15 (7.32%) Git
3 10 (4.88%) GitLab
4 8 (3.90%) TeamCity
5 6 (2.93%) JMeter
5 6 (2.93%) JUnit
5 6 (2.93%) Mockito
6 5 (2.44%) JIRA
7 4 (1.95%) Maven
8 3 (1.46%) Gradle
8 3 (1.46%) Sonatype Nexus
8 3 (1.46%) Spinnaker
9 2 (0.98%) MLflow
10 1 (0.49%) Artifactory
10 1 (0.49%) GoCD
10 1 (0.49%) Octopus Deploy
10 1 (0.49%) Selenium
General
1 149 (72.68%) Social Skills
2 135 (65.85%) Analytical Skills
3 35 (17.07%) Finance
4 23 (11.22%) Banking
5 13 (6.34%) Public Sector
6 10 (4.88%) Billing
6 10 (4.88%) Telecoms
7 9 (4.39%) Advertising
7 9 (4.39%) Front Office
7 9 (4.39%) Inclusion and Diversity
8 6 (2.93%) Local Government
8 6 (2.93%) Police
9 4 (1.95%) Back Office
10 3 (1.46%) Influencing Skills
11 2 (0.98%) Legal
11 2 (0.98%) Presentation Skills
12 1 (0.49%) Automotive
12 1 (0.49%) Investment Banking
12 1 (0.49%) Prime Brokerage
12 1 (0.49%) Publishing
Job Titles
1 117 (57.07%) Lead
2 113 (55.12%) Team Leader
3 18 (8.78%) Analyst
4 13 (6.34%) Developer
5 12 (5.85%) Applications Support
6 10 (4.88%) Support Specialist
6 10 (4.88%) Technical Specialist
6 10 (4.88%) Technical Support
6 10 (4.88%) Technical Support Specialist
7 9 (4.39%) Operations Analyst
7 9 (4.39%) Service Analyst
7 9 (4.39%) Service Operations Analyst
8 7 (3.41%) Java Developer
8 7 (3.41%) Junior
9 6 (2.93%) Data Engineer
9 6 (2.93%) DevOps Engineer
9 6 (2.93%) Senior
10 5 (2.44%) Full-Stack Developer
10 5 (2.44%) Graduate
10 5 (2.44%) Graduate Analyst
Libraries, Frameworks & Software Standards
1 114 (55.61%) Elastic Stack
2 23 (11.22%) REST
3 17 (8.29%) XML
4 13 (6.34%) Web Services
5 11 (5.37%) HTML
6 9 (4.39%) Spring
7 8 (3.90%) jQuery
8 7 (3.41%) Apache Camel
8 7 (3.41%) Hibernate
8 7 (3.41%) Spring Boot
9 6 (2.93%) ActiveMQ
9 6 (2.93%) WireMock
10 5 (2.44%) JSON
10 5 (2.44%) PyTorch
10 5 (2.44%) React
10 5 (2.44%) TensorFlow
11 4 (1.95%) Kafka
11 4 (1.95%) Node.js
11 4 (1.95%) RESTful
12 3 (1.46%) Middleware
Miscellaneous
1 113 (55.12%) Private Cloud
2 10 (4.88%) Wiki
3 9 (4.39%) Algorithms
3 9 (4.39%) Onboarding
4 7 (3.41%) Distributed Systems
5 6 (2.93%) Public Cloud
6 4 (1.95%) Self-Motivation
7 3 (1.46%) Equities
7 3 (1.46%) Team-Oriented Environment
8 2 (0.98%) Derivative
8 2 (0.98%) Eurex
8 2 (0.98%) Fixed Income
8 2 (0.98%) Management Information System
8 2 (0.98%) Virtual Team
8 2 (0.98%) VWAP
9 1 (0.49%) Clustering
9 1 (0.49%) Data Structures
9 1 (0.49%) DataPower
9 1 (0.49%) IoT
9 1 (0.49%) Replication
Operating Systems
1 143 (69.76%) Linux
2 58 (28.29%) Unix
3 15 (7.32%) Windows
4 12 (5.85%) Solaris
5 6 (2.93%) Red Hat Enterprise Linux
6 4 (1.95%) AIX
6 4 (1.95%) CentOS
7 3 (1.46%) Ubuntu
8 1 (0.49%) Android
8 1 (0.49%) Apple iOS
8 1 (0.49%) Mac OS
8 1 (0.49%) VMS
8 1 (0.49%) Windows Server
Processes & Methodologies
1 155 (75.61%) CI/CD
2 147 (71.71%) Computer Science
2 147 (71.71%) DevOps
3 131 (63.90%) Problem-Solving
4 125 (60.98%) Containerisation
5 123 (60.00%) Task Automation
6 121 (59.02%) Configuration Management
7 120 (58.54%) Continuous Integration
8 119 (58.05%) Mentoring
8 119 (58.05%) Roadmaps
9 116 (56.59%) Continuous Improvement
10 114 (55.61%) Continuous Deployment
10 114 (55.61%) Deployment Automation
10 114 (55.61%) Product Roadmap
10 114 (55.61%) Validation
11 113 (55.12%) Observability
11 113 (55.12%) Site Reliability Engineering
12 33 (16.10%) Agile
13 24 (11.71%) SDLC
14 14 (6.83%) Business Case
Programming Languages
1 157 (76.59%) Python
2 121 (59.02%) Bash
3 52 (25.37%) SQL
4 30 (14.63%) Java
5 14 (6.83%) JavaScript
6 11 (5.37%) Groovy
7 7 (3.41%) Perl
7 7 (3.41%) PowerShell
8 4 (1.95%) R
9 3 (1.46%) Ruby
10 2 (0.98%) C++
10 2 (0.98%) Scala
11 1 (0.49%) C
11 1 (0.49%) Go
11 1 (0.49%) JSX
11 1 (0.49%) Kotlin
11 1 (0.49%) PL/SQL
11 1 (0.49%) T-SQL
11 1 (0.49%) TypeScript
Qualifications
1 164 (80.00%) Degree
2 144 (70.24%) Computer Science Degree
3 120 (58.54%) Master's Degree
4 113 (55.12%) LPIC
4 113 (55.12%) RHCSA
5 9 (4.39%) Security Cleared
6 3 (1.46%) Linux+ Certification
6 3 (1.46%) RHCE
6 3 (1.46%) SC Cleared
Quality Assurance & Compliance
1 113 (55.12%) NIST
1 113 (55.12%) SOC 2
2 9 (4.39%) Accessibility
3 4 (1.95%) SLA
4 2 (0.98%) Data Quality
4 2 (0.98%) QA
System Software
1 125 (60.98%) Docker
2 7 (3.41%) Virtual Machines
3 4 (1.95%) LXC
3 4 (1.95%) Squid
3 4 (1.95%) VMware Infrastructure
4 3 (1.46%) KVM
5 1 (0.49%) Active Directory
5 1 (0.49%) VirtualBox
Systems Management
1 127 (61.95%) Ansible
2 121 (59.02%) Prometheus
3 120 (58.54%) Grafana
4 14 (6.83%) Kubernetes
5 10 (4.88%) Amdocs OSS
6 8 (3.90%) Terraform
7 7 (3.41%) Progress Chef
8 6 (2.93%) Kibana
9 5 (2.44%) Puppet
10 4 (1.95%) Opsview
11 1 (0.49%) CFEngine
11 1 (0.49%) Consul
11 1 (0.49%) Core Impact
Vendors
1 21 (10.24%) Oracle
2 15 (7.32%) Splunk
3 12 (5.85%) Microsoft
4 11 (5.37%) Murex
4 11 (5.37%) VMware
5 10 (4.88%) Amdocs
5 10 (4.88%) Red Hat
6 6 (2.93%) Dynatrace
6 6 (2.93%) NEC
7 5 (2.44%) Google
8 4 (1.95%) IBM
8 4 (1.95%) Infoblox
9 3 (1.46%) Bloomberg
9 3 (1.46%) MicroStrategy
9 3 (1.46%) SaltStack
10 2 (0.98%) Alteryx
10 2 (0.98%) CQG
10 2 (0.98%) ION Trading
10 2 (0.98%) Patsystems
10 2 (0.98%) Trayport