REST Jobs in London

Representational State Transfer (REST)
England > London

The table below provides summary statistics for permanent job vacancies advertised in London requiring REST skills. It includes a benchmarking guide to the annual salaries offered in vacancies that cited REST over the 6 months leading up to 2 April 2025, comparing them to the same period in the previous two years.

6 months to
2 Apr 2025
Same period 2024 Same period 2023
Rank 104 99 69
Rank change year-on-year -5 -30 -14
Permanent jobs citing REST 434 645 1,723
As % of all permanent jobs advertised in London 3.31% 2.86% 4.48%
As % of the Libraries, Frameworks & Software Standards category 12.47% 11.30% 12.92%
Number of salaries quoted 232 546 1,116
10th Percentile £51,325 £50,250 £50,000
25th Percentile £65,938 £61,250 £61,250
Median annual salary (50th Percentile) £77,500 £75,000 £79,071
Median % change year-on-year +3.33% -5.15% +5.43%
75th Percentile £96,563 £100,000 £97,500
90th Percentile £126,750 £114,375 £112,500
England median annual salary £70,000 £60,000 £70,000
% change year-on-year +16.67% -14.29% +3.70%

All Software Libraries and Frameworks
London

REST falls under the Software Libraries and Frameworks category. For comparison with the information above, the following table provides summary statistics for all permanent job vacancies requiring technical specification, industry standards, software libraries and framework skills in London.

Permanent vacancies with a requirement for technical specification, industry standards, software libraries and framework skills 3,479 5,709 13,340
As % of all permanent jobs advertised in London 26.50% 25.30% 34.67%
Number of salaries quoted 2,496 4,738 9,186
10th Percentile £50,000 £47,713 £50,000
25th Percentile £62,500 £60,000 £62,500
Median annual salary (50th Percentile) £82,500 £80,000 £80,000
Median % change year-on-year +3.13% - +6.10%
75th Percentile £110,000 £100,000 £100,000
90th Percentile £125,000 £122,500 £120,000
England median annual salary £66,254 £60,000 £67,500
% change year-on-year +10.42% -11.11% +3.85%

REST
Job Vacancy Trend in London

Job postings citing REST as a proportion of all IT jobs advertised in London.
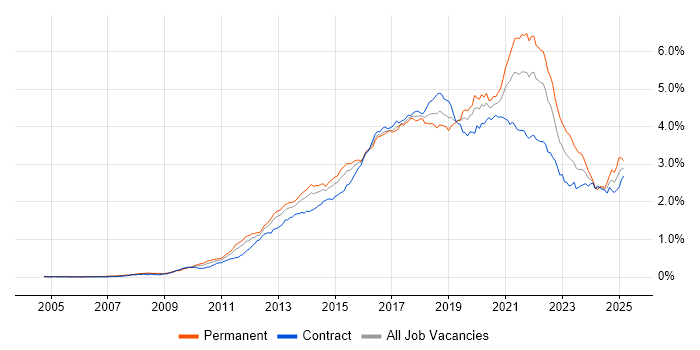
Job vacancy trend for REST in London

REST
Salary Trend in London

3-month moving average salary quoted in jobs citing REST in London.

Salary trend for REST in London

REST
Salary Histogram in London

Salary distribution for jobs citing REST in London over the 6 months to 2 April 2025.

Salary histogram for REST in London

REST
Job Locations in London

The table below looks at the demand and provides a guide to the median salaries quoted in IT jobs citing REST within the London region over the 6 months to 2 April 2025. The 'Rank Change' column provides an indication of the change in demand within each location based on the same 6 month period last year.

Location Rank Change
on Same Period
Last Year
Matching
Permanent
IT Job Ads
Median Salary
Past 6 Months
Median Salary
% Change
on Same Period
Last Year
Live
Jobs
South London +9 81 £65,000 -16.13% 6
Central London -42 76 £75,000 -21.05% 23
West London +20 12 £75,000 +3.45% 3
North London - 11 - - 1
East London +1 1 £92,500 +32.14% 7
REST
England

REST
Co-occurring Skills and Capabilities in London by Category

The follow tables expand on the table above by listing co-occurrences grouped by category. The same employment type, locality and period is covered with up to 20 co-occurrences shown in each of the following categories:

Application Platforms
1 12 (2.76%) Apache Airflow
2 11 (2.53%) Apache Spark
2 11 (2.53%) JBoss
2 11 (2.53%) Red Hat Fuse
3 9 (2.07%) Confluence
3 9 (2.07%) nginx
4 6 (1.38%) OpenStack
4 6 (1.38%) SharePoint
5 5 (1.15%) OpenEdge
6 4 (0.92%) Apache
6 4 (0.92%) Cloud Foundry
7 3 (0.69%) Microsoft Exchange
7 3 (0.69%) Mule
8 2 (0.46%) Appian
8 2 (0.46%) CMS
8 2 (0.46%) Oracle Coherence
8 2 (0.46%) Oracle SOA Suite
8 2 (0.46%) Tomcat
9 1 (0.23%) Oracle Workflow
9 1 (0.23%) SharePoint Server
Applications
1 5 (1.15%) Chatbot
2 2 (0.46%) Adobe Creative Suite
2 2 (0.46%) InDesign
2 2 (0.46%) Microsoft Excel
2 2 (0.46%) Photoshop
3 1 (0.23%) Microsoft PowerPoint
Business Applications
1 3 (0.69%) Dynamics CRM
2 2 (0.46%) Dynamics NAV
2 2 (0.46%) Workday HCM
3 1 (0.23%) Elite 3E
3 1 (0.23%) Oracle EBS
3 1 (0.23%) Oracle EBS R12
3 1 (0.23%) SAP CO
3 1 (0.23%) SAP FI
3 1 (0.23%) SAP FI/CO
3 1 (0.23%) SimCorp Dimension
3 1 (0.23%) Temenos T24
Cloud Services
1 245 (56.45%) AWS
2 126 (29.03%) Serverless
3 90 (20.74%) Amazon S3
4 86 (19.82%) Amazon SQS
5 84 (19.35%) GitHub
6 82 (18.89%) Azure
7 78 (17.97%) AWS Lambda
8 74 (17.05%) Amazon Kinesis
9 56 (12.90%) SaaS
10 53 (12.21%) GCP
11 36 (8.29%) Amazon EC2
12 35 (8.06%) Amazon ECS
13 33 (7.60%) Amazon EKS
14 21 (4.84%) Power Platform
15 18 (4.15%) Azure DevOps
16 11 (2.53%) dbt
17 10 (2.30%) Dynamics 365
18 9 (2.07%) Azure Synapse Analytics
19 8 (1.84%) Microsoft Purview
20 7 (1.61%) MinIO
Communications & Networking
1 11 (2.53%) HTTP
2 4 (0.92%) Internet
3 3 (0.69%) DNS
4 2 (0.46%) Firewall
4 2 (0.46%) FTP
4 2 (0.46%) TCP/IP
4 2 (0.46%) Value-Added Service
5 1 (0.23%) AMQP
5 1 (0.23%) DHCP
5 1 (0.23%) SSH
5 1 (0.23%) X.21
Database & Business Intelligence
1 173 (39.86%) PostgreSQL
2 79 (18.20%) Redis
3 78 (17.97%) DynamoDB
4 52 (11.98%) Relational Database
5 44 (10.14%) NoSQL
6 33 (7.60%) SQL Server
7 31 (7.14%) MongoDB
8 26 (5.99%) RDBMS
9 19 (4.38%) Power BI
10 11 (2.53%) Apache Hive
11 9 (2.07%) SQL Server Reporting Services
12 7 (1.61%) Amazon RDS
12 7 (1.61%) MySQL
12 7 (1.61%) SQL Server Integration Services
13 6 (1.38%) Elasticsearch
14 3 (0.69%) Amazon Aurora
14 3 (0.69%) Azure SQL Database
14 3 (0.69%) Data Lake
15 2 (0.46%) Oracle Database
15 2 (0.46%) Tableau
Development Applications
1 135 (31.11%) Jenkins
2 77 (17.74%) Git
3 43 (9.91%) JUnit
4 28 (6.45%) JIRA
5 27 (6.22%) GitLab
6 23 (5.30%) JMeter
7 21 (4.84%) Mockito
8 20 (4.61%) SonarQube
9 19 (4.38%) Maven
10 17 (3.92%) Postman
11 14 (3.23%) IntelliJ
12 13 (3.00%) Sonatype Nexus
13 11 (2.53%) Selenium
14 10 (2.30%) REST Assured
15 8 (1.84%) Cypress.io
15 8 (1.84%) Visual Studio
16 7 (1.61%) SoapUI
17 6 (1.38%) Cucumber
17 6 (1.38%) Gatling
17 6 (1.38%) Xcode
General
1 92 (21.20%) Finance
2 86 (19.82%) Marketing
3 81 (18.66%) Advertising
4 77 (17.74%) Inclusion and Diversity
4 77 (17.74%) Social Skills
5 44 (10.14%) Public Sector
6 31 (7.14%) Analytical Skills
7 26 (5.99%) Banking
8 23 (5.30%) Games
9 15 (3.46%) Legal
10 14 (3.23%) Publishing
11 13 (3.00%) Front Office
12 11 (2.53%) iGaming
13 10 (2.30%) Manufacturing
14 8 (1.84%) Telecoms
15 7 (1.61%) Electronics
16 6 (1.38%) Presentation Skills
17 5 (1.15%) Investment Banking
17 5 (1.15%) Organisational Skills
17 5 (1.15%) Retail
Job Titles
1 129 (29.72%) Developer
2 100 (23.04%) Software Engineer
3 89 (20.51%) Senior
4 50 (11.52%) Java Developer
5 40 (9.22%) Architect
6 38 (8.76%) Lead
7 33 (7.60%) Full-Stack Engineer
7 33 (7.60%) Senior Developer
8 30 (6.91%) Python Engineer
9 27 (6.22%) Full-Stack Developer
10 22 (5.07%) Java Engineer
11 15 (3.46%) Automation Engineer
11 15 (3.46%) GCP Engineer
11 15 (3.46%) Python Developer
12 14 (3.23%) Platform Engineer
12 14 (3.23%) Senior Java Engineer
13 13 (3.00%) Backend Developer
14 12 (2.76%) C# Developer
14 12 (2.76%) Full-Stack Java Developer
15 11 (2.53%) Technical Architect
Libraries, Frameworks & Software Standards
1 181 (41.71%) React
2 108 (24.88%) AngularJS
2 108 (24.88%) Node.js
3 84 (19.35%) Web Services
4 83 (19.12%) SOAP
5 74 (17.05%) Tailwind CSS
6 60 (13.82%) Spring
7 56 (12.90%) .NET
8 50 (11.52%) HTML
9 45 (10.37%) Spring Boot
10 43 (9.91%) GraphQL
11 34 (7.83%) XML
12 31 (7.14%) CSS
12 31 (7.14%) JSON
13 30 (6.91%) Hibernate
14 29 (6.68%) Django
14 29 (6.68%) Middleware
15 28 (6.45%) RESTful
16 27 (6.22%) Apache Camel
16 27 (6.22%) FastAPI
Miscellaneous
1 75 (17.28%) Blog
2 74 (17.05%) Digital Media
3 44 (10.14%) Distributed Systems
4 22 (5.07%) Product Ownership
5 17 (3.92%) Cloud Native
6 16 (3.69%) Mobile Games
7 14 (3.23%) Mobile App
8 12 (2.76%) Enterprise Software
8 12 (2.76%) Sports Betting
9 11 (2.53%) Distributed Computing
9 11 (2.53%) Public Cloud
10 10 (2.30%) Data Structures
11 7 (1.61%) Online Games
12 5 (1.15%) Hybrid Cloud
12 5 (1.15%) Management Information System
12 5 (1.15%) Onboarding
12 5 (1.15%) Reinsurance
13 4 (0.92%) Legacy Systems
14 3 (0.69%) Algorithms
14 3 (0.69%) Low-Code
Operating Systems
1 22 (5.07%) Linux
2 13 (3.00%) Apple iOS
3 12 (2.76%) Android
4 10 (2.30%) Windows
5 7 (1.61%) Unix
5 7 (1.61%) Windows Server
6 5 (1.15%) Red Hat Enterprise Linux
7 2 (0.46%) CentOS
7 2 (0.46%) Mac OS
7 2 (0.46%) Solaris
8 1 (0.23%) Debian
8 1 (0.23%) Windows Server 2016
8 1 (0.23%) Windows Server 2019
Processes & Methodologies
1 240 (55.30%) Agile
2 155 (35.71%) Full-Stack Development
3 151 (34.79%) Software Engineering
4 142 (32.72%) Scrum
5 121 (27.88%) Problem-Solving
6 111 (25.58%) CI/CD
7 99 (22.81%) User Experience
8 97 (22.35%) Microservices
9 89 (20.51%) Continuous Delivery
10 82 (18.89%) E-Commerce
11 81 (18.66%) Containerisation
12 80 (18.43%) DevOps
13 77 (17.74%) TDD
14 74 (17.05%) Epics
15 59 (13.59%) Test Automation
16 52 (11.98%) Kanban
17 50 (11.52%) Roadmaps
18 39 (8.99%) BDD
18 39 (8.99%) SDLC
19 38 (8.76%) Mentoring
Programming Languages
1 145 (33.41%) Python
2 140 (32.26%) TypeScript
3 103 (23.73%) Java
4 89 (20.51%) SQL
5 88 (20.28%) JavaScript
6 48 (11.06%) C#
7 22 (5.07%) Shell Script
8 20 (4.61%) PowerShell
9 10 (2.30%) Bash
10 7 (1.61%) PL/SQL
10 7 (1.61%) T-SQL
11 6 (1.38%) Scala
11 6 (1.38%) Swift
12 5 (1.15%) Groovy
12 5 (1.15%) OpenEdge ABL
12 5 (1.15%) Progress 4GL
13 4 (0.92%) Perl
14 3 (0.69%) Apex Code
14 3 (0.69%) C
14 3 (0.69%) Go
Qualifications
1 49 (11.29%) Degree
2 34 (7.83%) Security Cleared
3 32 (7.37%) SC Cleared
4 27 (6.22%) Master's Degree
5 14 (3.23%) PhD
6 11 (2.53%) Computer Science Degree
7 8 (1.84%) ISTQB
8 3 (0.69%) ISTQB Foundation Certification
8 3 (0.69%) Numerate Degree
9 2 (0.46%) BPSS Clearance
9 2 (0.46%) Microsoft Certification
10 1 (0.23%) Azure Certification
10 1 (0.23%) CISSP
10 1 (0.23%) DBS Check
10 1 (0.23%) DV Cleared
10 1 (0.23%) ITIL Certification
Quality Assurance & Compliance
1 36 (8.29%) QA
2 11 (2.53%) SLA
3 8 (1.84%) Accessibility
4 3 (0.69%) CDISC
5 2 (0.46%) GDPR
5 2 (0.46%) MiFID
5 2 (0.46%) SEPA
6 1 (0.23%) Data Quality
6 1 (0.23%) ISO/IEC 27001
6 1 (0.23%) PCI DSS
6 1 (0.23%) Sarbanes-Oxley
System Software
1 212 (48.85%) Docker
2 6 (1.38%) VMware ESXi
3 2 (0.46%) Active Directory
3 2 (0.46%) Firmware
3 2 (0.46%) Virtual Machines
4 1 (0.23%) Apache ZooKeeper
4 1 (0.23%) VMware Infrastructure
4 1 (0.23%) vSphere
Systems Management
1 209 (48.16%) Kubernetes
2 49 (11.29%) Terraform
3 36 (8.29%) Ansible
4 21 (4.84%) Kibana
5 8 (1.84%) Istio
6 7 (1.61%) Grafana
7 4 (0.92%) Argo
7 4 (0.92%) Kustomize
8 3 (0.69%) Microsoft Intune
9 2 (0.46%) MIIS
10 1 (0.23%) CloudHub
10 1 (0.23%) Consul
10 1 (0.23%) HP Quality Center
10 1 (0.23%) logstash
10 1 (0.23%) Red Hat Satellite
10 1 (0.23%) RSA Archer
10 1 (0.23%) vCenter Server
Vendors
1 43 (9.91%) Google
2 35 (8.06%) Microsoft
3 18 (4.15%) Oracle
4 17 (3.92%) Splunk
5 16 (3.69%) Dynatrace
6 13 (3.00%) ServiceNow
7 12 (2.76%) SAP
8 11 (2.53%) Databricks
9 7 (1.61%) VMware
10 6 (1.38%) Atlassian
11 5 (1.15%) Red Hat
12 4 (0.92%) Ping Identity
12 4 (0.92%) Salesforce
13 3 (0.69%) Adobe
13 3 (0.69%) CA Agile Central
13 3 (0.69%) Progress
14 2 (0.46%) Bloomberg
14 2 (0.46%) Reuters
14 2 (0.46%) Solace
14 2 (0.46%) Workday