Project Delivery Jobs in London

Project Delivery
England > London

The table below provides summary statistics for permanent job vacancies advertised in London requiring Project Delivery skills. It includes a benchmarking guide to the annual salaries offered in vacancies that cited Project Delivery over the 6 months leading up to 26 October 2024, comparing them to the same period in the previous two years.

6 months to
26 Oct 2024
Same period 2023 Same period 2022
Rank 87 47 90
Rank change year-on-year -40 +43 -9
Permanent jobs citing Project Delivery 677 1,092 2,212
As % of all permanent jobs advertised in London 3.60% 5.39% 3.87%
As % of the Processes & Methodologies category 3.96% 5.75% 4.02%
Number of salaries quoted 359 756 1,371
10th Percentile £47,500 £47,513 £46,250
25th Percentile £53,750 £57,500 £57,500
Median annual salary (50th Percentile) £70,000 £70,000 £72,500
Median % change year-on-year - -3.45% +3.57%
75th Percentile £88,750 £90,000 £90,000
90th Percentile £104,000 £107,500 £111,250
England median annual salary £57,500 £60,800 £60,000
% change year-on-year -5.43% +1.33% -

All Process and Methodology Skills
London

Project Delivery falls under the Processes and Methodologies category. For comparison with the information above, the following table provides summary statistics for all permanent job vacancies requiring process or methodology skills in London.

Permanent vacancies with a requirement for process or methodology skills 17,085 18,990 55,074
As % of all permanent jobs advertised in London 90.73% 93.77% 96.41%
Number of salaries quoted 9,327 15,254 32,458
10th Percentile £42,500 £41,750 £42,500
25th Percentile £56,250 £55,000 £55,000
Median annual salary (50th Percentile) £75,000 £75,000 £72,500
Median % change year-on-year - +3.45% +3.57%
75th Percentile £97,500 £95,000 £92,500
90th Percentile £120,000 £116,250 £112,500
England median annual salary £60,000 £60,000 £60,000
% change year-on-year - - +4.35%

Project Delivery
Job Vacancy Trend in London

Job postings citing Project Delivery as a proportion of all IT jobs advertised in London.
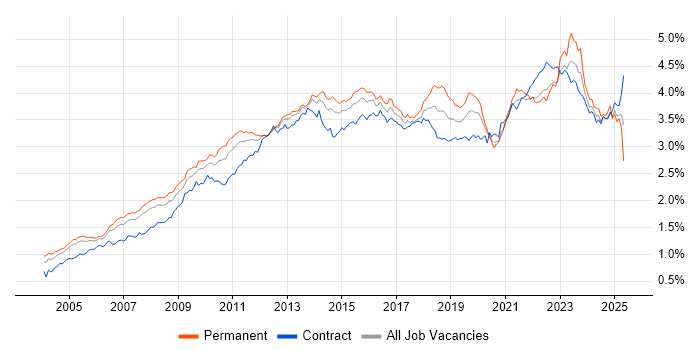
Job vacancy trend for Project Delivery in London

Project Delivery
Salary Trend in London

3-month moving average salary quoted in jobs citing Project Delivery in London.

Salary trend for Project Delivery in London

Project Delivery
Salary Histogram in London

Salary distribution for jobs citing Project Delivery in London over the 6 months to 26 October 2024.

Salary histogram for Project Delivery in London

Project Delivery
Job Locations in London

The table below looks at the demand and provides a guide to the median salaries quoted in IT jobs citing Project Delivery within the London region over the 6 months to 26 October 2024. The 'Rank Change' column provides an indication of the change in demand within each location based on the same 6 month period last year.

Location Rank Change
on Same Period
Last Year
Matching
Permanent
IT Job Ads
Median Salary
Past 6 Months
Median Salary
% Change
on Same Period
Last Year
Live
Jobs
Central London -19 150 £80,000 +6.67% 34
South London -34 39 £50,000 -9.09% 2
West London -12 38 £55,750 +3.72% 16
East London -5 8 £42,500 -59.52% 4
North London -13 2 £71,250 -
Project Delivery
England

Project Delivery
Co-occurring Skills and Capabilities in London by Category

The follow tables expand on the table above by listing co-occurrences grouped by category. The same employment type, locality and period is covered with up to 20 co-occurrences shown in each of the following categories:

Application Platforms
1 35 (5.17%) Confluence
2 20 (2.95%) SharePoint
3 12 (1.77%) Apache Spark
4 11 (1.62%) Microsoft Exchange
5 5 (0.74%) TPMS
6 4 (0.59%) Apache
6 4 (0.59%) Apache Airflow
6 4 (0.59%) Oracle SOA Suite
7 3 (0.44%) ArcGIS
8 2 (0.30%) CMS
9 1 (0.15%) Sitecore CMS
9 1 (0.15%) WebSphere
Applications
1 31 (4.58%) Microsoft Office
2 26 (3.84%) Microsoft Excel
3 11 (1.62%) Microsoft Project
4 9 (1.33%) MS Visio
5 7 (1.03%) AutoCAD
6 5 (0.74%) Microsoft PowerPoint
6 5 (0.74%) Trello
7 3 (0.44%) Revit
8 2 (0.30%) Adobe Creative Suite
9 1 (0.15%) Maya
9 1 (0.15%) UserZoom
Business Applications
1 18 (2.66%) SAP S/4HANA
2 17 (2.51%) Dynamics CRM
3 8 (1.18%) Remedy ITSM
4 6 (0.89%) SAP PP
5 5 (0.74%) Elite 3E
5 5 (0.74%) Shopify
6 4 (0.59%) Oracle EBS
6 4 (0.59%) SAP SD
7 3 (0.44%) Endur
7 3 (0.44%) NEC Housing
7 3 (0.44%) Payment Gateway
7 3 (0.44%) SAP BPC
7 3 (0.44%) SAP CO
7 3 (0.44%) SAP FI
7 3 (0.44%) SAP FI/CO
8 2 (0.30%) BASE24
8 2 (0.30%) NetSuite
8 2 (0.30%) SAP ERP
8 2 (0.30%) SAP IBP
9 1 (0.15%) Dynamics GP
Cloud Services
1 120 (17.73%) Azure
2 84 (12.41%) AWS
3 55 (8.12%) Microsoft 365
4 39 (5.76%) GCP
5 35 (5.17%) Power Platform
6 26 (3.84%) Veeva
7 20 (2.95%) Entra ID
8 19 (2.81%) SaaS
9 15 (2.22%) Azure DevOps
9 15 (2.22%) Dynamics 365
10 13 (1.92%) Figma
10 13 (1.92%) PaaS
11 12 (1.77%) Miro
12 11 (1.62%) IaaS
13 10 (1.48%) Cloud Computing
13 10 (1.48%) OCI
14 8 (1.18%) Azure Monitor
14 8 (1.18%) Azure Storage
14 8 (1.18%) PowerApps
15 7 (1.03%) Power Automate
Communications & Networking
1 42 (6.20%) DNS
2 31 (4.58%) Firewall
3 28 (4.14%) DHCP
4 27 (3.99%) Structured Cabling
5 25 (3.69%) Wi-Fi
6 22 (3.25%) Network Security
7 20 (2.95%) Unified Communications
8 19 (2.81%) Broadband
9 18 (2.66%) WAN
10 15 (2.22%) LAN
11 11 (1.62%) BIG-IP
11 11 (1.62%) Cisco Nexus
11 11 (1.62%) F5 BIG-IP GTM
11 11 (1.62%) F5 BIG-IP LTM
12 9 (1.33%) Wireless
13 8 (1.18%) HTTP
13 8 (1.18%) VPN
14 6 (0.89%) FTP
15 5 (0.74%) HTTPS
15 5 (0.74%) IP Telephony
Database & Business Intelligence
1 43 (6.35%) Data Warehouse
2 30 (4.43%) Power BI
3 27 (3.99%) Tableau
4 17 (2.51%) SQL Server
5 14 (2.07%) Data Mining
6 12 (1.77%) Data Lake
7 11 (1.62%) Big Data
7 11 (1.62%) PostgreSQL
8 8 (1.18%) NoSQL
8 8 (1.18%) Relational Database
9 7 (1.03%) Apache Ignite
9 7 (1.03%) Azure SQL Database
9 7 (1.03%) Elasticsearch
9 7 (1.03%) Hadoop
9 7 (1.03%) Looker
10 6 (0.89%) SAP BW
11 4 (0.59%) Apache Hive
11 4 (0.59%) Oracle ODI
11 4 (0.59%) Power Query
11 4 (0.59%) Presto
Development Applications
1 45 (6.65%) JIRA
2 19 (2.81%) Jenkins
3 12 (1.77%) Git
4 10 (1.48%) MSTest
5 5 (0.74%) Crucible
6 2 (0.30%) Bitbucket
6 2 (0.30%) TeamCity
6 2 (0.30%) Vite
7 1 (0.15%) ERwin
7 1 (0.15%) Spinnaker
General
1 256 (37.81%) Social Skills
2 176 (26.00%) Finance
3 86 (12.70%) Analytical Skills
4 76 (11.23%) Retail
5 48 (7.09%) Marketing
5 48 (7.09%) Presentation Skills
6 47 (6.94%) Pharmaceutical
7 39 (5.76%) Law
8 36 (5.32%) Inclusion and Diversity
8 36 (5.32%) Public Sector
9 35 (5.17%) Manufacturing
10 28 (4.14%) Legal
11 27 (3.99%) Organisational Skills
12 23 (3.40%) Banking
13 14 (2.07%) Telecoms
14 13 (1.92%) Front Office
15 9 (1.33%) Documentation Skills
16 7 (1.03%) Back Office
17 6 (0.89%) Financial Institution
17 6 (0.89%) Social Housing
Job Titles
1 214 (31.61%) Senior
2 146 (21.57%) Project Manager
3 73 (10.78%) Analyst
4 54 (7.98%) Lead
5 53 (7.83%) Consultant
6 52 (7.68%) Architect
7 50 (7.39%) Senior Manager
8 38 (5.61%) Coordinator
9 36 (5.32%) Business Analyst
10 31 (4.58%) Developer
11 30 (4.43%) IT Manager
12 26 (3.84%) Data Programmer
12 26 (3.84%) Programmer
12 26 (3.84%) Senior Analyst
12 26 (3.84%) Senior Programmer
12 26 (3.84%) Senior Project Manager
13 24 (3.55%) IT Project Manager
14 23 (3.40%) Delivery Manager
14 23 (3.40%) Project Engineer
14 23 (3.40%) Technical Manager
Libraries, Frameworks & Software Standards
1 27 (3.99%) HTML
2 22 (3.25%) CSS
3 17 (2.51%) AngularJS
4 16 (2.36%) .NET
5 15 (2.22%) React
6 11 (1.62%) Twitter Bootstrap
6 11 (1.62%) Web Services
7 10 (1.48%) Ajax
7 10 (1.48%) jQuery
7 10 (1.48%) LINQ
8 8 (1.18%) Kafka
8 8 (1.18%) LDAP
8 8 (1.18%) RESTful
9 7 (1.03%) Lightning Web Components
9 7 (1.03%) REST
9 7 (1.03%) XML
10 6 (0.89%) ASP.NET
10 6 (0.89%) FIX Protocol
11 5 (0.74%) Middleware
11 5 (0.74%) NHibernate
Miscellaneous
1 43 (6.35%) Data Centre
2 30 (4.43%) Driving Licence
3 27 (3.99%) Life Science
4 26 (3.84%) Management Information System
5 19 (2.81%) Video Conferencing
6 17 (2.51%) Product Ownership
7 15 (2.22%) Onboarding
8 11 (1.62%) Virtual Team
9 10 (1.48%) Cloud Native
9 10 (1.48%) Public Cloud
10 9 (1.33%) Self-Motivation
11 8 (1.18%) Algorithms
11 8 (1.18%) Blockchain
11 8 (1.18%) Greenfield Project
11 8 (1.18%) Linux Command Line
11 8 (1.18%) Mobile App
12 7 (1.03%) Analytical Mindset
13 6 (0.89%) Legacy Systems
14 5 (0.74%) Social Media
14 5 (0.74%) Team-Oriented Environment
Operating Systems
1 54 (7.98%) Windows
2 30 (4.43%) Linux
3 11 (1.62%) Windows Server
4 9 (1.33%) Windows 10
5 6 (0.89%) Mac OS
6 5 (0.74%) CentOS
6 5 (0.74%) Debian
7 4 (0.59%) Android
8 2 (0.30%) Apple iOS
8 2 (0.30%) Mac OS X
8 2 (0.30%) Solaris
9 1 (0.15%) Oracle Linux
9 1 (0.15%) Red Hat Enterprise Linux
9 1 (0.15%) Unix
9 1 (0.15%) VMS
Processes & Methodologies
1 230 (33.97%) Project Management
2 193 (28.51%) Agile
3 126 (18.61%) Problem-Solving
4 124 (18.32%) Stakeholder Management
5 99 (14.62%) Change Management
6 90 (13.29%) Mentoring
7 82 (12.11%) Roadmaps
8 79 (11.67%) Waterfall
9 73 (10.78%) Analytics
10 71 (10.49%) Risk Management
11 65 (9.60%) Migration
12 63 (9.31%) Coaching
13 60 (8.86%) Scrum
14 58 (8.57%) Line Management
15 55 (8.12%) Continuous Improvement
16 54 (7.98%) PRINCE2
17 52 (7.68%) Decision-Making
18 51 (7.53%) Data Management
19 50 (7.39%) Computer Science
19 50 (7.39%) Validation
Programming Languages
1 78 (11.52%) SQL
2 65 (9.60%) Python
3 41 (6.06%) PowerShell
4 38 (5.61%) C#
5 33 (4.87%) Java
6 30 (4.43%) JavaScript
7 24 (3.55%) Bash
8 9 (1.33%) R
9 8 (1.18%) C++
10 7 (1.03%) TypeScript
11 5 (0.74%) Data Analysis Expressions
11 5 (0.74%) Scala
12 4 (0.59%) Kotlin
12 4 (0.59%) PHP
13 2 (0.30%) Apex Code
13 2 (0.30%) Rust
14 1 (0.15%) Perl
14 1 (0.15%) T-SQL
Qualifications
1 190 (28.06%) Degree
2 53 (7.83%) Security Cleared
3 33 (4.87%) Computer Science Degree
4 29 (4.28%) NVQ Level 3
4 29 (4.28%) SC Cleared
5 27 (3.99%) RIBA
6 25 (3.69%) DBS Check
7 24 (3.55%) PMI Certification
7 24 (3.55%) PMP
8 22 (3.25%) Cisco Certification
9 21 (3.10%) CCNP
10 19 (2.81%) Master's Degree
11 14 (2.07%) Numerate Degree
12 13 (1.92%) Azure Certification
13 10 (1.48%) CISM
13 10 (1.48%) CISSP
14 9 (1.33%) DV Cleared
15 8 (1.18%) AWS Certification
15 8 (1.18%) CCIE
16 7 (1.03%) Six Sigma Black Belt
Quality Assurance & Compliance
1 50 (7.39%) QA
2 26 (3.84%) Good Clinical Practice
3 16 (2.36%) PMO
4 15 (2.22%) Data Quality
4 15 (2.22%) GMP
5 11 (1.62%) GDPR
6 9 (1.33%) ISO/IEC 27001
7 7 (1.03%) Accessibility
7 7 (1.03%) COBIT
7 7 (1.03%) NIST
8 4 (0.59%) COSO
8 4 (0.59%) Cyber Essentials
8 4 (0.59%) Cyber Essentials PLUS
8 4 (0.59%) ISO 9001
9 3 (0.44%) GRC
9 3 (0.44%) ISO/IEC 27002 (supersedes ISO/IEC 17799)
10 2 (0.30%) ISO 22301
10 2 (0.30%) PCI DSS
10 2 (0.30%) SLA
11 1 (0.15%) ISO/IEC 20000
System Software
1 47 (6.94%) Active Directory
2 14 (2.07%) VMware Infrastructure
3 12 (1.77%) Virtual Desktop
4 10 (1.48%) Docker
5 5 (0.74%) VMware Server
6 4 (0.59%) Virtual Machines
6 4 (0.59%) Virtual Servers
7 3 (0.44%) VMware ESXi
7 3 (0.44%) XenDesktop
8 2 (0.30%) Firmware
8 2 (0.30%) VMware NSX
8 2 (0.30%) vSphere
Systems Management
1 18 (2.66%) Microsoft Intune
1 18 (2.66%) Terraform
2 15 (2.22%) FortiGate
3 10 (1.48%) Kubernetes
3 10 (1.48%) SCCM
4 9 (1.33%) Ansible
5 4 (0.59%) Jamf Pro
6 2 (0.30%) Grafana
6 2 (0.30%) Single Sign-On
6 2 (0.30%) vCenter Server
7 1 (0.15%) Oracle Identity Management
7 1 (0.15%) Progress Chef
7 1 (0.15%) Prometheus
7 1 (0.15%) RSA Security Analytics
Vendors
1 106 (15.66%) Microsoft
2 38 (5.61%) SAP
3 36 (5.32%) Cisco
4 33 (4.87%) Google
5 26 (3.84%) Databricks
6 23 (3.40%) Salesforce
7 21 (3.10%) Meraki
8 20 (2.95%) Fortinet
8 20 (2.95%) VMware
9 18 (2.66%) F5
10 17 (2.51%) Oracle
11 16 (2.36%) ServiceNow
12 12 (1.77%) Zscaler
13 11 (1.62%) Riverbed
14 8 (1.18%) Atlassian
14 8 (1.18%) BMC
14 8 (1.18%) CheckPoint
14 8 (1.18%) Palo Alto
14 8 (1.18%) Remedy
15 6 (0.89%) Apple